


Serviços Personalizados
Journal
Artigo
 texto em
  Inglês (pdf)
 Artigo em XML
 Referências do artigo
 Enviar este artigo por email
Indicadores
-
 Citado por SciELO
 -
 Acessos
Links relacionados
-
 Similares em
SciELO
Similares em
SciELO
Compartilhar

 Permalink
Frontera norte
versão On-line ISSN 2594-0260versão impressa ISSN 0187-7372
Frontera norte vol.35 México Jan./Dez. 2023 Epub 18-Set-2023
https://doi.org/10.33679/rfn.v1i1.2324
Article
Car Theft in Reynosa: Spatial Analysis from the Theory of Routine Activities and Crime Pattern

1El Colegio de Tamaulipas, México, v.jurado.flores@gmail.com
2El Colegio de Tamaulipas, México, ulises.genis@tamaulipas.gob.mx
This article analyzes the spatial behavior of social and economic factors associated with car theft in Reynosa, Tamaulipas, Mexico. For this, the data of car theft reports issued (from January 2016 to December 2018) before the Attorney General’s Office of the state of Tamaulipas were analyzed. The information on the social and economic variables was obtained from the Census of Population and Housing 2020 at the level of basic geostatistical area and the National Statistical Directory of Economic Units. The methodology consisted of a negative binomial regression, a simple regression, and a geographically weighted regression, both Poisson types to incorporate the non-stationarity spatial component. The results indicate that restaurants and banks are crime-attracting nodes and that the variables of routine activities present heterogeneous spatial patterns depending on the area of the city where they are present.
Keywords: car theft; spatial analysis; routine activities; crime pattern; Reynosa; Tamaulipas; Mexico
En este artículo se analiza el comportamiento espacial de los factores sociales y económicos asociados al robo de automóviles en Reynosa, Tamaulipas, México. Para ello se estudian los datos de las denuncias de este delito emitidas –de enero de 2016 a diciembre de 2018– ante la Fiscalía General de Justicia del estado de Tamaulipas. La información de las variables sociales y económicas se obtuvieron del Censo de Población y Vivienda 2020 a nivel de área geoestadística básica, y del Directorio Estadístico Nacional de Unidades Económicas. La metodología consistió en una regresión negativa binomial, así como en una regresión simple y una geográficamente ponderada, ambas de tipo Poisson para incorporar el componente de no estacionariedad espacial. Los resultados indican que los restaurantes y los bancos constituyen nodos atractores de crimen, y que las variables de actividades rutinarias presentan patrones espaciales heterogéneos dependiendo de la zona de la ciudad donde estén presentes.
Palabras clave: robo de autos; análisis espacial; actividades rutinarias; patrones del crimen; Reynosa; Tamaulipas; México
INTRODUCTION
While crime has consistently decreased in developed countries (Hodgkinson et al., 2016; Tavares & Costa, 2021), it has experienced a strong increase in developing countries (Vilalta & Fondevila, 2019). In Mexico, crime, violence, and insecurity have spread to the majority of Mexican cities (Sánchez Salinas & Fuentes Flores, 2016). In the border city of Reynosa, in addition to the rise in high-impact crimes associated with organized crime operations, property crimes such as car theft have also increased (Landero et al., 2016). The rate of car theft per 100 000 inhabitants was 125.36 in 2016, 147.55 in 2017, and 117.4 in 2018 at the state level. Although there has been a reduction in this crime at the federal entity level, the opposite is true in Reynosa, as the rate of theft per 100 000 inhabitants nearly doubled the state figure: 205.91 in 2016, 339.83 in 2017, and 288.7 in 2018 (Secretariado Ejecutivo del Sistema Nacional de Seguridad Pública [SESNSP], 2022). This study revealed that car theft is not distributed evenly or randomly throughout the city. Due to the contextual factors that influence crime distribution, vehicle theft is concentrated in criminogenic areas and where criminal opportunities exist. This concentration in certain areas can be explained by analyzing the spatial relationships of this crime with the socioeconomic and demographic characteristics of the population.
The spatial concentration of car theft has been analyzed based on the theory of crime pattern and routine activities. The former indicates that there are places considered as generators and attractors of crime, as the activities carried out in these places allow for the simultaneous presence of victims and offenders (Brantingham et al., 2017). On the other hand, the theory of routine activities suggests that the occurrence of a crime depends on three elements: a suitable target, a motivated offender, and the absence of an informal guardian, where everyday activities—both of offenders and targets—allow for the convergence of these three elements (Felson, 2017). According to the above, crime is not randomly distributed in space, but rather associated with the social and economic characteristics of the city, which determines whether places are attractors and/or generators of crime (Brantingham et al., 2017). On the other hand, social characteristics determine the conditions for the convergence of motivated offenders, suitable targets, and the absence of guardians (Felson, 2017).
To quantify the impact of context on crime, different statistical techniques have been used, each with different assumptions that affect the estimation of the parameters of interest. These difficulties should be discussed before leaning towards one technique or another. One of these techniques is the ordinary least squares (OLS) linear regression, used in several studies on crime (Copes, 1999; Hollinger & Dabney, 1999). However, it is important to consider that some assumptions of this type of regression may be poorly aligned with the actual process being observed, which can lead to concluding that certain parameters are significant when they are not in reality (Graham & Glaister, 2003; Tavares & Costa, 2021). This is due to three inadequate assumptions: that the dependent variable is continuous, that the parameters have a t-distribution, and that the relationship between the independent and dependent variables is linear.
To address these challenges, researchers have turned to Poisson regression (Osgood, 2000), which is used when the dependent variable, instead of being continuous, is a count variable (such as the number of stolen vehicles in an area), and the independent variables affect not the count itself, but rather the expectation of the statistical distribution. Although this technique has several advantages over OLS regression, it is common for real data to also deviate from the assumptions of this regression. In particular, while the expectation of a Poisson distribution is equal to its variance, most real-world data exhibit overdispersion, meaning that the variance is greater than the expectation.
Another technique is negative binomial regression (Chen et al., 2020), which is also used for count data, where the independent variables similarly affect the expectation of the distribution rather than the count itself, which is not a drawback, and it is not affected by overdispersion in the data. Lastly, another challenge in estimating the impacts of context on crime is the spatial nature of the phenomenon (Chang et al., 2011), meaning that criminal events tend to cluster spatially in some areas of cities more than others. Geographically weighting the regressions allows for the incorporation of spatial weights when estimating the parameters of interest. This is important because a variable may have a positive effect in one area while simultaneously having a negative impact in another (Nakaya et al., 2005).
This study has two main objectives: the first is to test whether the theories of routine activities and crime patterns align with the observed data on vehicle theft in Reynosa, Tamaulipas; and the second objective is to quantify the effect of the key variables from these theories and compare the results obtained from different statistical techniques. The text is organized as follows: firstly, the theory of routine activities and crime patterns is presented; secondly, the statistical techniques to be used are described and evaluated, followed by presenting the results and comparing them. The study concludes with a discussion of the results in relation to other research and, finally, presents the conclusion.
PATTERN THEORY OF CRIME AND ROUTINE ACTIVITIES
The theory of routine activities states that crime is the result of the convergence, in time and space, of three elements: a motivated offender, a suitable target, and the absence of guardians (Akers, 1999; Cohen & Felson, 1979; Felson, 2017; Haberman, 2017). A suitable target can be any person or object that a motivated offender considers vulnerable and/or attractive. This includes valuable or highly desirable items, or items that are unattended or not well-guarded. Guardians are individuals or environmental features that discourage the execution of a robbery. Lastly, a motivated offender is a person with the intention and means to carry out a criminal act (Cohen & Felson, 1979; Felson, 2017). This approach belongs to the opportunity theories and suggests that offenders seek convenient targets that offer maximum profitability and low risk (Brantingham et al., 2017).
The three central elements of this theory depend on the routine activities of individuals (Bjerregaard et al., 2020). Actions such as commuting to work and school, and engaging in recreational activities, allow for the convergence of the three elements that constitute criminal opportunity (Piza et al., 2017; Brantingham et al., 2017; Felson, 2017; Haberman, 2017). Therefore, for a crime to occur successfully, there must be at least one motivated offender, a suitable target, and the absence or intermittence of a guardian capable of preventing the act; these three elements converge in time and space due to people’s daily activities (Cohen & Felson, 1979; Badiora, 2017).
Motivated offenders choose their targets based on an assessment of the location and its deterrent factors, such as the presence of police, surveillance cameras, or witnesses, which affect the successful execution of a crime (Mao et al., 2018). For the motivated offender, there is a process of rationalization that begins with the identification of ideal targets, the absence and/or incapacity of formal and informal guardians, as well as the structure of the environment (Piza et al., 2017; Cornish & Clarke, 1987; Kalantari et al., 2018).
The crime pattern theory conceives crime as a complex phenomenon, identifying patterns in both the events and behaviors of offenders (Brantingham et al., 2017). The main argument of this theory is that there are places where crime is frequent because they provide opportunities for its commission due to the activities that take place in these locations (Brantingham & Brantingham, 1995). This theory employs three fundamental concepts: nodes, paths, and edges. Nodes are the places where criminal acts occur and tend to concentrate. Regardless of the type of crime, this theory states that most offenses will occur in a small set of places and settings (Brantingham & Brantingham, 1993). Some of these nodes are considered crime generators because they are attractive to people engaged in shopping, recreation, work, sports, and other types of activities (Brantingham et al., 2017). By concentrating both suitable targets and motivated offenders, these places create opportunities for crime (Brantingham & Brantingham, 1995). Therefore, it is expected that crime will concentrate in locations where the routine activities of offenders and targets overlap (Song et al., 2017).
On the other hand, crimes are also committed along the paths that connect the nodes, meaning that many offenses occur near or within main roads and/or at public transportation stops (Brantingham & Brantingham, 1993). Paths are particularly important in modeling routine activities as people use them to carry out their daily routines. Likewise, paths determine the places that motivated offenders will choose to find suitable targets (Brantingham & Brantingham, 1995).
Finally, the edges refer to physical or perceptual barriers that indicate changes in the environment, land use, or socioeconomic characteristics (Song et al., 2017). They are important because they constitute areas with high crime rates (Brantingham & Brantingham, 1993; Brantingham & Brantingham, 1995), as they are spaces where the presence of unknown individuals is tolerated, unlike the interior of neighborhoods where such presence elicits surveillance reactions (Brantingham & Brantingham, 1995). Additionally, edges often have mixed land uses and characteristics that concentrate criminal opportunities (Song et al., 2017). This is particularly feasible in edges formed by main avenues, where commercial areas and densely populated residential areas are clustered (Kinney et al., 2008).
Studies conducted in Canada and the United States consistently show variations in crime patterns. For example, large parking lots in commercial and service corridors are considered generators of criminal activity as they attract motivated offenders who steal vehicles in British Columbia (Kinney et al., 2008), Shenandoah (Wu et al., 2012), Charlotte (Bjerregaard et al., 2020), and Colorado (Piza & Carter, 2018). The same trend is observed in restaurants in Ontario, Canada (Quick & Brunton- Smith, 2018). On the other hand, the results from developing countries are mixed. For instance, while in Mexico and Santiago, Chile, a significant portion of car theft occurs in commercial areas (Fuentes & Jurado, 2019; Sánchez Salinas & Fuentes Flores, 2016; Vilalta & Fondevila, 2019; Oróstica & Poblete, 2019), in Shanghai, it is concentrated in residential areas and shopping malls. However, crime is less frequent in larger shopping malls due to more effective surveillance systems (Mao et al., 2018). It has also been reported that areas with mixed land uses in a Chinese city are at high risk as they are more attractive to offenders (Wang & Zhang, 2019). On the other hand, in Lagos, Nigeria, a portion of vehicle theft occurs in parking lots of commercial areas, but the majority is recorded in residential areas due to the lack of garages in most houses (Badiora, 2017). In Poland, the highest incidence of this crime not only takes place around commercial areas but also has a spillover effect into adjacent neighborhoods (Sypion-Dutkowska & Leitner, 2017), while in Tehran, Iran, the highest concentration occurs in declining urban areas with vacant lots and areas with commercial and administrative land uses (Kalantari et al., 2018). In Ankara, Turkey, a similar pattern is reported, but it also includes religious centers. Additionally, mixed land uses are considered safe during the day but become unsafe at night (Aksoy, 2021).
Regarding the variables of routine activities, the results are contradictory in developed countries. For example, Quick and Brunton-Smith (2018), Wang et al. (2019), Song et al. (2017), Bjerregaard et al. (2020), Wu et al. (2012), Piza et al. (2017), Andresen (2006), as well as Dixon and Farrell (2020), reported positive correlations between the presence of young males—considered motivated offenders—and vehicle theft in Canada and the United States. However, Copes (1999) found no correlation at all, while Roberts and Block (2013) did not observe a lasting effect.
Findings in developing countries are more consistent. In Mexico City, a positive relationship between the young male population and car theft is reported (Sánchez Salinas & Fuentes Flores, 2016; Vilalta & Fondevila, 2019), as well as in Ciudad Juárez (Fuentes & Jurado, 2019). Results in Nigeria (Badiora, 2012; 2017) and Riyadh, Saudi Arabia (Alotaibi et al., 2017), indicate similar findings. It is argued that this population group is more prone to this crime due to their physical ability, lifestyles, and environmental factors, which enable and/or encourage the commission of this offense (Dixon & Farrell, 2020).
Population density is considered as a guardian function in communities, as informal surveillance carried out by ordinary people can be more important than that of the police (Felson, 2017). However, while Piza et al. (2017), and Cahill and Mulligan (2013) found a negative relationship between population density and car theft in Colorado Springs and Tucson, Arizona, respectively, Copes (1999) reports a positive relationship in Lafayette, Louisiana. On the other hand, Andresen (2006) argues that there is no association. Other places where high population concentration is positively associated with this crime are low-income multifamily buildings in San Antonio, Texas, as reported by Tillyer and Walter (2019). A similar finding is reported in Charlotte, North Carolina, where criminal activity increases in residential areas (Dao & Thill, 2022).
In Ciudad Juárez and Mexico City, population density has a negative contribution to vehicle theft (Fuentes & Jurado, 2019; Sánchez Salinas & Fuentes Flores, 2016; Vilalta & Fondevila, 2019). Conversely, in Lagos, Nigeria, this factor is associated with an increase in crime in residential areas (Badiora, 2017). A similar situation occurs in Shanghai, China, where a higher permanent population increases the likelihood of criminal acts (Mao et al., 2018).
Single-parent households are considered suitable targets due to the absence of their members during working and/or school hours. Hannon and Defronzo (1998) reported a positive and statistically significant relationship between female-headed households and property theft, including car theft, in metropolitan counties in the United States. In the case of London, England, Sallybanks and Brown (1999) indicated that single-parent households are more likely to be victims of this crime and other property crimes. This is similar to the findings of Piza and Carter (2018) in Colorado Springs, Colorado, and as reported by Dao and Thill (2022) for Charlotte, North Carolina, regarding this type of households in low-income multifamily housing. However, Andresen (2006) noted that in Vancouver, this variable is positively associated with residential burglary but not car theft. In Mexico City (Sánchez Salinas & Fuentes Flores, 2016; Vilalta & Fondevila, 2019) and Ciudad Juárez (Fuentes & Jurado, 2019), it is reported that there is no statistically significant relationship between single-parent households and the crime in question.
On the other hand, the impact of socioeconomic status also shows consistent results. A positive relationship was found between this factor and car theft in the United States (Roberts & Block, 2013), specifically in Tucson, Arizona (Cahill & Mulligan, 2013). The same was reported in Vancouver, Canada (Andresen, 2006). Conditions of poverty and absolute income inequality contribute to long-term property crime (Tavares & Costa, 2021). On the other hand, unemployment has a deterrent effect on short-term property crimes due to increased informal surveillance, but in the long term, it has a positive effect due to increased criminal motivation (Tavares & Costa, 2021; Costantini et al., 2018).
In studies conducted in Mexico, indirect measures of socioeconomic status are used, such as educational level or access to healthcare services. In the case of Mexico City, Sánchez Salinas and Fuentes Flores (2016) reported a positive relationship between educational level and car theft. Fuentes and Jurado (2019) found a positive relationship between access to social security and this crime in Ciudad Juárez. On the other hand, Vilalta and Fondevila (2019) reported a positive association between educational level and crime in Santa Fe, Mexico; this means that neighborhoods with higher socioeconomic status are attractive targets for crime as they concentrate suitable targets.
METHODOLOGY
From the theoretical framework, eight variables were selected to assess their association with vehicle theft in Reynosa: 1) percentage of males aged 18 to 24; 2) population without access to social security (non-insured); 3) unemployment rate; 4) percentage of residents born in another state; 5) proportion of households headed by females; 6) population density; 7) the economic structure of the area. The unit of analysis is the Basic Geographical Statistical Area (Área Geográfica Estadística Básica [AGEB]) from the National Institute of Statistics and Geography (Instituto Nacional de Estadística y Geografía [INEGI], 2020), which allows for the highest level of disaggregation without being affected by confidentiality clauses. A total of 389 urban AGEBs within the municipality of Reynosa were considered for the analysis.
As a measure of vehicle theft, the investigation files from January 2016 to December 2018 were used. These files were directly provided by the General Prosecutor’s Office of the State of Tamaulipas and are georeferenced at the geographic coordinate level. Although it is known that most crimes are not reported in Mexico, vehicle theft is one of the least affected by this issue (Vilalta & Fondevila, 2019; Fuentes & Jurado, 2019). Therefore, the map of these reported incidents was overlaid onto the geo-statistical framework provided by INEGI to count the thefts per AGEB. This is the only data imputation performed since the remaining variables come from the Population and Housing Census (INEGI, 2020), which are already registered at the AGEB level. It is worth noting that some of the reports were located outside the urban geo-statistical areas but within the municipality. These were excluded from the sample.
The first variables are commonly accepted in studies of routine activities as factors associated with motivated offenders: male gender, age between 18 and 24 years, poverty, unemployment and/or informal employment, and immigration. These variables are directly available in the census data (INEGI, 2020), except for poverty status. Instead, the unemployment and employment informality rate, understood as a lack of access to social security, were used. Households headed by women are considered suitable targets for property crimes, as supported by the literature on the subject (Sallybanks & Brown, 1999). Population density was used as a measure of informal surveillance. As discussed earlier, densely populated areas can deter vehicle theft through informal surveillance.
It has been proven that certain economic activities attract car theft, and to take them into account, data from the National Directory of Economic Units (INEGI, 2018) was used, specifically the number of establishments within each AGEB of the same industry. Four digits of the North American Industry Classification System (Sistema de Clasificación Industrial de América del Norte [SCIAN]) were used. Several models were tested using different combinations of economic activities based on their correlation with vehicle theft. However, most of them resulted in multicollinearity issues, so it was reduced to only two activities that could be used: multiple banking services and food and beverage preparation services.
One source of uncertainty in identifying the effect of the selected variables on the number of thefts is the statistical model to be used. Various strategies have been applied, each with its advantages and disadvantages, which will be discussed below. First, there is linear regression using the well-known method of ordinary least squares (OLS), which is typically modeled as follows:
where y is the number of thefts, α the autonomous number of thefts—that is, what is expected to be observed regardless of the value of the rest of the variables— xi is the value of the covariates, and β represents the marginal effect of increasing the value of each covariate by one unit. This method has the disadvantage of imposing a linear relationship between the independent variables and the dependent variable, meaning that the number of thefts increases in a fixed proportion with respect to the other covariates. Additionally, theoretically, the dependent variable is required to be continuous, which sometimes predicts impossible values such as negative or decimal values. Although the use of ordinary least squares (OLS) is often justified when the expected value of the dependent variable is very high, it is worth noting that in the data for vehicle theft in Reynosa, there are few AGEBs that concentrate a high number of cases, while many others do not have any cases during the period of interest.
In another alternative used when the dependent variable is a count variable, it is represented as a random variable following a Poisson distribution, whose density is given by:
where Y is the random variable, y is a particular value, and μ is the statistical expectation. Another characteristic of the Poisson distribution is that μ is also its variance, making it the sole parameter. Given that the aim is to quantify the influence of the covariates on the average observed robberies in a region, the conditional density is used, but conditioned on x:
with μi = exp(xiβ), where xi is the set of covariates in area i. In other words, this allows for two things: first, that the expected number of robberies in each AGEB is different, and second, that this expected value increases or decreases with the rest of the covariates. Poisson regression does not predict impossible values because it assumes that the data are counts, where there cannot be negative or decimal values, except for the average, which can be decimal. Therefore, Poisson regression aligns more closely with what is expected in the real world with crime data compared to OLS. The values of the β coefficients were estimated using the generalized linear model.
On the other hand, it is common to observe in crime data that the observed variance is different from the mean, usually larger, which is known as overdispersion, this can lead to poor model fit (Chen et al., 2020; Park et al., 2016; Hope & Norris, 2013). In particular, it results in an underestimation of standard errors, which contaminates statistical tests and increases the number
of false positives (Yang et al., 2010; Da Silva & Rodrigues, 2014), causing some parameters to be deemed statistically significant when they are not. One way to deal with this issue is to use negative binomial regression, which is not affected by this problem. Under a similar rationale, it can be assumed that the negative binomial variable is distributed as follows:
where yi is the number of car thefts in AGEB i, xi the explanatory variables, β the coefficients, and α is the overdispersion parameter. Note that if there is no overdispersion, that is, if α = 0 , the function reduces to a Poisson distribution. Negative binomial regression is even better than Poisson regression because it is a generalization that allows for data overdispersion. Additionally, if such overdispersion does not exist, the values would be the same as in a Poisson regression. On the other hand, fewer statistically significant parameters are expected to be found because the standard error is not underestimated. This implies that it is less prone to yielding false positives.
In addition to the above, it is also possible to incorporate spatial analysis using the technique of geographically weighted regression. In this approach, instead of conducting a single regression analysis, n regressions are performed: one for each geographic unit, where only the neighboring AGEBs within a certain distance are included. This allows for capturing the effect of spatial heterogeneity among areas. In other words, a variable may increase the average number of stolen cars in one region but decrease this likelihood in another area. When a variable does not have a spatial effect, it is said to be stationary in space. The techniques described above impose the restriction that the effects are stationary in space. However, if in reality space does have an effect, it could be hidden in spatial stationarity techniques. The geographically weighted Poisson regression (GWPR) was calculated using ArcGis Pro 2.9 with neighborhood distance bands. The golden search method was used for neighborhood selection, and it was weighted with a local bi- square scheme. This means that each value is weighted according to the following formula:
where wij is the weight of geographic unit i with respect to geographic unit j, dij is the Euclidean distance from i to j, and bi is the bandwidth. The latter should be chosen empirically based on the best fit of the model to the data, which is achieved with the minimum value of the Akaike Information Criterion (AIC), which is a measure of information loss due to model specification. A lower AIC indicates less information loss and therefore a better fit. Additionally, it should be verified that the local versions of the regressions — that is, those that include the spatial factor — have a better fit than the global version (which ignores the spatial effect).
The reason for using different techniques is to discuss the importance of the methodological assumptions proposed by literature. Firstly, because different authors have relied on linear regression, which can be very restrictive for analyzing crime data that are count-based rather than continuous. Secondly, overdispersion can invalidate the results of a Poisson regression, leading to false positives. Typically, negative binomial regression is presented as the best alternative for analyzing crime data, as it is reliable in the presence of overdispersion. However, it imposes an important restriction: spatial stationarity. If the effect of variables varies across geographic units, important crime effects may also be concealed. This issue is addressed by using a geographically weighted Poisson regression.
STUDY AREA
Reynosa is the head city of the municipality of the same name, the largest in the state of Tamaulipas. In 2020, the city had a population of 704 767 inhabitants (INEGI, 2020). It is located on the Mexico-United States border and shares a border with McAllen, Texas. The border status and port of entry have contributed to the presence of organized crime, particularly drug trafficking. Since 2010, the city has experienced an increase in criminal activity due to the diversification of organized crime activities, such as extortion, kidnapping, and vehicle theft (Landero et al., 2016).
The number of vehicle thefts began to increase in 2010, reaching its peak at 1 103.84 thefts per 100 000 inhabitants in 2014, and started to decline to 285.80 in 2015. Since then, the incidence has stabilized, but Reynosa continues to have the highest number at the state level (SESNSP, 2022).
RESULTS
On average, there are 4.34 vehicle thefts reported per AGEB in Reynosa, with a standard deviation of 10.02. This indicates a high degree of spatial concentration of the variable. Additionally, a single AGEB reported 95 cases; one in every 10 thefts occurs in only two out of the 389 AGEBs; one- third of the thefts occur in 11 of these areas, and half of them occur in just 29. In contrast, there are 142 geographic units with no reported cases. Table 1 shows the descriptive statistics of all the analyzed variables.
Table 1. Descriptive Statistics
| Variable | n | Zeros | Average | Standard deviation |
Minimum | Maximum |
|---|---|---|---|---|---|---|
| Car theft | 389 | 142 | 4.34 | 10.02 | 0 | 95 |
| Population density | 389 | 24 | 62.65 | 48.23 | 0 | 232.05 |
| Unemployment rate | 389 | 107 | 0.01 | 0.01 | 0 | 0.06 |
| Female-headed households (%) | 389 | 34 | 0.29 | 0.11 | 0 | 0.64 |
| Male population, 18 to 24 years old (%) | 389 | 38 | 0.05 | 0.02 | 0 | 0.12 |
| Born in another state (%) | 389 | 31 | 0.29 | 0.14 | 0 | 0.66 |
| Non-insured (%) | 389 | 32 | 0.19 | 0.09 | 0 | 0.44 |
| Multiple banking | 389 | 253 | 1.65 | 4.72 | 0 | 50 |
| Food preparation services and alcoholic and non-alcoholic beverages |
389 | 136 | 4.47 | 7.03 | 0 | 53 |
Source: Own elaboration with data from INEGI (2018, 2020).
In the rest of the variables, there is heterogeneity in their respective levels. Population density ranges from 0 to 232, with an average of 62 inhabitants per hectare. The unemployment rate varies from 0 to 6%, with an average of 1%. Female-headed households range from 0 to 64% of all households. The male population aged 18 to 24 years accounts for 0 to 12% of the population, with an average of 5%. Individuals born in another state range from 0 to 66%, with an average of 29%. The population without social security coverage ranges from 0 to 44%, with an average of 19%. Regarding the number of economic units dedicated to multiple banking, including commercial banks, ATMs, etc., there is an average of 1.65 units per AGEB, with a maximum of 50 and a minimum of 0. The services of food and beverage preparation range from 0 to 53, with an average of 4.5. As can be seen, the conditions of each AGEB vary greatly.
In Table 2, the correlation coefficient between each variable and vehicle thefts per AGEB is shown. Except for the number of multiple banking units and food and beverage preparation establishments, there is little correlation with car theft. This is a first indicator of how these activities tend to attract crime. On the other hand, population density is negatively correlated with this crime, which was predictable from theory because this variable serves as an informal surveillance mechanism, but the coefficient value is not relatively large.
Table 2. Variable Correlation
| Variable | Correlation coefficient |
|---|---|
| Multiple banking | 0.828 |
| Food and beverage preparation services | 0.5342 |
| Non-insured population | 0.0046 |
| Unemployment rate | -0.0184 |
| Female-headed households | -0.0282 |
| Population born in another state | -0.1057 |
| Male population from 18 to 24 years old | -0.1118 |
| Population density | -0.2192 |
Source: Own elaboration with data from INEGI (2018, 2020).
Regressions
All the results in Table 3 correspond to ordinary least squares, Poisson, and negative binomial regressions. Overall, some figures are consistent with the theoretical framework as well as with the methodology. For example, in the OLS regression, the economic activities variables have the greatest impact, given their high correlation with the number of car thefts. It was also expected to find a larger number of statistically significant variables in the Poisson regression (all variables except for the population without social security coverage). Lastly, it was also expected that the number of non-significant variables would increase in the binomial regression. As mentioned before, this is because in the binomial regression, the standard error is not underestimated due to data overdispersion. The difference in statistical significance of some variables was used as an indicator of the presence of actual overdispersion in the data. These variables, which were non- significant in the negative binomial regression but significant in the Poisson regression, are the young male population and the population born in another state.
Table 3. Regression Results
| Term | OLS | Poisson | Negative binomial |
|---|---|---|---|
| Intercept | 0.1894 | 0.3042** | 0.2117 |
| Young male population | -3.9232 | 6.4054*** | 5.2598 |
| Non-insured population | -1.1281 | -0.2476 | -0.8403 |
| Unemployment rate | 22.8083 | 15.9762*** | 27.5723*** |
| Population born in another state | 0.9587 | -1.0682*** | -1.202 |
| Female-headed households | 3.5688 | 2.6495*** | 2.9821*** |
| Population density | -0.0101 | -0.0079*** | -0.0063*** |
| Multiple banking | 1.5804*** | 0.0754*** | 0.1208*** |
| Food and beverage preparation | 0.2279*** | 0.0331*** | 0.0696*** |
Source: Own elaboration.
Note: Results are statistically significant:
**at 1 percent;
***at 0.1 percent.
Regarding the OLS regression, the number of multiple banking units and the number of food and beverage preparation establishments are positive and statistically significant, although multiple banking units have a greater impact. This pattern is also observed in the other two regressions, indicating that banks, restaurants, bars, etc., are frequent locations for car thefts in Reynosa, which is consistent with the theory.
On one hand, restaurants and banks tend to be located in places with ample parking space, such as shopping centers. This aligns with findings reported by Lu (2006) in Buffalo, and Levy and Tartaro (2010) in New Jersey. Piza et al. (2017) also noted that thefts concentrate around restaurants and shopping centers. In Mexico, Fuentes and Jurado (2019) indicate that the Historic Center is home to bars, restaurants, banks, and nightlife establishments, and has high rates of car theft. Vilalta and Fondevila (2019) present similar results in Santa Fe, Mexico City. On the other hand, the population without social security coverage is not significant in any of the three regressions, suggesting that informality is not associated with this type of crime.
Unemployment in the region is the factor that most increases the likelihood of a higher number of car thefts on average, according to the Poisson and negative binomial regressions. This is consistent with the idea that economically disadvantaged individuals are more motivated to commit such offenses. This contradicts the findings of Cantor and Land (1985), who indicated a negative relationship between car theft and unemployment, which they attributed to increased informal surveillance. However, it aligns with the findings of Coupe and Blake (2006), who also noted that car thefts occur during unconventional hours, such as midnight or early in the morning. D’Alessio et al. (2012) also concluded that unemployment is negatively correlated with car thefts committed during the week in residential areas but positively linked to those that occur during the night and early mornings. On the other hand, a higher number of households headed by women is associated with more car thefts in the area, which can be interpreted as a suitable target, as discussed in the theoretical framework.
Finally, the higher the population density of the area, the lower the probability of observing a high number of thefts. In densely populated regions, there is greater informal surveillance that discourages motivated offenders, even if there is a suitable target. This aligns with other findings from the opportunity theory (Cahill & Mulligan, 2013; Fuentes & Jurado, 2019; Vilalta & Fondevila, 2019; Sánchez Salinas & Fuentes Flores, 2016), but it also contradicts other studies that find more thefts in areas with higher population density (Copes, 1999; Malczewski & Poetz, 2005), and others that argue that this occurs in places with multi-family buildings (Bjerregaard et al., 2020) or near universities (Lu, 2006; Piza et al., 2017), as well as in residential areas in Shanghai (Mao et al., 2018) and Nigeria (Badiora, 2017; 2012). Clearly, the population density will have different effects depending on the factors associated with the observed high densities.
In summary, the results obtained from the negative binomial regression are very similar to what would be expected according to theory: the places with the highest number of car thefts are those with restaurants, bars, and multiple banking services, high unemployment rates, households headed by women, and low population density. Additionally, it is also confirmed that data overdispersion leads to false positives in the Poisson regression, and the negative binomial regression can overcome these issues, making it a better option compared to the other two.
Geographically Weighted Poisson Regression
The results of the geographically weighted regression are more interesting, as observed in Map 1. In this map, a different regression is run for each AGEB, including only the nearby AGEBs according to the criteria described in the methodology. Therefore, the impact of a variable can vary from one location to another, depending on its unobserved characteristics. This is where the advantage of spatial techniques lies: it is not expected to observe the same effect in every region, but rather some regions will have a stronger effect, while others may have a weaker or non-existent effect, or even opposite effects may be observed.
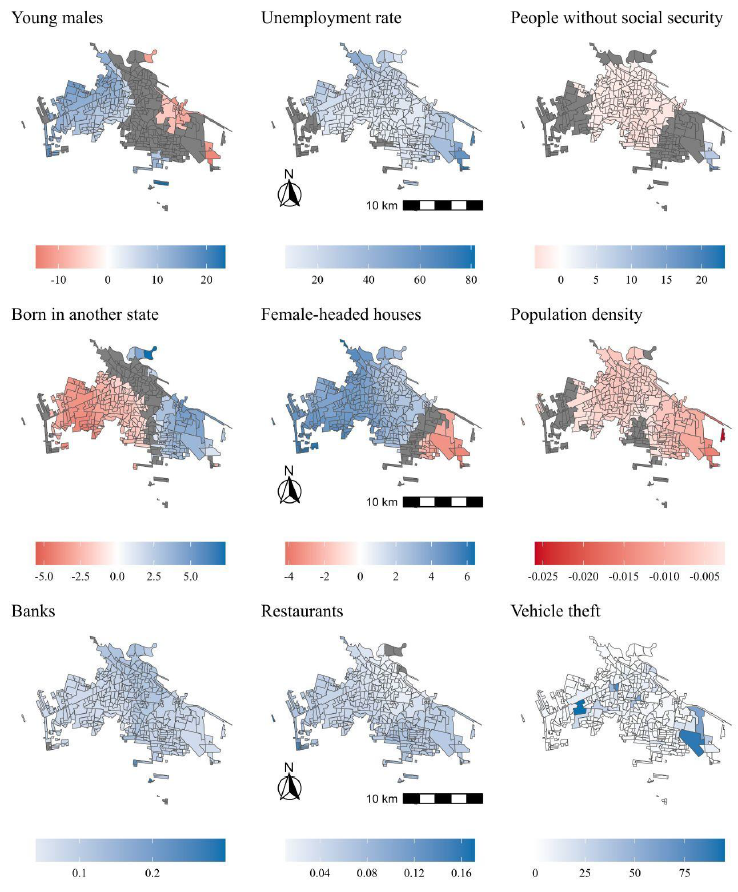
Firstly, it is remarkable how the number of multiple banking units, the number of food and beverage preparation establishments, population density, unemployment rate, and the percentage of female-headed households are significant and have the same sign in most geographical units of the city.
This means that car theft in Reynosa occurs to a greater extent in economic activity nodes rather than residential areas of the city (Andresen, 2006; Piza & Carter, 2018). In Santiago, Chile, a concentration of this crime was reported in areas with shopping centers and food service establishments in the affluent zones of the city (Oróstica & Poblete, 2019), as well as in a Chinese city where areas with a higher floating population associated with commercial and mixed land uses attract motivated offenders due to the concentration of suitable targets (Wang & Zhang, 2019). This finding also aligns with what was mentioned by Fuentes and Jurado (2019) in Ciudad Juárez, who found a concentration of thefts in the Historic Center of the city and its sub-commercial centers; Sánchez Salinas and Fuentes Flores (2016) in the central districts of Mexico City; and Vilalta and Fondevila (2019) in Santa Fe, Mexico City. Similar patterns are reported in Tehran (Kalantari et al., 2018) and Ankara (Aksoy, 2021).
This is complemented by the research conducted by Dao and Thill (2022), who indicate that low commercial activity has the most influential statistical association with a low index of car thefts. This economic condition is complemented by high levels of employment, education, and homeownership.
On the contrary, unemployment increases the expected number of cases in all regions, although it is also clear that this effect is greater in the eastern and northern parts. This result contradicts what is stated in the literature review, which indicates that the relationship between unemployment and theft occurs in the long term (Tavares & Costa, 2021; Costantini et al., 2018) and is consistent with what is reported by Haberman (2017), who mentions the positive relationship between economic inequality, unemployment, and property theft.
Population density decreases the average number of car thefts in all regions, albeit with different intensities, which is contrary to the positive association between high population density in multifamily buildings and property theft (Tillyer & Walter, 2019; Dao & Thill, 2022). This indicates that the type of residential arrangement influences the behavior of this crime in residential areas, which goes beyond the scope of this study. However, it is relevant to clarify that low-income housing complexes are not uniformly criminogenic; what makes them prone to crime is the presence of non- residential land uses (Aksoy, 2021; Dao & Thill, 2022). Despite this, population density is considered a deterrent due to informal surveillance.
On the other hand, the percentage of female-headed households is more interesting to analyze spatially, as it attracts thefts in the northern, central, and western areas of Reynosa, but repels them in the eastern part of the city. Previous studies that include these types of households as an explanatory variable, present noteworthy results. For example, Hannon and Defronzo (1998) report a positive and statistically significant relationship between female-headed households and property theft, including vehicle theft, in metropolitan counties in the United States. In Charlotte, North Carolina, single-parent families are considered to be associated with car theft, although this occurs in conjunction with other conditions such as low-income families, unemployed young men, and multifamily housing (Dao & Thill, 2022). Haberman (2017) finds that female participation in the labor market is positively associated with property larcenies. In London, England, Sallybanks and Brown (1999) indicate that single-parent households are more prone to property crimes, including car theft, as do Piza and Carter (2018). Andresen (2006) reports that in Vancouver, Canada, this variable is associated with household theft but not with car theft. Similarly, Sánchez Salinas and Fuentes Flores (2016) and Vilalta and Fondevila (2019) note that this variable is not significant in Mexico City, and Fuentes and Jurado (2019) have similar findings in Ciudad Juárez.
In the particular case of Reynosa, this pattern can be attributed to the fact that in the eastern part of the city there are few residential areas, with an area dominated by industry, wholesale trade, and services, as well as a road that connects to the neighboring municipality of Río Bravo. In other words, despite constituting a boundary, there are few criminal opportunities in this area. On the western side, an area identified as attracting theft is the city’s commercial corridor, which is the affluent zone, indicating a spillover effect towards residential areas adjacent to shopping centers (Dao & Thill, 2022). Despite the above, this finding requires further investigation in future studies.
In the case of young males, there is an interesting pattern similar to that of female-headed households: in the western part of the city, they are positively associated with more vehicle thefts, while in the eastern part, there are fewer incidents. Since these individuals are considered motivated offenders in the literature on the subject, this finding is consistent with the findings of Sánchez Salinas and Fuentes Flores (2016) and Vilalta and Fondevila (2019) in Mexico City, as well as Fuentes and Jurado (2019) in Ciudad Juárez. However, in the northeastern part of Reynosa, this population variable does not appear to be positively related to the crime in question. It is worth mentioning that this area contains two university campuses, a military camp, and a cultural park. This result contrasts with the findings of Bjerregaard et al. (2020) and Dao and Thill (2022), who indicate that this type of criminal activity occurs more frequently on campuses and in their surroundings. This area of Reynosa, given its physical characteristics and scattered buildings, is considered a neutral area for crime (Brantingham & Brantingham, 1995): it does not attract motivated offenders because successfully committing a robbery in this area is highly challenging. It is important to emphasize that this effect is not present in all AGEBs, so it is not surprising that it did not yield statistically significant results in regressions that ignore the spatial impact.
It is also noteworthy that the population born in another state shows an opposite pattern: attracting crime in the east and repelling it in the west. First of all, this is interesting because this variable did not seem to have an effect in the negative binomial regression. The results of the spatial Poisson regression explain why this occurs: first, because the impact does not exist in a significant portion of Reynosa’s AGEBs, and second, because its incidence is heterogeneous. This highlights the importance of including space in the analysis of car theft. In Reynosa, the migrant population mostly has a repellent relationship with this crime in the central-west part of the city. Due to its economic characteristics, the city attracts many immigrants to work in the industry.
Finally, the non-insured population was not significant in any regression, although it exhibits a very particular behavior in the spatial regression: while it has a tiny negative effect in the geographic center of Reynosa, its impact is very important in the eastern part of the city. This seems to suggest that the effect found is rather an accidental correlation, as it is highly concentrated in a sparsely populated region.
The geographical patterns found make it clear that spatial non-stationarity is very important in estimating the effects of crime covariates: while some variables are not significant in stationary regressions, they exhibit highly heterogeneous patterns in geographically weighted regressions, which could partly explain why they are not significant in other techniques. A more detailed description of the parameters is presented in Table 4.
Table 4. Quartiles of the Geographically Weighted Poisson Regression
| Variable | Minimum | Q1 | Q2 | Q3 | Maximum |
|---|---|---|---|---|---|
| Population density | -0.026 | -0.007 | -0.005 | -0.004 | 0.014 |
| Unemployment rate | -1.098 | 10.992 | 15.376 | 21.195 | 87.178 |
| Female-headed households | -4.188 | 2.057 | 3.316 | 4.441 | 6.583 |
| Male population, 18 to 24 years old | -18.847 | -0.559 | 4.901 | 12.056 | 32.317 |
| Population born in another state | -5.55 | -2.53 | -1.555 | 0.672 | 7.356 |
| Non-insured population | -7.77 | -2.462 | -1.948 | -0.983 | 23.258 |
| Multiple banking | -0.742 | 0.072 | 0.08 | 0.096 | 0.3 |
| Food and beverage preparation | -0.002 | 0.035 | 0.05 | 0.059 | 0.171 |
Source: Own elaboration.
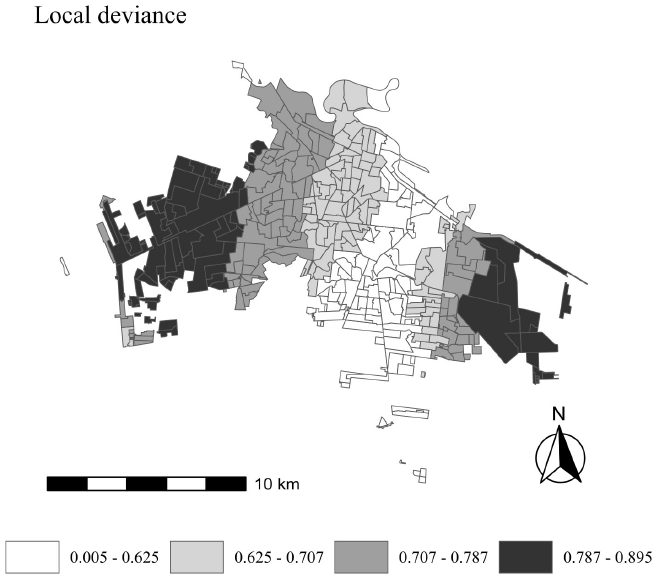
The spatial variation of the explanatory power of the model is shown in Map 2. As can be observed, the geographic units with better fit, or those that better explain car theft, are located in the western and northern areas of Reynosa, which include the historic center, the border bridge, the city’s commercial corridors, and the mixed-use area towards Monterrey. They are also located in the eastern part, where the airport and industrial corridors are found. In these areas, local R2 values range from 0.707 to 0.895, while the lower variations correspond to the central axis of the city, which concentrates AGEBs with high and very high levels of social deprivation, with R2 values ranging from 0.005 to 0.625.
The use of routine activity theory and crime pattern theories has allowed for the identification of relevant factors that affect the level of car theft in this border city. Global models indicate that the incidence of this crime is directly related to certain opportunity factors, such as banks, food and beverage establishments, and unemployment. On the other hand, informal surveillance measures, such as population density, have an inverse impact on this criminal act, as indicated by routine activity theory.
CONCLUSION
The variables of routine activities are reliable indicators for estimating the number of car thefts in a region. It can be concluded that there is a good fit between the data and the routine activities theory based on the four applied statistical techniques, indicating the robustness of the findings.
The nodes of economic activity and sociodemographic variables yield results that align more with those of the United States and Canada rather than developing countries. For instance, there is a higher occurrence of car thefts in economic activity nodes such as banks and restaurants than in residential areas. University campuses located in areas with extensive open spaces do not attract the commission of this crime, despite the constant presence of young males. Additionally, population density acts as a deterrent for this type of crime, which is also similar to the patterns
observed in the United States and Canada. This differs from the findings in Lagos and Shanghai, where a positive relationship between population density and car theft has been reported.
On the other hand, the remaining variables exhibit different and even contradictory patterns between the east and west of Reynosa. This highlights the importance of employing spatial techniques in crime analysis, as even within the same city, one should not expect to find the same effect. Ordinary least squares and Poisson regression techniques proved to be of limited utility compared to negative binomial regression, which is more reliable in addressing data overdispersion. However, even with these advantages, geographically weighted Poisson regression was more useful in revealing the differentiated patterns that occur in space.
As for the limitations of the study, it is worth noting that the database used only contained the date of the theft, but not the time, which could have provided further insight into the observed differentiated effects. Additionally, it did not include information about the perpetrators, which could have shed light on their characteristics. For future research, it is suggested to investigate the reasons behind the differentiated effects found in this study.
REFERENCES
Akers, R. L. (1999). Criminological theories (2.a ed.). Fitzroy Dearborn. [ Links ]
Aksoy, E. (2021). Evaluation of crime prevention theories through environmental design in urban renewal: A case study of Ankara-The vicinity of Hacı Bayram Mosque. Iconarp International Journal of Architecture and Planning, 9(2), 896-918. https://doi.org/10.15320/ICONARP.2021.185 [ Links ]
Alotaibi, N. I., Evans, A. J., Heppenstall, A. J. y Malleson, N. S. (2019). How well does western environmental theory explain crime in the Arabian context? The case study of Riyadh, Saudi Arabia. International Criminal Justice Review, 29(1), 5-32. https://doi.org/10.1177/1057567717709497 [ Links ]
Andresen, M. A. (2006). A spatial analysis of crime in Vancouver, British Columbia: A synthesis of social disorganization and routine activity theory. The Canadian Geographer / Le Géographe Canadien, 50(4), 487-502. https://doi.org/10.1111/j.1541-0064.2006.00159.x [ Links ]
Badiora, A. (2012). Motor vehicle theft: an examination of offenders’ characteristics and targeted locations in Lagos, Nigeria. Kriminoloji Dergisi: Turkish Journal of Criminology and Criminal Justice, 4(2), 59-70. [ Links ]
Badiora, A. I. (2017). Ecological theories and spatial decision making of motor vehicle theft (MVT) offenders in Nigeria. Journal of Applied Security Research, 12(3), 374-391. https://doi.org/10.1080/19361610.2017.1315697 [ Links ]
Bjerregaard, B., Akin, S., Moses, S. y Towers, C. (2020). Spatial and temporal variations in motor vehicle theft in a university environment. Journal of Crime and Justice, 44(5), 595-615. https://doi.org/10.1080/0735648X.2020.1842789 [ Links ]
Brantingham, P. J., Brantingham, P. L. y Andresen, M. A. (2017). The geometry of crime and crime pattern theory. En R. Wortley y M. Townsley (Eds.), Environmental criminology and crime analysis (pp. 98-116). Routledge. [ Links ]
Brantingham, P. L. y Brantingham, P. J. (1993). Nodes, paths and edges: Considerations on the complexity of crime and the physical environment. Journal of Environmental Psychology, 13(1), 3-28. https://doi.org/10.1016/S0272-4944(05)80212-9 [ Links ]
Brantingham, P. L. y Brantingham, P. J. (1995). Criminality of place: crime generators and crime attractors. European Journal on Criminal Policy and Research, 3(3), 5-26. https://doi.org/10.1007/BF02242925 [ Links ]
Cahill, M. E. y Mulligan, G. F. (2013). The determinants of crime in Tucson, Arizona. Urban Geography, 24(7), 582-610. https://doi.org/10.2747/0272-3638.24.7.582 [ Links ]
Cantor, D. y Land, K. C. (1985). Unemployment and crime rates in the Post-World War II United States: A theoretical and empirical analysis. American Sociological Review, 50(3), 317-332. https://doi.org/10.2307/2095542 [ Links ]
Chang, D. C., Eastman, B., Talamini, M. A., Osen, H. B., Tran Cao, H. S. y Coimbra, R. (2011). Density of surgeons is significantly associated with reduced risk of deaths from motor vehicle crashes in US counties. Journal of the American College of Surgeons, 212(5), 862-866. https://doi.org/10.1016/j.jamcollsurg.2011.01.057 [ Links ]
Chen, J., Liu, L., Xiao, L., Xu, C. y Long, D. (2020). Integrative analysis of spatial heterogeneity and overdispersion of crime with a geographically weighted negative binomial model. ISPRS International Journal of Geo-Information, 9(60) 1-15. https://doi.org/10.3390/ijgi9010060 [ Links ]
Cohen, L. E. y Felson, M. (1979). Social change and crime rate trends: A routine activity approach. American Sociological Review, 44 (4), 588-608. https://doi.org/10.2307/2094589 [ Links ]
Copes, H. (1999). Routine activities and motor vehicle theft: A crime specific approach. Journal of Crime and Justice, 22(2), 125-146. https://doi.org/10.1080/0735648X.1999.9721097 [ Links ]
Cornish, D. B. y Clarke, R. V. (1987). Understanding crime displacement: An application of rational choice theory. Criminology, 25(4), 933-948. https://doi.org/10.1111/j.1745- 9125.1987.tb00826.x [ Links ]
Costantini, M., Meco, I. y Paradiso, A. (2018). Do inequality, unemployment and deterrence affect crime over the long run? Regional Studies, 52(4), 558-571. https://doi.org/10.1080/00343404.2017.1341626 [ Links ]
Coupe, T., y Blake, L. (2006). Daylight and darkness targeting strategies and the risks of being seen at residential burglaries. Criminology, 44(2), 431-464. https://doi.org/10.1111/j.1745- 9125.2006.00054.x [ Links ]
D 'Alessio, S. J., Eitle, D. y Stolzenberg, L. (2012). Unemployment, guardianship, and weekday residential burglary. Justice Quarterly, 29(6), 919-932. https://doi.org/10.1080/07418825.2011.605073 [ Links ]
Da Silva, A. R. y Rodrigues, T. C. V. (2014). Geographically weighted negative binomial regression–incorporating overdispersion. Statistics and Computing, 24(5), 769-783. https://doi.org/10.1007/s11222-013-9401-9 [ Links ]
Dao, T. H. D. y Thill, J.-C. (2022). CrimeScape: Analysis of socio-spatial associations of urban residential motor vehicle theft. Social Science Research, 101. https://doi.org/10.1016/j.ssresearch.2021.102618 [ Links ]
Dixon, A. y Farrell, G. (2020). Age-period-cohort effects in half a century of motor vehicle theft in the United States. Crime Science, 9(17), 1-13. https://doi.org/10.1186/s40163-020-00126-5 [ Links ]
Felson, M. (2017). The routine activity approach. En R. Wortley y M. Townsley (Eds.), Environmental criminology and crime analysis (2 a. ed.) (pp. 87-97). Routledge. [ Links ]
Fuentes, C. M. y Jurado, V. (2019). Spatial pattern of motor vehicle thefts in Ciudad Juárez, Mexico: an analysis using geographically weighted Poisson regression. Papers in Applied Geography, 5(1-2), 176-191. https://doi.org/10.1080/23754931.2019.1663755 [ Links ]
Graham, D. J. y Glaister, S. (2003). Spatial variation in road pedestrian casualties: the role of urban scale, density and land-use mix. Urban Studies, 40(8), 1591-1607. https://doi.org/10.1080/0042098032000094441 [ Links ]
Haberman, C. P. (2017). Overlapping hot spots?: examination of the spatial heterogeneity of hot spots of different crime types. Criminology & Public Policy, 16(2), 633-660. https://doi.org/10.1111/1745-9133.12303 [ Links ]
Hannon, L., y Defronzo, J. (1998). Welfare and property crime. Justice Quarterly, 15(2), 273-288. https://doi.org/10.1080/07418829800093741 [ Links ]
Hodgkinson, T., Andresen, M. A. y Farrell, G. (2016). The decline and locational shift of automotive theft: A local level analysis. Journal of Criminal Justice, 44, 49-57. https://doi.org/10.1016/j.jcrimjus.2015.12.003 [ Links ]
Hollinger, R. y Dabney, D. (1999). Motor vehicle theft at the shopping centre: An application of the routine activities approach. Security Journal, 12(1), 63-78. [ Links ]
Hope, T. y Norris, P. A. (2013). Heterogeneity in the frequency distribution of crime victimization. Journal of Quantitative Criminology, 29(4), 543-578. https://doi.org/10.1007/s10940-012- 9190-x [ Links ]
Instituto Nacional de Estadística y Geografía (Inegi). (2018). Directorio Estadístico Nacional de Unidades Económicas. https://www.inegi.org.mx/app/descarga/?ti=6 [ Links ]
Instituto Nacional de Estadística y Geografía (Inegi). (2020). Censo de Población y Vivienda 2020. https://www.inegi.org.mx/programas/ccpv/2020/ [ Links ]
Kalantari, M., Ziyari, K., Gholipour, S. y Sadeghi, A. (2018). Spatio-temporal analysis of theft- related crimes in inefficient urban textures: a case study of the central part of Tehran. Journal of Geography and Spatial Justice, 1(2), 38-55. [ Links ]
Kinney, J. B., Brantingham, P. L., Wuschke, K., Kirk, M. G. y Brantingham, P. J. (2008). Crime attractors, generators and detractors: Land use and urban crime opportunities. Built Environment, 34(1), 62-74. https://doi.org/10.2148/benv.34.1.62 [ Links ]
Landero, C., Villarreal, K., Vargas, C. y Camacho, M. (2016). Carjacking: ¿victimización generada por la delincuencia organizada en Reynosa, Tamaulipas? Perspectivas Sociales, 18(2), 106-136. [ Links ]
Levy, M. P. y Tartaro, C. (2010). Auto theft: A site-survey and analysis of environmental crime factors in Atlantic City, NJ. Security Journal, 23(2), 75-94. https://doi.org/10.1057/palgrave.sj.8350088 [ Links ]
Lu, Y. (2006). Spatial choice of auto thefts in an urban environment. Security Journal, 19(3), 143-166. https://doi.org/10.1057/palgrave.sj.8350008 [ Links ]
Malczewski, J. y Poetz, A. (2005). Residential burglaries and neighborhood socioeconomic context in London, Ontario: Global and local regression analysis. The Professional Geographer, 57(4), 516-529. https://doi.org/10.1111/j.1467-9272.2005.00496.x [ Links ]
Mao, Y., Dai, S., Ding, J., Zhu, W., Wang, C. y Ye, X. (2018). Space-time analysis of vehicle theft patterns in Shanghai, China. ISPRS International Journal of Geo-Information, 7(9), 357. https://doi.org/10.3390/ijgi7090357 [ Links ]
Nakaya, T., Fotheringham, A. S., Brunsdon, C. y Charlton, M. (2005). Geographically weighted poisson regression for disease association mapping. Statistics in Medicine, 24(17), 2695-2717. https://doi.org/10.1002/sim.2129 [ Links ]
Oróstica, K. y Poblete, B. (2019). Mining the relationship between car theft and places of social interest in Santiago Chile. En L. Liu y R. White (Eds.), The Web Conference 2019 (pp. 811- 814). Association for Computing Machinery. https://doi.org/10.1145/3308558.3316464 [ Links ]
Osgood, D. W. (2000). Poisson-based regression analysis of aggregate crime rates. Journal of Quantitative Criminology, 16(1), 21-43. https://doi.org/10.1023/A:1007521427059 [ Links ]
Park, S. M., Tark, J. y Cho, Y. (2016). Victimization immunity and lifestyle: A comparative study of over-dispersed burglary victimizations in South Korea and U.S. International Journal of Law, Crime and Justice, 45, 44-58. https://doi.org/10.1016/j.ijlcj.2015.10.004 [ Links ]
Piza, E. L. y Carter, J. G. (2018). Predicting initiator and near repeat events in spatiotemporal crime patterns: an analysis of residential burglary and motor vehicle theft. Justice Quarterly, 35(5), 842-870. https://doi.org/10.1080/07418825.2017.1342854 [ Links ]
Piza, E., Feng, S., Kennedy, L. y Caplan, J. (2017). Place-based correlates of motor vehicle theft and recovery: measuring spatial influence across neighbourhood context. Urban Studies, 54(13), 2998-3021. https://doi.org/10.1177/0042098016664299 [ Links ]
Quick, M., Li, G. y Brunton-Smith, I. (2018). Crime-general and crime-specific spatial patterns: A multivariate spatial analysis of four crime types at the small-area scale. Journal of Criminal Justice, 58, 22-32. https://doi.org/10.1016/j.jcrimjus.2018.06.003 [ Links ]
Roberts, A. y Block, S. (2013). Explaining temporary and permanent motor vehicle theft rates in the United States a crime-specific approach. Journal of Research in Crime and Delinquency, 50(3), 445-471. https://doi.org/10.1177/0022427812453143 [ Links ]
Sallybanks, J. y Brown, R. (1999). Vehicle crime reduction: Turning the corner. Policing and Reducing Crime Unit: Police Research Series. [ Links ]
Sánchez Salinas, O. A. y Fuentes Flores, C. M. (2016). El robo de vehículos y su relación espacial con el contexto sociodemográfico en tres delegaciones centrales de la Ciudad de México (2010). Investigaciones Geográficas, (89), 107-120. https://doi.org/10.14350/rig.48763 [ Links ]
Secretariado Ejecutivo del Sistema Nacional de Seguridad Pública (SESNSP). (2022). Tamaulipas. Total de delitos [Gráfica]. Observatorio Nacional Ciudadano: Seguridad, Justicia y Legalidad. https://delitosmexico.onc.org.mx/tendencia/tamaulipas [ Links ]
Song, J., Andresen, M. A., Brantingham, P. L. y Spicer, V. (2017). Crime on the edges: Patterns of crime and land use change. Cartography and Geographic Information Science, 44(1), 51-61. https://doi.org/10.1080/15230406.2015.1089188 [ Links ]
Sypion-Dutkowska, N. y Leitner, M. (2017). Land use influencing the spatial distribution of urban crime: A case study of Szczecin, Poland. ISPRS International Journal of Geo-Information, 6(3), 1-23. https://doi.org/10.3390/ijgi6030074 [ Links ]
Tavares, J. P. y Costa, A. C. (2021). Spatial modeling and analysis of the determinants of property crime in Portugal. ISPRS International Journal of Geo-Information, 10(11), 731. https://doi.org/10.3390/ijgi10110731 [ Links ]
Tillyer, M. S. y Walter, R. J. (2019). Busy businesses and busy contexts: the distribution and sources of crime at commercial properties. Journal of Research in Crime and Delinquency, 56(6), 816-850. https://doi.org/10.1177/0022427819848083 [ Links ]
Vilalta, C. J. y Fondevila, G. (2019). Modeling crime in an uptown neighborhood: the case of Santa Fe in Mexico City. Papers in Applied Geography, 5(1-2), 1-12. https://doi.org/10.1080/23754931.2018.1554502 [ Links ]
Wang, L., Lee, G. y Williams, I. (2019). The spatial and social patterning of property and violent crime in Toronto neighbourhoods: A spatial-quantitative approach. ISPRS International Journal of Geo-Information, 8(1), 1-18. https://doi.org/10.3390/ijgi8010051 [ Links ]
Wang, Z. y Zhang, H. (2019). Could crime risk be propagated across crime types? ISPRS International Journal of Geo-Information, 8(5), 1-15. https://doi.org/10.3390/ijgi8050203 [ Links ]
Wortley, R. y Townsley, M. (Eds.). (2017). Environmental criminology and crime analysis. Routledge, Taylor & Francis Group. [ Links ]
Wu, L., Ye, X. y Webb, D. (2012). Space-time analysis of auto burglary patterns in a fast-growing small city. International Journal of Applied Geospatial Research, 3(4), 69-86. https://doi.org/10.4018/jagr.2012100104 [ Links ]
Yang, Z., Hardin, J. W. y Addy, C. L. (2010). Score tests for zero-inflation in overdispersed count data. Communications in Statistics. Theory and Methods, 39(11), 2008-2030. https://doi.org/10.1080/03610920902948228 [ Links ]
Received: October 27, 2022; Accepted: January 18, 2023
 Este es un artículo publicado en acceso abierto bajo una licencia Creative Commons
