


Serviços Personalizados
Journal
Artigo
 texto em
  Inglês (pdf)
 Artigo em XML
 Referências do artigo
 Enviar este artigo por email
Indicadores
-
 Citado por SciELO
 -
 Acessos
Links relacionados
-
 Similares em
SciELO
Similares em
SciELO
Compartilhar

 Permalink
Frontera norte
versão On-line ISSN 2594-0260versão impressa ISSN 0187-7372
Frontera norte vol.35 México Jan./Dez. 2023 Epub 26-Jun-2023
https://doi.org/10.33679/rfn.v1i1.2307
Article
Urban Parks Inventory for Compliance with 2030 Agenda: The Case of Hermosillo, Sonora

1El Colegio de Sonora, México, jtorrero@colson.edu.mx
2El Colegio de Sonora, México, lnavarro@colson.edu.mx
The objective of this article is to analyze and describe the difficulties in compiling an inventory of urban parks carried out in the municipality of Hermosillo, Sonora. A mixed methodology was applied: a list was obtained from the Parks and Gardens Directorate (DPJ) with the parks served by this dependency. Each park was located and georeferenced by integrating a Geographic Information System for spatial analysis; and interviews were applied to key actors. The results show that there is no complete and exhaustive inventory of parks, whatever the conceptualization that is made of these, and that the DPJ list is due more to administrative and management needs. A limiting factor of this study was the lack of access to public information. It concludes by emphasizing that estimates of indicators based on this list should be taken with reservation in future research.
Keywords: urban parks; green areas; inventory; Hermosillo; Mexico
El objetivo de este artículo es analizar y describir las dificultades implicadas en la compilación de un inventario de parques urbanos realizada en el municipio de Hermosillo, Sonora. Se aplicó una metodología mixta: se obtuvo una lista de los parques atendidos por la Dirección de Parques y Jardines (DPJ); se ubicó georreferencialmente cada parque integrando un Sistema de Información Geográfica para su análisis espacial; y se aplicaron entrevistas a actores clave. Los resultados muestran que no existe un inventario completo y exhaustivo de espacios verdes públicos, cualquiera que sea la conceptualización que se haga de éstos y que la lista de la DPJ obedece más a necesidades administrativas y de manejo. Un factor limitante de este estudio fue la falta de acceso a la información pública. Se concluye enfatizando que las estimaciones de los indicadores basados en esta lista deben tomarse con reserva en futuros trabajos.
Palabras clave: parques urbanos; áreas verdes; inventario; Hermosillo; México
INTRODUCTION
Collective urban open spaces accessible to all are generators of prosperous cities and enablers of social justice. However, these spaces have not been valued enough by politicians and government officials (UN-Habitat, 2022). From a spatial perspective, the result of this lack of vision are dispersed, disconnected and loosely cohesive cities. The public space fulfills essential functions: it guarantees routes, articulates pieces, feeds continuity, provides functional and symbolic quality, orders the city and builds it in its political, cultural, social and environmental contents (Trancik, 1986; Borja & Muxi, 2003; López de Lucio, 2007).
For example, a significant milestone that put public spaces to the test was the COVID-19 pandemic. With the closure of workspaces and public and private spaces such as cafes, gyms, clubs, etc., many people saw the streets and urban parks as an opportunity to escape. However, the United Nations Human Settlements Program (ONU-Habitat, 2020) points out that the pandemic demonstrated the insufficient and unequal distribution of public space in many cities, highlighting “the inequalities between those who enjoy rights and those who are not guaranteed a decent life” (Galizzi, 2020, p. 10).
The UN-Habitat program recommends that an average of 45 to 50% of urban land be allocated to streets and Open Public Spaces (OPS); an estimate of this program in 23 cities in Mexico in 2020 found that on average 15.79% (range 11.71-20.06) were OPS (United Nations Human Settlements Program [UN-Habitat], 2021). This is only a geospatial variable, so it would be necessary to determine the quality and connectivity of these spaces.
The importance of an accessible and sufficient public space that contributes to the well-being of people has been an outstanding issue for the U.N. On September 25, 2015, more than 150 global leaders met in New York at the U.N. General Assembly, where they agreed on an ambitious agenda containing 17 goals and 169 targets. To achieve them, they made the commitment to advance simultaneously in the economic, social and environmental dimensions (Galizzi, 2020). Thus, the 2030 Sustainable Development Goals (2030 Agenda) was established. Goal 11, “Sustainable cities and communities”, numeral 11.7 (hereinafter referred to as “target 11.7”) aims to “provide universal access to safe, inclusive and accessible, green and public spaces, in particular for women and children, the elderly and people with disabilities” (United Nations, 2015). The 2030 Agenda was adopted by Mexico and brought to the local public agenda by the states and municipalities (Decree of 2017; González Gómez, 2018). Describing in depth the “localization” process of the 2030 Agenda is beyond the scope of this article.
The operationalization of indicator 11.7.1 attempts to estimate all open public space (Welle, 2016; Cramwinckel, 2019). However, it is noted that this goal is related to the availability of green spaces or urban parks (Corbett & Mellouli, 2017, p. 435). This article focuses on a subset of public space that is embedded in the urban ecosystem, defined as all green or blue spaces within an urban area (Bolund & Hunhammar, 1999). Specifically, parks are studied as green, public spaces and with equipment that allow their use and enjoyment.
This research responds to a specific problem: the importance of having a complete, accurate, exhaustive and geolocated database on a map of parks that could be part of a comprehensive system of urban parks. Data on public spaces (including parks) at the urban scale is key for local governments to report on their progress towards achieving target 11.7 of the 2030 Agenda (UN-Habitat, 2022).
This article is guided by several research questions: 1) Is there a geolocated, complete and exhaustive inventory of urban parks?; 2) what are the characteristics of current information?; and 3) what are the difficulties to be able to have this inventory? To answer these questions, the following specific objectives were set: a) analyze the databases available through a Geographic Information System (GIS); b) describe the limitations and difficulties of access to information; and c) know the administrative and institutional situations that obstruct the creation of an inventory of public parks.
The research problem was studied in the area of Hermosillo, a medium-sized city located in the arid northwest of Mexico, located in the bioregion of The Sonoran Desert (see map 1). Although the case was chosen for convenience, at the time of the investigation it was the most populous city in an arid climate in Mexico, followed by Mexicali, Baja California, and Torreón, Coahuila (Inegi, 2020). As will be seen later, it has an insufficient amount of green spaces and has been the scene of social conflicts derived from the lack of clear official information on the location, delimitation and land use of parks (Gutiérrez, 2008; Hernández, 2020; Proyecto Puente, 2020; Vázquez, 2021; Palazuelos, 2021). It should be noted that the findings of this research can be applied to other entities and cities in the country, given that the legal structure that governs them for the creation of green spaces is very similar (Decree of 2016; NOM-001-SEDATU-2021 de 2022).

Source: Own elaboration with diverse cartography from Inegi (2021), Google Earth (2022) and Google/Maxar Technologies (2021).
Map 1. Location of the City of Hermosillo, Urban Extension and Expansion
CASE STUDY
The limit of the population center of the city of Hermosillo has an area of 19 553 hectares (map 1, polygon 2021) and in 2020 it had a population of 855 563 inhabitants (Inegi, 2020). It is located at 29° 04’ 30.24” north latitude and 110° 57’ 32.17” west longitude, in the state of Sonora, northwest of Mexico.
The urban ecosystem has been studied by many authors from different disciplines and thematic interests (Del Castillo-Alarcón, 1992; Clemente Marroquín, 2007; Lara-Valencia & García-Pérez, 2013; Enciso Miranda, 2016; García Pérez & Lara Valencia, 2016; Navarro Navarro & Moreno-Vázquez, 2016; Martínez-Salido, 2017; Mercado Maldonado & Marincic Lovriha, 2017; Barrera Alarcón, 2018; Bernal Grijalva et al., 2019; Ortega-Rosas et al., 2020; Navarro-Estupiñan et al., 2020; López González et al., 2021).
The city of Hermosillo, since its foundation in 1700, has grown to the south and northeast (map 1). Given the physical and land use restrictions that exist to the east, construction has been prevented in said area: a) the Abelardo L. Rodríguez dam basin; b) the industrial park; c) orographic barriers such as the El Bachoco and Santa Martha hills, among others, considered areas subject to conservation; and d) exclusion zones, such as the former hazardous waste confinement center, Cytrar3. According to specialists, the city has experienced widespread growth in leaps and bounds (Puebla Corella, 2020; López Ordóñez, 2020), which has left vast areas of vacant land within the surrounding polygon of the urbanized area (H. Ayuntamiento de Hermosillo, 2016; Banco de Desarrollo de América del Norte [BDAN], 2018).
The city shows a deficit of green spaces. The indicator used is the area of green spaces in square meters per capita at various urban scales (m2/inhabitant). Estimates vary. For example, Lara-Valencia and García-Pérez (2013) estimated 2.3 m2/inhabitant in 2013, excluding parks with a surface area of less than 1 120 m2 and including Parque La Sauceda (40 hectares) currently closed and abandoned; meanwhile, Mercado Maldonado and Marincic Lovriha (2017) estimated 5.14 m2 per inhabitant in 2015. The Urban Development Program of the Population Center of Hermosillo (Programa de Desarrollo Urbano del Centro de Población de Hermosillo, PDUCPH) in 2014 estimated 6.19 m2/inhabitant (Instituto Municipal de Planeación Urbana y del Espacio Público [Implan] Hermosillo, 2014). Bernal Grijalva et al. (2019) calculated for the year 2016, 3.08 m2/inhabitant, only counting urban parks without including boulevards and other ornamental vegetation on roads. In 2017, a study carried out by the Inter-American Development Bank, Harvard University and the Municipal Institute for Urban Planning and Public Space estimated 2.14 m2/inhabitant of qualified green space (BID, Universidad de Harvard e Implan, 2017). This study revealed that only 40.6% of the population is less than a 10-minute walk from a qualified green space. In accordance with the projected trend for 2050, the ratio of green spaces per inhabitant will decrease from2.14 to 1.58 m2. The civil society organization “Hermosillo ¿Cómo vamos?” (HCV, 2021) estimated for the year 2020, 4.5 m2 per inhabitant. The Municipal Development Plan of Hermosillo 2022-2024 (H. Ayuntamiento de Hermosillo, 2022), mentions that the city has 1 081.98 hectares, which include intra-urban conservation zones (628.16 hectares), public green spaces (168.05 hectares) and private ones (78.44 hectares), municipal protected natural areas (22.77 hectares), ridges (green corridors) (84.43 hectares) and urban parks (not including La Sauceda), which yields 12.45 m2 per inhabitant.
This indicator is compared with the threshold referred to by the World Health Organization (WHO) which is 9 m2 of green space per inhabitant. Without a doubt, this is the most used reference mark around the world. A Google search limited to 1970-1980 reveals that reference to this indicator was already made at the end of that decade, so it has been used for at least more than 40 years. However, some authors point out that it lacks technical and bibliographic support (Bernal Grijalva et al., 2019). Some set this threshold at 10, 12 or 16 m2, and, for example, the City Prosperity Index , (ONU-Habitat, 2018) recommends 15 m2. In recent reforms made to the Law of Ecological Balance and Environmental Protection of the State of Sonora (Decree 144 of 2020) it is established that “the Municipalities in coordination with the State, will guarantee the existence of a proportion of ten to fifteen square meters of green space for each inhabitant” (Article 11, section XIX).
As evidenced by the case study, there is great variation in the estimate of green space per capita. This lack of precision happens because the area is calculated from different databases; this inconsistency is repeated in the cases of Ecuador (Juca & Carmona, 2016), Poland (Feltynowski et al., 2018) and Mexico. Peña Salmón (2011, p. 14) points out for the city of Mexicali that “there is no reliable and systematized inventory of green spaces by the city council”,4 which supports how widespread the study problem is. These reflections justify the importance of having an official spatial database that contributes to monitoring progress in meeting target 11.7 of the 2030 Agenda.
CONCEPTUAL THEORETICAL FRAMEWORK
Knowing the geographic location of the parks, their dimensions and their free transit is important to understand the urban coverage of ecosystem services. In the previous section, the official statistics on an urban scale for the case study were reviewed, which provide an idea of the provision and access of people to green spaces. However, it was shown that there is no accurate and reliable spatial data to know the coverage network.
Urban Public Space
Every day society travels through different spaces that make up the city and others that serve for our transition: free transit sites, restricted access ones; public spaces, private ones; covered, semi covered, outdoor sites; walkways, vehicular roads, gardens and buildings.
Given this diversity of spaces and temporalities, public space is very difficult to quantify. Delimiting it geometrically in the urban plan is quite a methodological challenge (Ji & Ding, 2021). As emphasized by Barchetta and Chiodelli (2015), there is a multiplicity of institutional arrangements behind public spaces: combinations of property regimes, forms of management, maintenance, and behavioral norms that create de jure and de facto access restrictions (intentional or not).
The following is an example of a detailed work of delineation of the public space:
in 1736, Pope Clement XII commissioned Giambattista Nolli, an Italian architect and surveyor, to draw an accurate map of Rome. For public buildings related to religion, culture, and city administration, such as churches and theaters, the interior space was left blank, and the columns and walls were painted in detail. In addition to the public buildings, the map also illustrates the public parts of the private buildings, such as the atrium and the public corridors that connect the entrance to the inner courtyard. In other words, the white areas on the map represent the areas of the city that are actually accessible and reflect the areas of public life and resident activity. The private space represents places that people cannot enter and is filled in with dark gray shading (Ji & Ding, 2021, p. 542).
Indicator 11.7.1 of the 2030 Agenda tries, with modern tools, to replicate what Giambattista Nolli did in detail in 1736 for the city of Rome. This indicator imposes significant challenges by requiring spatial data and technical capacities for its analysis. The indicator has two dimensions: a) the geophysical, which consists in obtaining the public space of the urban fabric; and b) the social, which determines the use and access of people by gender, age and disability. Regarding the difficulty in estimating the indicator, Cramwinckel (2019) argues that, even though it is conceptually clear and has a standard international methodology, data has not yet been collected.
To have an overview of what is happening in Mexico, UN-Habitat recommends that only 30-35% of the total OPS be for streets and sidewalks. In 2020, the UN-Habitat methodology was applied in 23 cities in Mexico, not including Hermosillo. The averages obtained were below the recommended ranges: streets and sidewalks 13.28%, OPS 2.51% (UN-Habitat, 2021). By adopting indicator 11.7.1, urban parks would be included in the OPS percentage, which represents an extremely low value.
Urban Parks
There is a wide range of definitions of green spaces, both among academics and in legal texts and official documents (Canosa et al., 2003; Hartig et al., 2014:211; Barchetta & Chiodelli, 2015; Téllez Montes et al., 2020; NOM-001-SEDATU-2021 de 2022). Tellez-Montes et al. (2020) point out inconsistencies in the determination and categorization of green spaces in Mexico City. The authors suggest that it is necessary to start from clear concepts in order to create and apply consistent, clear and functional public policies to protect and promote these spaces.
There is also much confusion between concepts such as ecosystem, vegetation cover on a city, neighborhood and block scale, tree cover or urban forest. This confusion makes the construction of indicators even more difficult (López González et al., 2021).
In this work we use the term “urban park” to designate elements that are a subset of public space, with free access, connected (or overlapping) at a walkable distance from the urban sprawl, with different proportions of vegetation cover (tree, shrub or herbaceous), deliberately designed and built with equipment to carry out outdoor activities, leisure, recreation, rest, social interaction, enjoyment of environmental amenities, sports, among others.
Recent reforms to the Land Planning and Urban Development Law of the State of Sonora [Ley de Ordenamiento Territorial y Desarrollo Urbano del Estado de Sonora] (Decree 144 of 2020) embody this idea, defining green public space as a plaza or green corridor with public access, also establishing that: “the ridges, sidewalks and roundabouts devoid of social infrastructure (benches, walkways, playsets) must be excluded” from this category, “as well as those areas not accessible to the entire population” (p. 5).
In this definition we place an anthropocentric and salutogenic emphasis, understanding the urban park as a promoter and an asset for the well-being and health of people. The WHO produced a report summarizing the benefits that green spaces offer to cities. In general, they improve mental health, reduce both morbidity and mortality from cardiovascular diseases, and contribute to reducing the rates of obesity and type 2 diabetes. They also help to have better pregnancies. All these benefits are mediated by psychological relaxation and stress relief. Citizens can increase their physical activity and be less exposed to air pollutants, noise and excess heat (WHO, 2016).
Figure 1 shows how these three categories often create confusion: green spaces, urban parks and indicator 11.7.1 of the 2030 Agenda. First, as already mentioned, this indicator seeks to measure the entire public space. Second, in the urban sprawl there are areas of cultivated or spontaneous vegetation (undergrowth or remnants of native vegetation) that provide greenery, however, only part of this vegetation is found in public spaces. Additionally, in arid areas such as Hermosillo there are parks that have very little or no vegetation, projecting a brown or grayish view (Clemente Marroquín, 2007; Bernal Grijalva et al., 2019). Third, there are also non-public parks, such as those located inside condominiums with exclusive access for their residents. Finally, in figure 1 the intersection of the three circles suggests that ideally an urban park should be public, have a legal use defined as a park and have adequate green cover.
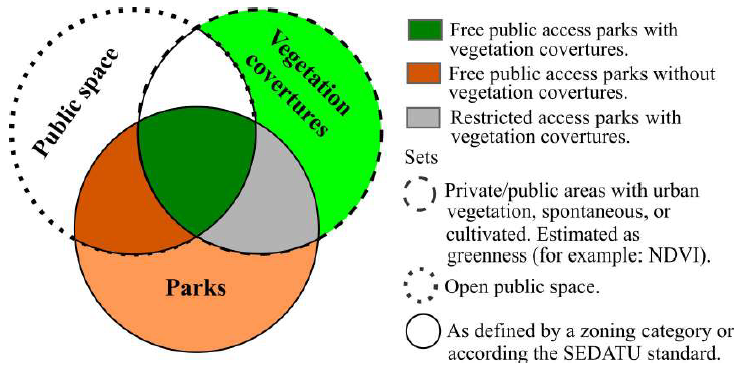
Source: Own elaboration based on the reviewed literature (Barchetta & Chiodelli, 2015; López González et al., 2021; NOM-001-SEDATU-2021 of 2022).
Figure 1. Venn diagram with the interaction of park, public space and green areaNote: NDVI: Normalized Difference Vegetation Index; SEDATU: Secretaría de Desarrollo Agrario, Territorial y Urbano, México (The Mexican Secretariat for Agrarian, Land and Urban Development).
Integral System of Urban Parks
On an urban scale, parks should not be managed in isolation. It is suggested that a comprehensive system of urban parks should be built (Harnik, 2006; Peña Salmón, 2011; Ellis & Schwartz, 2016; NOM-001-SEDATU-2021 de 2022). The set of spaces considered as parks within an urban municipality is defined as a system of urban parks; basically, this system ensures the fair distribution of the recreational, cultural, and environmental amenities provided by these spaces (Ellis & Schwartz, 2016).
Corbett and Mellouli (2017) studied the importance of information systems to support the monitoring and achievement of the goals and targets of the 2030 Agenda. They highlighted that governments generate information systems oriented to daily administrative functions. However, they suggest that a good information system should be useful in three spheres: a) the political, related to the discourse and public agenda of elected politicians; b) the administrative, already mentioned; and c) that of sustainability, where the information is used to estimate the indicators of the 2030 Agenda with technical, academic and scientific support.
Harnik (2006) highlights that, despite the importance of dimensioning and comprehensively knowing the parks located in a city, few cities have carried out this task. The author recommends seeking seven aspects to have a park system of excellence: a) establish and follow a clear mission and vision since the system does not emerge from nothing; b) prepare a master plan with citizen participation and keep it updated; c) allocate sufficient budget; d) distribute the parks homogeneously in the urban sprawl; e) monitor the satisfaction of park users; f) that they are safe spaces, free of crime and violence; and g) that they generate environmental, economic and social benefits.
Peña Salmón (2011) developed a methodological proposal for the planning of urban green spaces for the city of Mexicali, Baja California. Peña subdivided the process into a) organization: definition of objectives and integration of the team; b) inventory: not only of parks, but of resources available to work with the methodology; c) integration of a diagnosis; d) strategy: programs and goals; and e) management: annual action plans. He also recommends and proposes creating an inventory of existing and potential green spaces based on typologies and preparing a fact sheet for each park.
A comprehensive system of urban parks plays a fundamental role from the perspective of environmental equity. In Mexico, the Political Constitution establishes that “everyone has the right to an adequate environment for their development and well-being” (Decree of 1999, Art. 4 o, para. 3). The socio-spatial inequalities associated with the distribution of urban parks have been analyzed in several cities around the world, for example: Hermosillo (Lara-Valencia & García-Pérez, 2013; García Pérez & Lara-Valencia, 2016), Mexico City (Fernández-Álvarez, 2017), various cities in the United States (Boone et al., 2019; Nesbitt et al., 2019; Williams et al., 2020), and Quito (Cuvi & Gómez-Vélez, 2021). Said studies consistently find an unfair distribution of environmental amenities.
Finally, the recently published NOM-001-SEDATU-2021 of 2022 advises that public spaces must be seen as an interconnected system or set and not be destinations in themselves.
METHODOLOGY
In order to explore the spatial (quantitative) and institutional dimension of the phenomenon studied, it was decided to use a mixed methodology that allows not only to contemplate the geographical perspective but also to know the administrative processes behind the study problem. To address the quantitative approach, as a first step, the Parks and Gardens Directorate (Dirección de Parques y Jardines, DPJ) of the Coordination of Infrastructure, Urban Development and Ecology (Coordinación de Infraestructura, Desarrollo Urbano y Ecología, CIDUE) of Hermosillo was approached. The objective of this dependency is “to provide conservation and maintenance services for green spaces that are the responsibility of the Hermosillo City Council, as well as to develop afforestation programs, in order to have a pleasant image and environment for the coexistence of residents and visitors to the municipality”, and also “carry out the inventory of green spaces of the municipality of Hermosillo” (Municipio de Hermosillo, 2017, p. 56). Through a simple request, on February 26, 2021, the DPJ provided a spreadsheet, updated to the year 2020, that contained a list of squares and boulevards categorized into rural and urban for each sector of the city (north, center, south, west and east). The list included surfaces in square meters and a reference address for the squares.5
The study area corresponded to the current urban sprawl of the city of Hermosillo, which was built manually with the support of the urban Basic Geostatistical Area (Área Geoestadística Básica, AGEB) of Inegi (2021) and a recent image of the city taken on January 29, 2022 (PlanetScope, 2022).
Considering that the information from the DPJ was not laid out on a map, each park on the list was located using the address (street intersection) and Google Maps. In a second stage, the photo-interpretation technique on satellite images from the Google Earth platform (2022) was used. Using the same software, this process was complemented with the street view option and with field visits when needed.
Photo-interpretation consists of translating the features and characteristics of very fine resolution satellite images, based on visual (retinal) variables such as shape, shadows, color, tone, texture, pattern, orientation, size, association, and other a priori information, which would allow a geographic object (polygon, point or line) to be categorized within a pre-established class (Loelkes Jr. et al., 1983; Bernal Grijalva et al., 2019).
Through photo-interpretation, the perimeter of each element on the DPJ list was delineated, drawing the polygon of each park. During the process, elements such as texture, color, patterns, associations, etc., typical of equipment and plant cover in parks, were identified. The existence of these was verified with a confusion matrix, using street view or field visits.
The qualitative part of the study was used to learn about the administrative procedures of the DPJ, for example: how it adds or removes parks from its database, the problems it faces in keeping its exhaustive records, and why they are in charge of other areas.
First, a list of key actors was prepared, made up of officials and former officials of the DPJ, Implan, developers, consultants, environmentalists, and managers of neighborhood associations. Ten actors were contacted and interviewed individually. The interviews were anonymous, some were recorded and transcribed. Actors were contacted and interviewed through a theoretical selection, derived from the iterative triangulation of information; a unique questionnaire was generated for each actor.
DATA ANALYSIS AND DISCUSSION OF RESULTS
The DPJ List
The DPJ did not have a map to locate and measure the areas under its responsibility (research question 1). Instead, they shared a list that had 1 020 rows, corresponding to 146 boulevards, 75 in rural areas and 799 squares. Rural areas and green spaces on boulevards were not included in this study, so the universe to be located and photo-interpreted was left at 799.
The DPJ does not publish or maintain a chronologically ordered registry or database that allows to know the evolution of the parks, boulevards and other areas under its responsibility. However, it was possible to have access to their 2016 and 2018 databases, which allowed a line-by-line comparison for the squares to be made and to know their changes in the last five years (see Table 1).
Table 1. Evolution of urban parks (squares) in charge of the DPJ (2016-2020)
| Sectors | 2016 | 2018 | 2020 | Change 2016-2020 |
|---|---|---|---|---|
| East (sites) | 118 | 119 | 127 | 9 |
| Surface (m2) | 587 443 | 593 943 | 609 983 | 22 540 m2 |
| West (sites) | 202 | 211 | 265 | 63 |
| Surface (m2) | 1 186 012 | 1 219 208 | 1 323 515 | 137 503 m2 |
| Center (sites) | 128 | 133 | 137 | 9 |
| Surface (m2) | 415 456 | 419 269 | 433 653 | 18,197 m2 |
| South (sites) | 221 | 234 | 270 | 49 |
| Surface(m2) | 541 798 | 562 387 | 608 487 | 66 689 m2 |
| Total (sites) | 669 | 687 | 799 | 130 |
| Total (área) | 2 730 709 | 2 794 807 | 2 975 638 | 244 929 m2 |
Source: Own elaboration with data from the DPJ (2020).
In an interview, a DPJ official pointed out that the list is dynamic and is constantly being updated. This list is divided into sectors and for each one there is a manager who mobilizes the maintenance crews. In addition, they are the ones who contribute to feeding the list based on their field work, determine the location and make the measurements of the place. The interviewed official also specified that by February 2022, 75 rural areas (391 264 m2), 152 boulevards (1 289 021 m2) and 814 parks (3 807 812 m2) were tended to. With this information, it can be deduced that from January 2016 to February 2022, the DPJ oversaw 145 more urban parks.
For the DPJ list (2020), a digital survey was carried out using the photo-interpretation of Google Earth images (2022). The resolution of the available images made it possible to distinguish various elements of the typical equipment of an urban park, such as shade structures, kiosks, sheds, roofs, basketball courts, walkways, sidewalks, children’s playsets and sports equipment, tree canopy, shrubs, synthetic grass, bare ground etc. This technique was very precise. To verify this, a random sample of one hundred spaces was taken for either a field visit or viewed on “street view”, and there was a 100% coincidence between the photo-interpretation and the elements seen in reality.
Out of 799 parks (2 975 638 m2), it was possible to locate and draw individual polygons for 700 sites totaling an area of 1 724 656 m2 (see map 2), that is, in round numbers, only 58% of the inventoried area for the concept “square” or urban park. Table 2 details the findings of the photo-interpretation process of the DPJ 2020 list.

Source: Own elaboration based on the DPJ (2020) list, Google Earth (2022) and PlanetScope (2022).
Map 2. Centroids of the 700 polygons located (photo-interpreted) from the DPJ list (2020)
Table 2. Results of the photo-interpretation process of the list of parks in charge of the DPJ (2020)
| Description | Sites | Area (m2) |
|---|---|---|
| A) Photo-interpreted (found) | 700 | 1 724 656 |
| B) Not located (without full address) | 54 | 402 305 |
| C) Found, but not included: | 45 | 848 677 |
| C.1. Duplicate sites | 15 | 17 229 |
| C.2. Landscaped area on the road | 8 | 6 918 |
| C.3. Properties with constructions (other uses) | 17 | 119 530 |
| C.4. Burial site | 4 | 695 000 |
| C.5. Protected natural area (rustic property in a hilly area) | 1 | 10 000 |
| Totals B and C (excluded): | 99 | 1 250 982 |
| Grand total | 799 | 2 975 638 |
Source: Own elaboration based on data from the DPJ and images from Google Earth (2022).
The photo-interpretation presents some difficulties: 1) it’s a very time-consuming technique; 2) it’s manual and although it produces accurate results, it depends on the skills of the photo-interpreter; 3) regarding the Google Earth platform (2022), it made up a mosaic of images from different dates, from November 2015 to June 2019; and 4) skills and abilities are required for the use of GIS software.
The diversity of surfaces that theoretically could be used in the numerator of the WHO m2/inhabitant indicator or, where appropriate, to analyze the spatial distribution of parks stands out. Saldaña Vázquez and Ramírez Miranda (2021), referring to Sánchez Juárez (2021), observed that he had included in his calculation spaces that are not easily accessible and not used for recreation, such as ridges, cemeteries or private green spaces. However, other authors included ridges and it would seem that they only include surface areas (of parks) with vegetation cover (Pérez-Medina & López-Falfán, 2015).
García Pérez and Lara Valencia (2016, p. 35), interpreting state law6 as an “urbanized area”, estimated that the city of Hermosillo should have at least 6.9 m2 of green space per inhabitant. However, the interpretation is wrong, the law uses the salable area as a basis for the creation of green spaces. Recalculating would yield an area of less than 6.9 m2. This demonstrates the variety of forms of interpretation and operationalization of green spaces.
In the DPJ list (2020) there are many parks without a location and cemeteries considered as parks. Quinton and Duinker (2019) state that cemeteries are generally omitted as green spaces, even though they could have as much vegetation as a park and therefore generate environmental services. It is assumed that cemeteries must have considerable vegetation, which is not always the case, especially in Hermosillo.7 In addition, Quinton and Duinker (2019) allude that due to the influence of the media and popular culture, these spaces are considered gloomy and grim. In the social imagination they are associated with supernatural phenomena, horror stories and movies.
Far from the conceptual debate of whether or not to include cemeteries as “green spaces”, the reason for their inclusion is more a reason of administrative inertia or tradition. In the interview with a former director of the DPJ, he pointed out that “the cemeteries of Hermosillo have traditionally depended on the DPJ for their maintenance, especially, prior to the commemorative days they are cleaned, since these places do not have personnel to perform these tasks” (official 4, personal communication, January 28, 2022).
Regarding the unlocated spaces that totaled 402 305 m2 (item B, table 2), a DPJ official noted that:
The Los Arroyos sports complex (30 hectares) began to be tended to, there was a sports league there, trees were planted, it was cleaned from time to time, but the league then changed locations, the land was private property (...) they were added [the places and area] so that it would reflect the work carried out by the DPJ (official 3, personal communication, February 9, 2022).
He was also asked about the “Akiwiki #2” case with 6 000 m2, noting that “3 000 m2 were removed that turned out to be private property.” The interviewee mentioned that “other places did not exist or were duplicated” (official 3, personal communication, February 9, 2022).
Another official explained the existence of private property within the DPJ inventory:
there are people who have land in the urban sprawl that is used as sports areas, “I have a large piece of land, I lend it to the municipality to use it as a sports area, so I have two benefits, that they don’t invade it, why? How are they going to invade a soccer field? and I pay half of the property tax”. But an agreement has to be made through the Municipal Sports Institute and the Treasury (Instituto del Deporte Municipal y la Tesorería) (official 5, personal communication, November 5, 2021).
Derived from the interviews given by three officials, the list of areas served by the DPJ increased: 1) due to political commitments, for example, the city council is asked for help to clean a park or sports area; 2) by administrative tradition, that is, if the municipality does not do it, who does?; 3) due to the need to report work based on maintenance and cleaning in square meters; and 4) by the delivery-reception from the developer to CIDUE, and the latter to the DPJ.
Likewise, areas are removed from the list for various reasons: 1) as cleanup and to detect registry errors; 2) green and sports areas that cease to function as such are taken into account; 3) recognition of areas that happen to be private property or intended for another use; and 4) the political commitment or agreement/request for help ends, generally made by the users of the park/sports area to the mayor in office.
Available Databases
This section answers the second research question and refers to the characteristics of the databases available to integrate a GIS of urban parks.
The first difficulty an academic faces when generating a complete and exhaustive inventory of urban parks is the lack of information. For this research it was not possible to obtain the raw data related to this topic in an editable format. It was found that between groups of experts, interested parties and/or consultants, data is shared in an editable format, although many times without “metadata” detailing its quality, update date, definition of attributes, etc. These support networks believe that this information should be officially available.
Table 3 summarizes the databases and digital cartographies consulted. None of the databases could be considered a complete and comprehensive inventory of green spaces or urban parks in Hermosillo (research question 1). It can also be observed that there is a temporal discontinuity between the sources of information, that is, there is no way to have serial observations that are like a “snapshot” taken at regular intervals that allow knowing the evolution of the variables over time.
Table 3. Availability and openness of the cartography and databases consulted
| Topic | Department | Format | Year | A | B | C | D | E | F | G | H | I | J |
|---|---|---|---|---|---|---|---|---|---|---|---|---|---|
| E6 Plan of land use,
reserves and destinations |
Implan | 2014 | 1 | 1 | 0 | 0 | 1 | 0 | 0 | - | - | - | |
| E6 Plan of land use,
reserves and destinations (partial) |
Implan | SHP | 2014 | - | 0 | 1 | 0 | 0 | 0 | 1 | - | - | 1 |
| E6 Plan of land use,
reserves and destinations |
Implan | KMZ | 2014 | - | 0 | 0 | 0 | 0 | 1 | 0 | - | - | 1 |
| DPJ list | DPJ | Excel | 2021 | 1 | 0 | 1 | 0 | 0 | 0 | 0 | 1 | 0 | - |
| Hermosillo Cadastre (partial) | ICRESON | SHP | 2019 | 0 | 0 | 1 | 0 | 0 | 0 | 1 | - | - | 1 |
| Parks (geostatistical framework) |
Inegi | SHP | 2021 | 1 | 1 | 1 | 1 | 1 | 0 | 1 | - | - | - |
| Municipal sports areas | IDJH | Excel | 2021 | 1 | 1 | 1 | 0 | 0 | 0 | 0 | 0 | 1 | - |
| Land use and cadastre | SIGEM | Web | 2021 | 1 | 1 | 0 | 0 | 0 | 0 | 0 | - | - | - |
| Google Maps | Web | 2021 | 1 | 1 | 0 | 0 | 0 | 1 | 0 | - | - | - | |
| Google Earth | Web | 2019 | 1 | 1 | 1 | 1 | 0 | 1 | 1 | - | - | - |
Source: Own elaboration
Note: A: Free; B: Available (downloadable) online; C: Raw data (editable format); D: Time series available; E: Metadata; F: Digital raster graphic; G: Digital vector map; H: Available by verbal request; I: Available with formal request; J: Obtained/shared through consulting networks and/or experts. 1 = yes; 0 = no; - = does not apply.
An interviewed former Implan official stated: “we have perfectly geolocated all the green spaces of the city” (official 6, personal communication, October 21, 2021). A copy of these georeferences in digital format was requested from the Implan reception window for review, which was denied.
For the general public there is the 2014 version (Implan Hermosillo, 2014) of the E6 plan, in its printed edition or in PDF. The public information was georeferenced and vectorized, however, the adjustment had discrepancies and the available format presented analytical limitations. A more current version of the E6 plan is the SIGEM interactive map, but it can only be consulted in real time through the internet (H. Ayuntamiento de Hermosillo, 2022).
A former Implan official, as well as an active member of its advisory council, announced that the new Urban Development Plan of the Population Center of Hermosillo 2020-2050 (Plan de Desarrollo Urbano del Centro de Población de Hermosillo 2020-2050), will have a more detailed description of urban green spaces, which they call “system of urban green spaces”. However, this document is not yet available to the public (official 6, personal communication, October 21, 2021).
Geospatial Analysis
To find out if the 700 photo-interpreted parks on the DPJ list (2020) could be considered a complete and exhaustive inventory, various geospatial analyses were carried out to overlay them with other geographic databases.
1) It was identified that 185 parks had an area of less than 500 m2. The PDUCPH Modification 2014 (Implan Hermosillo, 2014) stipulated that green spaces should not have a surface area of less than 500 m2; nor can ridges, ravines, streams, hills and decorative surfaces of residential communities be added. Only 35 parks had a surface area greater than one hectare (range 1.5-9.1 hectares). The vast majority were narrow polygons; 232 with an average width of less than 20 meters (see graph 2).

Source: Own elaboration based on the list of the DPJ (2020) and Google Earth (2022).
Graph 2. Histograms with the average width and the area of the photo-interpreted polygons
2) Six hundred three parks with street views were located. The fact that not all the parks were located with Google Maps is not just a technical issue of the company; if the vehicle did not take a street view, most of the time it is due to some access restriction, as in the case of gated communities. Thirty of these sites were randomly inspected and in all cases the presence of security booths, fences and/or boom barriers for access control was verified. Strictly speaking, parks located within gated communities are not accessible to the public. In the opinion of a former official of the defunct Maintenance and Forestry Department of Hermosillo (Dirección de Mantenimiento y Forestación de Hermosillo), “there are gated communities of a certain [economic] level where they have to do it [maintenance] with their own resources” (official 4, personal communication, January 28, 2022); but as it was detected in this study, some of the parks are donations, owned by the municipality, which remain within gated communities.8
3) The geographic service coverage of the DPJ can be corroborated by superimposing the centroids of the photo-interpreted parks on the polygons of the Hermosillo neighborhoods as of 2019. The result was that 474 neighborhoods (9 900 hectares), out of a total of 776, did not have a park tended by the DPJ.9
4) Comparing the photo-interpreted parks with the Implan cartography (Plan E6), only 502 parks had “green and/or sports area” (AVD) as land use. Plan E6 contained a total of 2 285 polygons (886.345 hectares). Around 466.427 hectares were located on subdivided rural land, still without construction at the date of this investigation. Also noteworthy are the Los Lagos golf club (71.760 hectares), closed sports areas (166.401 hectares), abandoned parks such as La Sauceda (40 hectares) and some vacant land. Also, 1 047 polygons (20.023 hectares) have an area of less than 500 m2, where flowerbeds, triangles, roundabouts, etc. can be seen, probably ornamental surfaces of residential communities. This analysis questions the precision and exhaustiveness of the E6 plan of the Implan, as a possible inventory of urban parks.
Finally, the geographic overlap of the parks with digital cadastre cartography for the year 2019 was analyzed. There was an overlap of 654 parks from different owners; 544 belong to the municipality, 31 to the state entity, four are federal and the rest have different owners.10
This analysis answered the first research question: there is no geolocated, complete and exhaustive inventory of urban parks. Given the disparity between the available databases, it was considered that none met the characteristics imposed in the research question. Much less was there an integral system of urban parks found, that is, some free software or urban planning tool that allows visualizing parks on an urban scale.
Statistical Capacity of the DPJ
As the Corbett and Mellouli (2017) model suggests, beyond the operational and administrative sphere where the DPJ seems to be currently located, it had to be suggested that its registry of parks and other green spaces should also include the “political” and “sustainability” dimensions, meaning, not limiting itself to the area under its responsibility, but serving the production of indicator 11.7 at the local level of the 2030 Agenda.
Officials and ex-officials of the DPJ agree that in the last 20-30 years this unit has diminished in terms of financial and human resources. A former official recalled that in the 1997-2000 triennium, when it was called “maintenance and forestry”, there were much more personnel (official 4, personal communication, January 28, 2022). Said unit then had more than 300 staff members and they were very well equipped. However, today they are half the number they were in the year 2000 and their equipment is limited. The latter, in his opinion, demonstrates the little importance that green spaces have represented for past municipal administrations.
“They would not have the capacity to take care of all the green spaces” mentioned another former official interviewed who also held a position at the management level. For this reason, “civil society was called, organized groups, around 50-60 groups. They liked to organize activities in favor of the environment, such as afforestation and cleaning of green spaces”, the idea was that they would adopt a park (official 9, personal communication, January 15, 2022). In this regard, an official on duty corroborated that “only 28-33% of the total areas are tended to per month, which means it takes three months to go around all the places” (official 3, personal communication, 9 February 2022).
On the other hand, some interviewed actors who worked in the DPJ for more than 10 to 15 years, recalled having compiled detailed inventories of squares, boulevards, and sites served by this department, however, their effort was not followed through with the change of administration. Regarding the DPJ list of parks, an interviewee stated: “I remember that the DPJ had an average of 670, but once we began to see parks where certain people spoke to us, we calculated around 240 or 260 additional parks that are not included in the DPJ list” (official 9, personal communication, January 15, 2022).
An official on duty commented that they had just purchased commercial software to work with the GIS, that they were in the process of locating all the spaces, but they had few staff, so they wished the state universities would help them. Although they would be limited only to the areas under their responsibility.
Undoubtedly, the agency that possesses the technical capabilities and skills to create a complete and exhaustive inventory of existing urban parks would be the Implan. However, the information they handle is not public (in editable format) and the E6 plan as such, would need to be recategorized, verified and specified to serve as a source of information and generate sustainability indicators. Such capabilities would undoubtedly be complemented by DPJ’s field experience.
The qualitative analysis of the interviews with the key actors who have worked on the subject helped to answer the third research question: the existing difficulties in having an official inventory of urban parks. As suggested by Feltynowski et al. (2018, p. 1), “officials often focus on a fraction of urban green spaces. They refer only to those for whom they are formally responsible”.
CONCLUSIONS AND RECOMMENDATIONS
The DPJ list (2020) is far from being a complete and exhaustive inventory of “green spaces”, whatever their conceptualization. The DPJ maintains a list that meets its administrative and management needs. Future research work, as well as the estimation of indicators based on this list, should be taken with reservation.
As of the date of this investigation, there was no inventory of green spaces in the city of Hermosillo with delimited polygons that reported the area and perimeter of each space categorized according to its use, access, ownership, person responsible for its maintenance, among other important variables. This is a pending task, even though officials use indicators and diagnoses derived from their databases created ad hoc in their dependencies in their public policy speeches.
No evidence was found that there was an estimate for indicator 11.7.1 of the 2030 Agenda for the city of Hermosillo. However, as documented in this study, many disparities exist when estimating square meters of green space per capita. This is because there is no reliable, continuous and verifiable database that allows for an accurate calculation of green spaces. The main difficulties that an analyst faces when faced with the task of generating an inventory are: 1) the data is generally imprecise, diffuse or inaccessible; 2) the scarce official cartography, without metadata and with temporal discontinuity; and 3) current information requires time-consuming manual technical labor to process.
It is recommended that officials and academics work on the conceptualization of quantifiable categories of green spaces. In this work we promote socially functional green spaces, although we recognize that all green spaces have the potential to produce environmental services. Additionally, support should be sought from the agency(ies) with technical and statistical capacity (the DPJ, the Implan, the Instituto Municipal de Ecología or other) to operationalize and develop this inventory from a holistic perspective that provides inputs to calculate indicators for the target 11.7 of the 2030 Agenda at the local level, as suggested by Corbett and Mellouli (2017).
Lastly, open data has the potential to encourage civil society: academics, environmental groups, neighborhood associations, among others. Open data makes it easier to carry out research, create free digital platforms that contribute to informing about public domain spaces destined for urban parks. Such knowledge strengthens the link and belonging of people to these places and provides certainty to their collective activities of afforestation, cleaning and maintenance. It became evident in this case study that the municipal government does not have sufficient resources to service all urban parks.
REFERENCES
Banco de Desarrollo de América del Norte (BDAN). (2018) Hermosillo a escala humana: Ciudad diversificada, innovadora y sostenible. BDAN. https://www.nadb.org/es/conocimientos-y-recursos/publicaciones-y-estudios/hermosillo-a-escala-humana-ciudad-diversificada-innovadora-y-sostenible-bid-bdan-2018 [ Links ]
Banco Interamericano de Desarrollo (BID), Universidad de Harvard e Instituto Municipal de Planeación Urbana y del Espacio Público (Implan) (2017). Repensando Hermosillo. Ciudades emergentes sostenibles https://www.implanhermosillo.gob.mx/wp-content/uploads/2018/08/Rethinking-Hermosillo-2017_09_27-Spanish-1.pdf [ Links ]
Barchetta, L. y Chiodelli, F. (2015). The variety of urban green spaces and their diverse accessibility. Gran Sasso Science Institute. [ Links ]
Barrera Alarcón, I. G. (2018). Metodología de evaluación de la sostenibilidad urbana a partir del análisis de las características climáticas y del medio físico construido [Tesis doctoral, Universitat Politècnica de Catalunya]. http://hdl.handle.net/2117/118004 [ Links ]
Bernal Grijalva, M. M., Navarro Navarro, L. A. y Moreno Vázquez, J. L. (2019). Adopción de especies nativas en la gestión de espacios verdes públicos sostenibles: El caso de Hermosillo. Frontera Norte, 31(1), 1-27. https://doi.org/10.33679/rfn.v1i1.2049 [ Links ]
Bolund, P. y Hunhammar, S. (1999). Ecosystem services in urban areas. Ecological Economics, 29(2), 293-301. https://doi.org/10.1016/S0921-8009(99)00013-0 [ Links ]
Boone, C. G., Buckley, G. L., Grove, J. M. y Sister, C. (2019). Parks and people: An environmental justice inquiry in Baltimore, Maryland. Annals of the Association of American Geographers, 99(4), 767-787. https://www.jstor.org/stable/20621242 [ Links ]
Borja, J. y Muxi, Z. (2003). El espacio público: ciudad y ciudadanía. Electa. [ Links ]
Canosa, E., Sáez, E., Sanabria, C. y Zaval, I. (2003). Metodología para el estudio de los parques urbanos: La comunidad de Madrid. GeoFocus, (3), 160-185. [ Links ]
Clemente Marroquín, B. (2007). Los parques urbanos en Hermosillo de 1997 a 2007 ¿abandono o recuperación? [Tesis de maestría, El Colegio de Sonora]. https://biblioteca.colson.edu.mx/e-docs/RED/RED000028/mobile/index.html [ Links ]
Corbett, J. y Mellouli, S. (2017). Winning the SDG battle in cities: How an integrated information ecosystem can contribute to the achievement of the 2030 sustainable development goals. Information Systems Journal, 27(4), 427-461. https://doi.org/10.1111/isj.12138 [ Links ]
Cramwinckel, J. (2019). The role of global open geospatial data in measuring SDG indicator 11.7.1: Public open spaces [Tesis de maestría, Wageningen University and Research Centre]. https://edepot.wur.nl/517956 [ Links ]
Cuvi, N. y Gómez-Vélez, L. (2021). Los parques urbanos de Quito: distribución, accesibilidad y segregación espacial. Fronteiras: Journal of Social, Technological and Environmental Science, 10(2), 200-231. https://doi.org/10.21664/2238-8869.2021v10i2 [ Links ]
Decreto 144 de 2020 [con fuerza de ley]. Que reforma y adiciona diversas disposiciones de la Ley de Equilibrio Ecológico y Protección al Ambiente del Estado de Sonora y de la Ley de Ordenamiento Territorial y Desarrollo Urbano del Estado de Sonora. 17 de noviembre de 2020. Boletín Oficial del Estado de Sonora, núm. 40, secc. I. http://consejoincide.com/wp-content/uploads/2020/11/DECRETO-144.pdf [ Links ]
Decreto de 1999 [con fuerza de ley]. Por el que se declara la adición de un párrafo quinto al artículo 4o. Constitucional y se reforma el párrafo primero del artículo 25 de la Constitución Política de los Estados Unidos Mexicanos. 28 de junio de 1999. Diario Oficial de la Federación, 28-06-1999. https://dof.gob.mx/nota_detalle.php?codigo=4950695&fecha=28/06/1999#gsc.tab=0 [ Links ]
Decreto de 2016 [con fuerza de ley]. Por el que se expide la Ley General de Asentamientos Humanos, Ordenamiento Territorial y Desarrollo Urbano y se reforma el Artículo 3o. de la Ley de Planeación. 28 de noviembre de 2016. Diario Oficial de la Federación, 01-06-2021. http://www.diputados.gob.mx/LeyesBiblio/pdf/LGAHOTDU_010621.pdf [ Links ]
Decreto de 2017 [Presidencia de la República]. Por el que se crea el Consejo Nacional de la Agenda 2030 para el Desarrollo Sostenible. 24 de abril de 2017. [ Links ]
Del Castillo-Alarcón, J. M. (1992). Propuesta integral de reforestación y tratamiento de aguas residuales en Hermosillo. En J. L., Moreno Vázquez (Ed.), Ecología, recursos naturales y medio ambiente en Sonora (pp. 299-322). Secretaría de Infraestructura Urbana y Ecología. [ Links ]
Dirección de Parques y Jardines (DPJ). (2020). Listado de plazas y bulevares, urbanos o rurales de Hermosillo [Hoja de cálculo en Excel]. [ Links ]
Ellis, D. y Schwartz, R. (2016). The roles of an urban parks system. World Urban Parks. [ Links ]
Enciso Miranda, C. A. (2016). Identificación de zonas prioritarias para reforestación en la ciudad de Hermosillo, Sonora [Tesis de maestría, Universidad Estatal de Sonora]. [ Links ]
Enríquez Acosta, J. A. (2007). Ciudades de muros. Los fraccionamientos cerrados en la frontera del noroeste de México. Scripta Nova, Revista Electrónica de Geografía y Ciencias Sociales, XI (230). https://www.ub.edu/geocrit/sn/sn-230.htm [ Links ]
Feltynowski, M., Kronenberg, J., Bergier, T., Kabisch, N., Łaszkiewicz, E. y Strohbach, M. W. (2018). Challenges of urban green space management in the face of using inadequate data. Urban Forestry & Urban Greening, 31, 56-66. https://doi.org/10.1016/j.ufug.2017.12.003 [ Links ]
Fernández-Álvarez, R. (2017). Inequitable distribution of green public space in Mexico City: An environmental injustice case. Economía, Sociedad y Territorio, 17(54), 399-428. https://doi.org/10.22136/est002017697 [ Links ]
Galizzi, B. (2020). Datos abiertos en gobiernos locales hacia los Objetivos de Desarrollo Sostenible 2030 [Archivo PDF]. Fundación Internacional Baltasar Garzón. http://eprints.rclis.org/40550/1/Datos%20Abiertos%20en%20Gobiernos%20Locales%20-%20completo.pdf [ Links ]
García Pérez, H. y Lara Valencia, F. (2016). Equidad en la provisión de espacios públicos abiertos: Accesibilidad, percepción y uso entre mujeres de Hermosillo, Sonora. Sociedad y Ambiente, (10), 28-56. https://doi.org/10.31840/sya.v0i10.1651 [ Links ]
González Gómez, J. (2018). Mecanismos de coordinación para la implementación nacional de la agenda 2030: Desafíos y oportunidades para México. Revista Buen Gobierno , (25), 1-17. http://revistabuengobierno.org/home/wp-content/uploads/2019/04/BG_25_4.pdf [ Links ]
Google Earth (2022). Google Esarth Pro (Versión 7.3.6.9345 64-bit) [Aplicación de escritorio]. https://www.google.com/earth/ [ Links ]
Google/Maxar Technologies (2021). Google data: Mapa de Hermosillo, Sonora, México. [XYZ Tiles QGIS]. Google Earth. https://www.google.com/earth/ [ Links ]
Gutiérrez Ruelas, U. (27 de febrero de 2008). Avanzan trámites en Hermosillo para construir el complejo cultural Musas. La Jornada. https://www.jornada.com.mx/2008/02/28/index.php?section=estados&article=031n1est [ Links ]
H. Ayuntamiento de Hermosillo. (2016). Programa de Desarrollo Metropolitano de Hermosillo. https://www.implanhermosillo.gob.mx/wp-content/uploads/2017/05/PDMHSEP2016.pdf [ Links ]
H. Ayuntamiento de Hermosillo. (2022). Plan Municipal de Desarrollo: Hermosillo 2022-2024. https://www.hermosillo.gob.mx/descargas/PMD_2022WEB.pdf [ Links ]
Harnik, P. (2006). The excellent city park system: What makes it great and how to get there. En R. H. Platt (Ed.), The humane metropolis: people and nature in the 21st-century city (pp. 47- 60). University of Massachusetts Press. [ Links ]
Hartig, T., Mitchell, R., de Vries, S. y Frumkin, H. (2014). Nature and health. Annual Review of Public Health, 35(1), 207-228. https://doi.org/10.1146/annurev-publhealth-032013-182443 [ Links ]
Hermosillo ¿Cómo Vamos? (HCV). (2021). Informe de Indicadores 2021. Observatorio para la Competitividad y el Desarrollo de Sonora A. C. Ayuntamiento de Hermosillo. [ Links ]
Hernández, Y. (9 de abril de 2020). Sigue en pie plan para rehabilitar La Sauceda; buscan inversionistas. El Imparcial.https://www.elimparcial.com/sonora/sonora/Sigue-en-pie-plan-para-rehabilitar-La-Sauceda-buscan-inversionistas-20200409-0018.html [ Links ]
Instituto Municipal de Planeación Urbana y del Espacio Público (Implan) Hermosillo. (2014). Programa de Desarrollo Urbano del Centro de Población de Hermosillo: Modificación 2014. https://www.implanhermosillo.gob.mx/wp-content/uploads/2017/08/PDUCPH-2014.pdf [ Links ]
Instituto Nacional de Estadística y Geografía (Inegi). (2020). Censo de Población y Vivienda 2020. Inegi. https://www.inegi.org.mx/programas/ccpv/2020/ [ Links ]
Instituto Nacional de Estadística y Geografía (Inegi). (2021). Marco Geoestadístico, diciembre 2021. Inegi. [ Links ]
Ji, H. y Ding, W. (2021). Mapping urban public spaces based on the Nolli map method. Frontiers of Architectural Research, 10 (3), 540-554. https://doi.org/10.1016/j.foar.2021.04.001 [ Links ]
Juca, G. E. F., y Carmona, J. G. C. (2016). La pérdida de las áreas verdes privadas como consecuencia de la construcción irregular. El caso de Cuenca-Ecuador. Estudios Sobre Arte Actual, (4). [ Links ]
Lara-Valencia, F. y García-Pérez, H. (2013). Space for equity: Socioeconomic variations in the provision of public parks in Hermosillo, Mexico. Local Environment, 20(3), 350-368. https://doi.org/10.1080/13549839.2013.857647 [ Links ]
Loelkes Jr., G. L., Howard Jr., G. E., Schwertz Jr., E. I., Lampert, P. D., & Miller, S. W. (1983). Land use/land cover and environmental photointerpretation keys (U.S. Geological Survey Bulletin, núm. 1600). U.S. Department of the Interior. https://doi.org/10.3133/b1600 [ Links ]
López de Lucio, R. (2007). Construir ciudad en la periferia: criterios de diseño para áreas residenciales sostenibles. Artes Gráficas Palermo. https://oa.upm.es/13373/1/Construirciudad_1.pdf [ Links ]
López González, F. M., Navarro Navarro, L. A., Díaz Caravantes, R. E. y Navarro Estupiñan, J. (2021). Cobertura vegetal y la distribución de islas de calor/oasis urbanos en Hermosillo, Sonora. Frontera Norte, 33, 1-32. https://doi.org/10.33679/rfn.v1i1.2088 [ Links ]
López Ordóñez, C. F. (2020). Planificación urbana en ciudades dispersas de clima desértico: La densificación vertical como estrategia para la mejora ambiental. El caso de Hermosillo (México) [Tesis de doctorado, Universitat Politècnica de Catalunya]. [ Links ]
Martínez Salido, J. (2017). Análisis de la cobertura vegetal y composición de especies de parques y jardines de Hermosillo [Tesis de licenciatura, Universidad Estatal de Sonora]. [ Links ]
Mercado Maldonado, L. y Marincic Lovriha, I. (2017). Morfología de isla de calor urbana en Hermosillo, Sonora y su aporte hacia una ciudad sustentable. Biotecnia, 19, 27-33. https://doi.org/10.18633/BIOTECNIA.V19I0.407 [ Links ]
Municipio de Hermosillo. (2017). Manual de organización. Coordinación General de Servicios Públicos Municipales. https://www.hermosillo.gob.mx/entidades/archivo/manuales/MOCoordinaciónGeneraldeServiciosPúblicosMunicipales.docx [ Links ]
Navarro Navarro, L. A. y Moreno Vázquez, J. L. (2016). Cambios en el paisaje arbolado en Hermosillo: Escasez de agua y plantas nativas. Región y Sociedad, 28(67), 79-120. https://doi.org/10.22198/rys.2016 67.a194 [ Links ]
Navarro-Estupiñan, J., Robles-Morua, A., Díaz-Caravantes, R. y Vivoni, E. R. (2020). Heat risk mapping through spatial analysis of remotely-sensed data and socioeconomic vulnerability in Hermosillo, México. Urban Climate, 31. https://doi.org/10.1016/j.uclim.2019.100576 [ Links ]
Nesbitt, L., Meitner, M. J., Girling, C., Sheppard, S. R. J. y Lu, Y. (2019). Who has access to urban vegetation? A spatial analysis of distributional green equity in 10 US cities. Landscape and Urban Planning, 181, 51-79. https://doi.org/10.1016/j.landurbplan.2018.08.007 [ Links ]
NOM-001-SEDATU-2021 de 2022 , Espacios públicos en los asentamientos humanos. Diario Oficial de la Federación, 22/02/2022. https://www.dof.gob.mx/nota_detalle.php?codigo=5643417&fecha=22/02/2022#gsc.tab=0 [ Links ]
ONU-Habitat. Programa de las Naciones Unidas para los Asentamientos Humanos. (20 de junio de 2020). Espacio público y COVID-19. ONU-Habitat. http://onuhabitat.org.mx/index.php/espacio-publico-y-covid-19 [ Links ]
ONU-Habitat. Programa de las Naciones Unidas para los Asentamientos Humanos. (2018). Índice de las Ciudades Prósperas, CPI, México 2018. ONU-Habitat. [ Links ]
Ortega-Rosas, C. I., Enciso Miranda, C. A., Macías-Duarte, A., Morales-Romero, D. y Villarruel-Sahagún, L. (2020). Urban vegetation cover correlates with environmental variables in a desert city: Insights of mitigation measures to climate change. Urban Ecosystems, 23(6), 1191-1207. https://doi.org/10.1007/s11252-020-00982-8 [ Links ]
Palazuelos Guerrero, L. (23 de diciembre de 2021). Video no 1 hoy, jueves 23 de diciembre, 2021. Desde Parque Sacramento en Hermosillo, Sonora ¿De qué estamos hablando con Astiazarán? [Video]. Facebook. https://www.facebook.com/100009156228878/videos/903055823729637/?t=529 [ Links ]
Peña Salmón, C. Á. (2011). Metodología para la planificación de áreas verdes urbanas: El caso de Mexicali, Baja California. Universidad Autónoma de Baja California. [ Links ]
Pérez-Medina, S. y López-Falfán, I. (2015). Áreas verdes y arbolado en Mérida, Yucatán. Hacia una sostenibilidad urbana. Economía, Sociedad y Territorio, 15 (47), 01-33. http://www.scielo.org.mx/scielo.php?script=sci_abstract&pid=S1405-84212015000100002&lng=es&nrm=iso&tlng=es [ Links ]
PlanetScope. (2022). Producto PSScene 4Band (RGB-NIR) [Mapa]. Recuperado el 29 de enero de 2022. http://www.planet.com [ Links ]
Proyecto Puente. (14 de febrero de 2020). AMLO pide que no vendan unidades deportivas, que sea él quien compre El Cárcamo en Hermosillo. [Video]. https://www.youtube.com/watch?v=StmciOJwwy0 [ Links ]
Puebla Corella, L. F. (2020). Mercado del suelo sin regulación, un incentivo para la especulación en la ciudad de Hermosillo, Sonora [Tesis de maestría, El Colegio de Sonora]. https://repositorio.colson.edu.mx/handle/2012/44571 [ Links ]
Quinton, J. M. y Duinker, P. N. (2019). Beyond burial: Researching and managing cemeteries as urban green spaces, with examples from Canada. Environmental Reviews, 27(2), 252-262. https://doi.org/10.1139/er-2018-0060 [ Links ]
Saldaña Vázquez, R. A. y Ramírez Miranda, M. Del S. (12 de octubre de 2021). Áreas verdes urbanas. ¿Por qué deberían ser multifuncionales y accesibles para todos? Desinformémonos. [ Links ]
Sánchez Juárez, C. J. (2021). Áreas verdes en la ciudad de Puebla: Reflejo de la desigualdad del espacio público y componente del derecho a la ciudad [Tesis de maestría, Benemérita Universidad Autónoma de Puebla]. https://hdl.handle.net/20.500.12371/12718 [ Links ]
Sistema de Información Geográfica y Estadística Municipal (SIGEM). (2022). Hermosillo, mapa interactivo. Ayuntamiento de Hermosillo. [ Links ]
Téllez Montes, De las N., Carrasco Aquino, R. J. y Castro Campos, J. (2020). Valoración de los parques urbanos en el contexto normativo de la Ciudad de México. Anuario de Administración y Tecnología para el Diseño, 21(21), 131-139. [ Links ]
Trancik, R. (1986). Finding lost space: Theories of urban design. John Wiley & Sons. [ Links ]
United Nations Human Settlements Programme (UN-Habitat). (2021). 11.7.1 provision and access to open spaces in cities 2020. United Nations. https://data.unhabitat.org/datasets/GUO-UN-Habitat::11-7-1-provision-and-access-to-open-spaces-in-cities-2020/about [ Links ]
United Nations Human Settlements Programme (UN-Habitat). (2022). Global public space programme. Anual report 2021. UN-Habitat. https://unhabitat.org/sites/default/files/2022/02/20220207_annual_report_gpsp_2021.pdf [ Links ]
United Nations. (2015). Sustainable Development Knowledge Platform. United Nations. https://sustainabledevelopment.un.org/ [ Links ]
Vázquez, T. (19 de abril de 2021). Áreas verdes en disputa ¿Qué hacer? El Imparcial. https://www.pressreader.com/mexico/el-imparcial/20210419/281530818856143 [ Links ]
Welle, B. (2016). Public space in cities–What’s the Measuring Stick? TheCityFix. https://thecityfix.c-om/blog/measuring-public-space-cities-sdg-habitat-indicator-ben-welle/ [ Links ]
Williams, T. G., Logan, T. M., Zuo, C. T., Liberman, K. D. y Guikema, S. D. (2020). Parks and safety: A comparative study of green space access and inequity in five US cities. Landscape and Urban Planning, 201, 103841. https://doi.org/10.1016/j.landurbplan.2020.103841 [ Links ]
World Health Organization (WHO). (2016). Urban green spaces and health: A review of evidence. WHO Europe. https://www.euro.who.int/data/assets/pdf_file/0005/321971/Urban-green-spaces-and-health-review-evidence.pdf [ Links ]
4The website of the Municipal Institute for Urban Research and Planning of Mexicali was visited (May 9, 2022), where a thematic map of green spaces of the city of Mexicali is up for sale; however, it was not acquired and was not analyzed due to time and money constraints.
6Land Planning and Urban Development Law of the State of Sonora [Ley de Ordenamiento Territorial y Desarrollo Urbano del Estado de Sonora] (Decree 144 of 2020).
7We had access to the raw data of López González et al. (2021) who estimated the average percentage of vegetation cover (VC) per urban block of Hermosillo; the Yáñez, Sahuaro, Palo Verde and La Manga public cemeteries had a VC of 12.76%, 13.35%, 12.8% and 12%, respectively.
8Enríquez Acosta (2007), in the case of Hermosillo, defines a gated community as “the physical space protected with fences and bars (...) existence of access controls to the community areas with booths and boom barriers and security based on the use of private guards” (p. 1).
9Not all neighborhoods have a park tended by the DPJ, despite being open. Such is the case of the Balderrama, Pimentel, La Mosca, El Jito neighborhoods, among others.
Received: May 17, 2022; Accepted: October 18, 2022
 Este es un artículo publicado en acceso abierto bajo una licencia Creative
Commons
Este es un artículo publicado en acceso abierto bajo una licencia Creative
Commons
