


Services on Demand
Journal
Article
 text in
  English (pdf)
 Article in xml format
 Article references
 Send this article by e-mail
Indicators
-
 Cited by SciELO
 -
 Access statistics
Related links
-
 Similars in
SciELO
Similars in
SciELO
Share

 Permalink
Frontera norte
On-line version ISSN 2594-0260Print version ISSN 0187-7372
Frontera norte vol.33 México 2021 Epub Sep 13, 2021
https://doi.org/10.33679/rfn.v1i1.2088
Article
Vegetation cover and urban heat islands/oases distribution in Hermosillo City, Sonora
1
 http://orcid.org/0000-0002-0639-6486
2
http://orcid.org/0000-0002-5819-9628
1El Colegio de Sonora, México; fmartin.lopezg@gmail.com, https://orcid.org/0000-0002-0639-6486
2El Colegio de Sonora, México; lnavarro@colson.edu.mx, http://orcid.org/0000-0002-5819-9628
3El Colegio de Sonora, México; rdiaz@colson.edu.mx, https://orcid.org/0000-0002-4117-2197
4Instituto Tecnológico de Sonora, México; javiernavarroe@gmail.com, https://orcid.org/0000-0002-4679-5684
The case of an arid Northwest city of Mexico is studied with the general objective of assessing the influence of the percentage of vegetation cover (VC) in Land Surface Temperature (LST) and mapping its spatial distribution, through a geographic information system using remote sensing data. Results showed: 1) on average, 12% (min. 0 to max. 59%) of a city block is covered with vegetation, 38% of the blocks had % VC ≤ 10; 2) the LST regression model estimated temperatures range from 37 to 45°C, the main explanatory variable was % VC, increasing % VC in 10 is associated with cooling effect of 1.1 °C. The spatial heterogeneity in the distribution of LST can be interpreted as the human effect modifying the climate on a small scale; this creates internal diurnal oasis.
Keywords: Urban heat island; Urban oasis effect; Vegetation; Hermosillo; Northwest Mexico
Se analiza el caso de Hermosillo, una ciudad del noroeste árido de México. El objetivo general es conocer la influencia del porcentaje de cobertura vegetal (CV) en la temperatura superficial del suelo (LST) y su distribución espacial a través de un sistema de información geográfica, utilizando datos de teledetección remota. En cuanto a los resultados, destaca en primer lugar que en promedio el porcentaje de CV en manzanas urbanas es de 12 por ciento (rango 0 a 59%), con un 38 por ciento de éstas con una CV ≤ 10 por ciento. En segundo lugar, que el modelo para estimar la LST detectó temperaturas promedio por manzana entre los 37 y 45°C, la principal variable explicativa fue el porcentaje de CV. Aumentar la CV en un 10 por ciento tendría el potencial de disminuir la LST en 1.1 °C. La heterogeneidad espacial en la distribución de la LST puede interpretarse como el efecto del ser humano modificando el clima a pequeña escala, esto crea un mosaico interno de oasis urbanos diurnos.
Palabras clave: isla de calor urbana; efecto oasis urbano; vegetación; Hermosillo; Noroeste de México
INTRODUCTION
The global urban surface will expand over the following decade; this poses the challenge of managing sustainable cities. According to United Nations (UN) prospectives, by 2030, about 5,167.258 billion people will live in cities, which would mean to build a city for 1.5 million people every week. This is the outcome of a global tendency of urban growth, the population living in cities totaled about 54 percent in 2016 ( United Nations, 2018 ). In Mexico, a decade ago such indicator was 78 percent ( INEGI, 2010 ); following these projections for the same year, people living in urban environments will be about 123,198 million ( United Nations, 2018 ).
The cities at the northwestern Mexican border, comprising not only those at the border line, but also the ones that are influenced by trans-border processes, which are integrated in industrial corridors, ( Kopinak, 1997 , Morales, 1999 ) for instance, the Phoenix - Tucson - Hermosillo - Guaymas corridor, have experienced a noticeable growth fostered by such processes over the last 40 years. Hermosillo, in Sonora, and Mexicali, in Baja California, have consolidated as the most populated arid cities in Mexico ( INEGI, 2010 ); Tijuana, Baja California, with a template semiarid climate, and Mexicali, are the most important populations centers in the border zone in northwestern Mexico ( Organización Panamericana de la Salud, 2012 ). On the Mexican side, the growth of the cities has been compact and more densely populated ( Trubetskoy, 2016 ). This has posed significant challenges as regards urban planning, given that local governments have experienced difficulties maintaining and expanding basic services, infrastructure, and urban equipment ( Acosta Enríquez, 2009 ). Among the most usual lacks, one finds public green areas and vegetation cover ( Bernal Grijalva, Navarro Navarro and Moreno Vázquez, 2019 ; Ojeda Revah & Espejel, 2014 ; Ortega-Rosas, Enciso-Miranda, Macías-Duarte, Morales-Romero, & Villarruel-Sahagún, 2020 ; Peña Salmón, 2011 ).
The problem is that the basis of urbanization is eliminating natural environments with a view to creating urban ones. In this way, wildlife (flora and fauna) is removed, while soil, physiography, hydrology, and so on are disturbed, modified and adapted for the benefit of human beings. Public spaces and natural elements are introduced into the new cities via policies. As a whole, these are known as urban ecosystem; that is to say, these are the green or blue areas of a city ( Bolund & Hunhammar, 1999 ). For its part, an urban forest is an important part of the biotic component of city ecosystems.
An Urban Ecosystem (UE) is a space that may be directly affected by public policy decisions. Politicians, legislators, leaders, and civil society influence on the definition of the proportion of the public space and construction designs, reforestation programs, etc., affecting the quantity, quality and distribution of the UE. They indirectly target the population that will receive the environmental benefits it produces; being important ones, the mitigation of heat and improving people’s thermal comfort, which impact on the inhabitability of urban spaces. It is worth mentioning that the equity in the access to public spaces and green areas is a 2030 UN Sustainable Development Goal ( United Nations, 2015 ) adopted by Mexico and set in the local agenda of states and municipalities ( DOF, 2017 ; González Gómez, 2018 ).
Most of the local administration of the cities at the northern side of the border have acknowledged the formation of urban heat islands (UHI) ( Chow, Brennan, & Brazel, 2011 ; Comrie, 2000 ; SDRUFC, 2020 ), where temperatures differ from the surrounding natural environment, have estimated the cover of their urban forests and set goals to increase it as a measure to mitigate the UHI effects. We can underscore the case of Phoenix, Arizona, which set the goal of increasing the cover of tree canopies from 10 to 25 percent by 2030 ( Davey Resource Group, 2014 ).
On the Mexican side, important advance has been made in relation to generation of academic information ( García-Cueto, Jáuregui Ostos, Toudert, & Tejeda-Martínez, 2007 ; Navarro-Estupiñán, Robles Morua, Díaz Caravantes, & Vivoni, 2020 ; Ojeda Revah & Espejel, 2014 ; Ortega-Rosas et al., 2020 ; Peña Salmón, 2011 ). However, not all the cities in the northwest have comprehensive studies on vegetation cover (VC) or data on the distribution of the urban forest cover, not even the intensity, distribution and characteristics of the UHI effects.
People in charge of setting public policies require accessible tools to estimate and monitor the sustainable management of UE. The use of remote sensing is an economically convenient alternative. This work contributes to the development and adaption of methodologies to process remote sensing data by means of the case study of the city of Hermosillo, located in the trans-border bioregion of the Sonoran Desert, in Mexico’s arid northwest.
The overall objective of this research was to find out the influence of vegetation on Land Surface Temperature (LST). The specific objectives were: a) estimate the urban percentage of Total Average Vegetation Cover (%TAVC) at the level of urban block, using data from Google Earth (GE) and satellite Sentinel 2A; b) calculate LST from a Landsat 8 thermal sensor and analyze its spatial distribution in order to localize the internal presence of UHI or urban oases; and finally, c) relate LST and %VC.
THEORETICAL-CONCEPTUAL FRAMEWORK
The formation of an urban microclimate has been a well-known phenomenon for some time now. Its discovery is attributed to British meteorologist Sir Luke Howard (1772-1864), who studied thermal differences between London urban areas and the surrounding rural zones ( Howard, 1833 ). According to Howard, “artificial” heat was produced by urban structures, population density and consumption of large amounts of fuels. Although the UHI term is formally attributed to Manley (1958) , it had been already used in a number of publications ( Landsberg, 1981 ).
At first, this phenomenon was studied through direct measurements of air temperatures using thermometers; usually, transversal thermal transects were made in the urban sprawl, starting and finishing in the rural environment. The data produced concentric isotherms, elongated to leeward from advection, with a descending gradient from the center toward the periphery. This thermal drift surrounded by lower temperatures, transcribed into a map, resembled an “island”; hence the name heat “island” ( Oke, 1982, p. 3 ).
Generally speaking, the causes that produce the UHI effect are: a) the characteristics of many construction materials that are dark, which makes them absorb and store heat; b) these materials are impermeable and absorb little moisture, decreasing their capacity to transform heat into vapor ( Gartland, 2008 ); c) a poor UE, i.e., little vegetation and few water bodies ( Cai, He, Yang, & Deng, 2014 ; Gunawardena, Wells, & Kershaw, 2017 ; Qiu et al., 2013 ); d) texture, design and architectural geometry (for example, “urban canyons”) of the urban sprawl; and, c) heat generated by anthropogenic activities.
The arrival of the space age and thermal sensors on satellites enabled using a new tool to analyze this phenomenon. The literature states that Rao (1972) was the first to demonstrate that the UHI effect may be detected using data from thermal sensors ( Gallo, Tarpley, McNab, & Karl, 1995 ); then, other studies able to detect this phenomenon ensued ( Roth, Oke, & Emery, 1989 ). Despite the simplicity to obtain and analyze data from remote sensors, the thermal transect method is still widely resorted to ( Georgakis & Santamouris, 2017 ; Smith, Webb, Levermore, Lindley, & Beswick, 2011 ).
An important difference between the two methodologies is that one measures air temperature, while satellites, LST; which García et al. (2007) called atmospheric and surface UHI effect, respectively. Since air is a poor heat conductor, LST is almost always higher than air temperature ( Mildrexler, Zhao, & Running, 2011 ). There are ideal synoptic conditions for the UHI effect to express: a) anticyclonic conditions (high atmospheric pressure); b) clear sky; and, c) wind speed under five meters per second ( Smith et al., 2011 ). Likewise, cloudiness is an impediment for the use of satellite imagery.
Urban oasis effect
In cities in arid environments a phenomenon inverse to UHI takes place; it is known as urban oasis effect. The desert bare soil can reach very high temperatures, up to 70ºC in the Sonoran Desert, for instance ( Nobel, 1984 ). Additionally, these cities tend to create oases supported on irrigation, which artificially keep a higher VC and a more diverse urban forest than the surrounding desert biomes ( Fan et al., 2017 ); plus, a strong tendency to use exotic vegetation ( Navarro Navarro & Moreno Vázquez, 2016 ). Even the effect of “urban canyons” is the opposite, given that shadows reduce the incidence of solar radiation ( Alobaydi, Bakarman, & Obeidat, 2016 ).
The cooling effect of vegetation comes from a greater evapotranspiration in the oasis as compared with the surrounding arid zones ( Hao, Li, & Deng, 2016 ). In a city, an internal oasis may be an urban park ( Declet-Barreto, Brazel, Martin, Chow, & Harlan, 2013 ), or a lake surrounded by vegetation, where energy dissipates through evaporation and evapotranspiration, producing cool-offs ( Gunawardena et al., 2017 ).
However, this oasis effect is diurnal, for the cooling rate is faster in the rural environment that in the city. Grimmond, Oke, & Cleugh (1993) found out that the area of rural reference selected to compare with the urban center will determine the intensity of the UHI effect. The authors above discovered the oasis effect when they made a comparison with a rural arid zone, the city was cooler than the rural environment by 1-2ºC from 9 to 17 hrs. This effect was also reported for Teheran, Iran ( Haashemi, Weng, Darvishi, & Alavipanah, 2016 ), and for Mexicali, Baja California ( García et al., 2007 ).
Studies at regional and global level define UHI at city level ( Matson, Mcclain, McGinnis, & Pritchard, 1978 ; Peng et al., 2012 ; Haashemi et al., 2016 ). On other occasions, the interest is to ascertain the spatial distribution of LST in the urban polygon in order to relate it with land use ( García et al., 2007 ; Navarro-Estupiñán et al., 2020 ).
The literature ( Chakraborti et al., 2019 ; García et al., 2007 ; Kim, Jun, Yeo, Kwon, & Hyun, 2019 ; Navarro-Estupiñán et al., 2020 ) suggests that there may be cold or warm anomalies depending on several factors. López Gómez, Fernández García and Arroyo Llera (1995) demonstrated that in the case of Madrid, Spain, the UHI effect is not uniform throughout the urban sprawl; there are secondary local minimums and maximums provoked by differences in volume and building density and open spaces as well (particularly parks).
Urban ecosystem and vegetation cover
It is important to conceptually clarify the relation between ecosystem, forest, and urban vegetation. In the first place, the urban environment is a mosaic of spaces with varying levels of biotic, abiotic, and anthropic elements that create a habitat for people and other living beings (mammals, birds, reptiles, fish, invertebrates, etc.) and this is what we call UE ( Pickett et al., 1997 ; Endsley, 2018 ). As well, Endsley (2018) discusses that the urban area may be easily subdivided into two categories using remote sensors: impermeable surface and green surface. The latter encompasses urban vegetation, which Schmid (1975) defines as the spontaneous or grown (sowed, planted) vegetation within the city.
Secondly, VC refers to the percentage of soil surface covered with vegetation. VC can specifically measure foliage excluding open parts of plant canopy or the entire tree canopy, measuring the vertical projection of its outer perimeter; it may even include or not only live plants ( BLM, 1999 ).
Some articles define urban forest as the set of vegetation contained in the city polygon ( Sanders, 1984 ; Walker & Briggs, 2007 ). For example, Sanders (1984, p.15) mentioned that “the limit of an urban forest is established by a jurisdictional criterion and comprises all manner of vegetation within the urban area, regardless of its physical characteristics”. These definitions contribute to confusion by equating “forest” and “urban vegetation”.
Some other definitions emphasize the presence of trees as a necessary and sufficient condition for the existence of an urban forest, whereas the associated vegetation such as shrubs, herbaceous plants and grasses may be present or not. Miller, Hauer and Werner (2015) refer the urban forest as the sum of ligneous species and associated vegetation within and around dense living spaces, either in rural communities or large metropolitan zones. Benavides-Meza (1989, p. 967) points out: “the urban forest is composed of trees and associated vegetation that is found on sidewalks, avenues, medians, parks, gardens, cemeteries, right of ways and other spaces”.
To conclude, the urban forest cover is associated to the concept of tree canopy cover, it is not synonym with total average vegetation cover percentage (%TAVC), 5 instead it is a subset of it. The clarification is relevant when indirect methods to ascertain %VC are utilized, as it is the case of aerial photography or Normalized Difference Vegetation Index (NDVI) ( Tucker, 1979 ), which measures all the photosynthetically active tissue in a certain area.
CASE STUDY
According to data from the 2010 Population Census ( INEGI, 2010 ), Hermosillo, capital city of the state of Sonora, was the most populated arid-climate city in Mexico ( “ BWh” according to Köppen-Geiger classification). It is located in northwestern Mexico ( map 1 ) inside the Sonoran Desert bioregion ( Shreve & Wiggins, 1964 ).

Source: own elaboration based on diverse digital cartography dowloaded from INEGI (2020), Portal de Geoinformación 2020 (CONABIO, 2020) and Google Earth.
Map 1. Regional location of Hermosillo
The state of Sonora has an aridity gradient that increases toward the West and North. To the West, elevation increases, and weather becomes semiarid ( Felger, Johnson, & Wilson, 2001 ). The City of Hermosillo sits in the transition between semiarid and arid climates ( INEGI, 1992 ); toward the coast, vegetation becomes scarce and desertic. The sort of vegetation that grows around Hermosillo is low shrubland, which may be described as a combination of around 27 sorts of middle-height trees, 17 belonging to Fabaceae, shrubs and some cacti ( COTECOCA, 1986 ).
High temperatures are characteristic of Hermosillo; it is common to read news items about breaking a historic temperature record. For instance, on July 2nd, 2014, temperature reached 48.5º C, the item stated that Hermosillo was the hottest city in the world on such day (Sánchez Dórame, 2014). The analysis of data on maximum daily temperature for the period from 2000 to 2017 ( CONAGUA, 2018 ) shows that there are 120 days (range 101-146) with a temperature higher than 100 °F ( ~38°C). This value may be compared with the city of Phoenix (1980-2010), which on average has 110 days with a temperature equal or higher than 100 ºF ( National Weather Service, 2017 ). Navarro-Estupiñán et al. (2018) analyzed data from weather stations of Comisión Nacional del Agua [National Water Commission] in Sonora and their results made the overall increase in warm days and heat waves (+138%) evident.
Besides warm summers, there is a shortage of water. In recent years, the image of the completely dry Abelardo L. Rodríguez dam, in the periphery of the city ( map 1 ), is a piece of news that has received attention from local newspapers. According to Landsat satellite imagery for 2000-2018, the dam has completely dried up in 12 out of the last 19 years, remaining dry from April to late June; at present, the city has water 24 hours a day, though before 2013, when it began to be brought from the Yaqui River basin, threats of rationing were constant.
This is the context in which Hermosillo expanded between 2000 and 2017; it grew from 13,992 ha to 18,741 ha, while the population changed from 545,928 to 819,999 inhabitants 6 ( INEGI, 2015 ). This expansion took agricultural land and desert shrubs used for grazing, transforming the natural ecosystem into an urban one ( Lagarda Lagarda, Vázquez Landeros, & Noriega Nieblas, 2009 ). 7
In Hermosillo’s urban environment there are neither water bodies nor perennial streams that cross the city; map 1 shows the dam in blue and ephemeral lakes by the end of Sonora River ford, fed by rainfall ( Boletín Oficial, 2014 ). 8 The streams that cross the city, far from being promoted as green riparian corridors, in most of the cases are turned into garbage dumps, recipients of runoffs and wastewater ( Abril Fimbres, 2016 ; El Imparcial, 2014 ; López, 2018 ; Lozano, 2015 ). The city ended up deciding to channel such streams ( Boletín Oficial, 2018a ). This policy for rainfall discharge in the urban zone was recently changed by the coming into force of a technical norm that sets forth the characteristics and requirements to add green infrastructure in the municipality of Hermosillo ( Boletín Oficial, 2018b ).
Furthermore, little is it known about the vegetal component. In 2018, Barrera-Alarcón divided the city into 10 sectors, estimated a %TAVC of 20.99, a range from 7.09 to 50.43, using Landsat 8 data. Recently, the %VC of the urban forest was calculated, at the level of Basic Geostatistical Area (BGSA) by INEGI, as 6.4 percent by means of photo-interpreting high-resolution images ( Ortega-Rosas et al., 2020 ). Navarro Navarro and Moreno Vázquez (2016) found that sidewalks (58%) and front yards (77%) had five or fewer trees per each hundred linear meters; that is to say, fewer than one tree per house in a yard or sidewalk. In 2016, Bernal Grijalva et al. (2019) calculated the surface of parks and gardens as 273 hectares, which meant 3.08 m2 per inhabitant.
The heat waves in July 2018 around the world ( BBC News, 2018 ) were also experienced in Mexico, particularly in Sonora, where Fondo Nacional de Desastres Naturales [National Fund for Natural Disasters] issued an emergency declaration due to a heat wave in 64 municipalities, including Hermosillo ( DOF, 2018 ). These phenomena created a community concern about lack of greenness and trees in the city ( Arellano, 2018 ).
Strategy to reforest the city
Efforts to green Hermosillo’s UE are usually set on the basis of number of planted or donated trees. Commonly, there is no follow-up for reforestations, for example, to assess the survival rate. Reforestation goals embellish the stats in the annual reports of the municipal government administrations. In table 1 , the results of a document review of municipal reports from 1997 to 2018 are displayed. Although there is no single format to report these data annually, all the reports informed about reforestation activities and donations of trees. In total, there are about 720,309 trees planted over 22 years. Supposing they had grown and developed up to a canopy of 6 meters in diameter, they would account for a potential tree canopy cover of 11.31 percent, considering an urban sprawl of 18,000 ha.
Table 1. Report of trees planted or donated by municipal administrations of Hermosillo
| Period | Planted or donated trees |
|---|---|
| 1997-2000* | 158 000 |
| 2000-2003* | 47 321 |
| 2003-2006* | 125 000 |
| 2006-2009* | 194 333 |
| 2009-2012* | 46 791 |
| 2012-2015* | 44 273 |
| 2015-2018** | 82 417 |
| 2018-2019*** | 22 174 |
| Total | 720 309 |
(source: own elaboration based on reviews of government reports) Sources:
*Third governmental report by Valencia Juillerat (2000), Búrquez Valenzuela (2003), del Río Sánchez (2006), Gándara Camou (2009); Gándara Magaña (2012) and López Caballero (2015);
**Three governmental reports by Acosta Gutiérrez (2016, 2017) and Fernández Muñoz Fernández (2018);
***first report: López Cárdenas (2019).
Hermosillo’s municipal plant nursery carries out a constant tree donation campaign, delivering from five to seven plants per individual; it houses a total of 50 exotic and native species and is able donate up to 10,000 plants a month ( Inzunza, 2019 ). In addition to these donations, people can go to any of the 45 existing commercial plant nurseries ( INEGI, 2019 ), which largely offer exotic species very colorful and ornamental.
The goal of planted trees should be accompanied by that of reaching a certain increase in the %TAVC or tree canopy cover of the city in the middle and long terms. The public or private space necessary to establish vegetation is a restriction. According to estimations by Navarro-Estupiñán et al . (2020), more than a half (60%) of Hermosillo’s urban area is impermeable surface; distinguishable is the urban center (80%), heavily populated housing areas (75%), and 40.89 percent of the urban area is streets and roads; green areas account for only 1.87 percent of the total urban area. 9 In this way, priority zones for reforestation will have to be balanced ( Ortega-Rosas et al., 2020 ) with the spaces available for reforestation.
MATERIALS AND METHODS
Landsat 8 data
Satellite Landsat 8 is equipped with two sensors: OLI, Operational Land Imager, and TIRS, Thermal Infrared Sensor. Images were downloaded from the United States Geological Survey (USGS) website, they were taken on June 12, July 14, August 15, 2016, at 10:52 am local time and correspond to dates in the three months with the highest temperatures ( CONAGUA, 2018 ). The days above met the ideal synoptic requirements suggested by Smith et al. (2011) . The spectrum bands 4 (red) and 5 (near infrared) of OLI and 10 (thermal infrared) of TIRS were utilized.
Satellite imagery were cut to match with the limits of Hermosillo’s polygon in 2017, which was created from the union of the urban BGSAs, the resulting polygon was updated using a GE image (March 27, 2017). A new raster was generated with the arithmetical mean of the three months; with OLI data, NDVI was estimated, while with TIRS data, LST.
Calculation of LST
In the first place, Fractional Vegetation Cover (FVC) was calculated according to Carlson and Ripley’s (1997) equations. Secondly, following FVC, each pixel was conditionally assigned an emissivity value using the scale proposed by Skoković et al. (2014) and Sobrino et al. (2008) . Finally, LST was calculated in Celsius using Avdan and Jovanovska’s (2016, p. 3) procedure.
Estimation of VC from NDVI
The percentage of vegetation coverage was ascertained at the level of urban block; the entire procedure is described in figure 1 . The total number of blocks in the city was 14,277 ( INEGI, 2016 ), the final sampling frame was 12,180 blocks from which a simple random sample of 150 was taken.

Source: own elaboration based on document reviews. Note: NDVIs = minimal NDVI value; NDVIV = maximum NDVI value; i = 1,2,3, …, 150 blocks.
Figure 1. Flow chart to ascertain %VC from photo-interpreting and Carlson and Ripley’s (1997) FVC
The 150 blocks were photo-interpreted ( Loelkes Jr., Howard Jr., Schwertz Jr., Lampert, & Miller, 1983 ) from a GE image dated March 27, 2017, classifying the area into two categories: a) impermeable surface (built space covered in concrete, asphalt, and other artificial elements); and, b) VC that comprises two elements: b1) urban forest (previously defined), and b2) herbaceous or grass strata. 10
With an image from Sentinel 2A (European Space Agency) (image date: 14/06/2017; 11:08 A.M. local time), 11 NDVI ( Figure 1 , inset “a”), Normalized Difference Water Index, NDWI, ( McFeeters, 1996 ), Normalized Difference Build-up Index, NDBI, ( Zha, Gao and Ni, 2003 ) were calculated.
Carlson and Ripley’s (1997) exponential model was linearized ( figure 1 , “f”) and a simple regression was run, where the dependent variable is VC from photo-interpretation (Yi) and the independent variable the mean F(x) per block (Xi) ( Figure 1 , “c” and “e”). Although this model may seem tautologic, it enables an empirical approximation to the values of A and B, 12 to relate the dimensionless values of NDVI to a tangible measure such as %VC.
Multivariate statistical model: LST and VC
A multivariate linear regression model was specified at the level of urban block to find out the influence of %VC on LST. The explanatory variables were: NDWI; NDBI; elevation (altitude), as suggested by Navarro-Estupiñán et al. (2020) ; houses per block; population by hectare. By means of Semi-automatic Classification Plugin (SCP) ( Congedo, 2013 ) from QGIS ( QGIS Development Team, 2017 ) the percentage of raster cells per block classified as reflective roofs, asphalt and bare soil.
RESULTS AND DISCUSSION
VC percentage
The relation between NDVI and %VC values, obtained from photo-interpretation, is presented in Equation 1 . The model coefficients were statistically significant (P < 0.001) with a high explanatory power (R2 = 0.83). Therefore, this study suggests that %VC per block can be estimated by means of NDVI using Carlson and Ripley’s (1997) FVC formula.
Most of VC was tree canopy. Only in two out of the 150 photo-interpreted blocks was a small proportion of herbaceous or grass stratum detected. The month of March is part of the dry season in Hermosillo, greenness is explained by the trees, which comprise non-deciduous exotic species such as Benjamin fig ( Ficus benjamina ), black olive tree ( Bucida buceras ), bitter orange ( Citrus aurantium ), bastard cherry ( Ehretia tinifolia ), flamboyant ( Delonix regia ), indian laurel fig ( Ficus nítida ), plumeria ( Plumeria rubra ), among others which are the most abundant widely-distributed exotic arboreal species in Hermosillo ( Navarro Navarro and Moreno Vázquez, 2016 ). A photointerpretation of a GE image between July and September would have showed a greater seasonal VC.
The linear and exponential models specified in figure 1 are shown in equation 1 .
Equation 1: Specified models
Note: for abbreviations, see figure 1 .
According to this model, Hermosillo has a %TAVC of 11.93 13 (range from 0 to 59%), the distribution of frequencies indicates that 38 percent of the blocks has a %VC under 10 (see graph 1 ). This datum is comparable with the one found by Peña Salmón (2011, p. 242) for another arid city in northern Mexico, Mexicali, Baja California, the author estimated the TAVC of the urban sprawl as 13.88 percent. The result moves away from the calculation by Barrera Alarcón (2018) , who uses large-extension polygons that encompass inter-urban rugged terrains and peripheral zones with native vegetation, considered growth reserves. Ortega-Rosas et al. (2020) calculated the mean percentage of tree canopy cover (urban forest) as 6.4 percent (CI 95% 0-39%). This result would be comparable with that of the present study, however they resorted to a larger geographic scale: BGSA. By and large, for desert American cities the mean urban forest cover was 10 percent; specifically, for instance, Tucson with 14 percent, and Ciudad Juarez with 4 percent ( Nowak et al., 1996 ). More recent studies on cities at the arid and semiarid border strip include San Diego, California, with 13 percent ( SDRUFC, 2020 ), and Yuma, Arizona, with 3.5 percent ( City of Yuma, 2019 ). Table 2 shows a comparative summary of the results of this work with those from other studies.
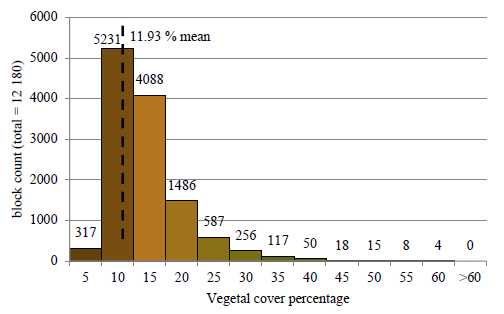
Source: own elaboration based on data from Sentinel 2A, GE 2017 and INEGI (2016).
Graph 1. %VC frequency distribution by urban blocks
Table 2. Comparison of results of %TAVC with other studies
| City | Reference | Sort of %VC |
Value (%) | Observations |
|---|---|---|---|---|
| Hermosillo, Sonora | This work | TAVC | 11.93 | See methodology |
| Hermosillo, Sonora | Barrera Alarcón (2018) |
TAVC | 20.9 | NDVI from Landsat 8, 30-m resolution; with very large polygons that encompass inter-urban rugged terrains and peripheral areas with native vegetation. |
| Hermosillo, Sonora | Ortega-Rosas et al. (2020) |
Urban forest |
6.4 | High-resolution ortho-photo-interpretation. 10- percent sampling of each BGSA area. |
| Mexicali, Baja California |
Peña Salmón (2011) |
TAVC | 13.9 | NDVI from Quickbird, 2.6-m resolution. Public and private zones within the urban sprawl. |
| Ciudad Juárez, Chihuahua |
Nowak et al. (1996) |
Urban forest |
4.0 | Sampling of census areas. Method not specified. |
| Yuma, Arizona, EE. UU. |
City of Yuma (2019) |
Urban forest |
3.5 | Aerial photograph. Method not specified. |
| San Diego, California, EE. UU. |
SDRUFC (2020) |
Urban forest |
13.0 | LIDAR from flights and high-resolution imagery. |
Source: own elaboration.
Furthermore, 593 polygons corresponding to urban parks managed by the Directorate of Parks and Gardens of the municipality of Hermosillo were used, estimating a mean VC of 20.92 percent (see graph 2 ). Bernal Grijalva et al. (2019) found a value of 27 percent for a sample of 112 parks. Map 2 summarizes the results; dark green indicates areas with a higher %VC.

Source: own elaboration based on data from Sentinel 2A, GE 2017 and INEGI (2016)
Graph 2. %VC frequency distribution for urban parks

Temperature distribution
The mean LST range per block was 37.35 - 45.44° C. Map 3 summarizes the results, red indicates areas with high temperatures and blue, low values; visually, there is a heterogeneous spatial distribution of this variable.

The visual supervision of the LST map suggests the formation of warm or fresh clusters. The global Moran index ( Moran, 1950 ) was calculated as 0.96 (P < 0.01), verifying the existence of a positive spatial autocorrelation. This indicates that pixels with positive (or negative) deviations from the mean are adjacent.
LST map was visually contrasted with similar maps produced by Mercado Maldonado and Marincic Lovriha (2017) , Barrera Alarcón (2018) and Navarro-Estupiñán et al. (2020) , with important coincidences in many warm and fresh clusters. Additionally, the research results reaffirm that Hermosillo’s UHI does not follow the typical pattern of concentric isotherms with a descending gradient from the center toward the periphery, but a mosaic of warm and fresh areas; this concurs with findings by García-Cueto et al. (2007) for Mexicali.
Figure 2 shows information on these clusters obtained via the local Moran index ( Anselin, 1995 ). Cold or warm points were taken from the clusters with statistically significant high or low values (P <= 0.05). Later on, contour lines, isolines, were produced utilizing local Moran index values; these lines served as a guide to detect concentration points, from which the central pixel was taken. In total, 304 urban oases and 326 UHI were identified, with a mean LST of 38.9°C and 44.2ºC, respectively. The difference between these clusters was statistically significant (P < 0.01). For Hermosillo, in warm months from June - August, 38ºC may be considered an urban oasis on this temperature measurement scale.

Source: own elaboration with data from Landsat 8 and Google Earth.
Figure 2. Spatial distribution of the oases (cold clusters) and urban heat islands (warm clusters) estimated with the local Moran index
With a random sample of 32 UHI and 32 urban oases, the sort of cover and use of soil in each point was photo-interpreted. It was possible to verify that vacant land with bare soil, asphalt and sports parks with synthetic grass consistently appear as UHI. The high LST of bare soil in desert zones is a common finding in other studies ( Bokaie, Zarkesh, Arasteh, & Hosseini, 2016 ; García-Cueto et al., 2007 ; Ibrahim & Rasul, 2017 ). The heat source with the highest temperature in the city is in a 280-cell raster cluster with a mean LST of 52.3°C (range 50.06-54.16°C) in the industrial area, where the stamping and assembly Ford factory is.
On the other hand, areas with abundant vegetation: medians in boulevards, parks with no synthetic grass, margins of streams and rugged terrains, areas near the urban periphery ( figure 2 ) largely appear as urban oases. Consistently, roofs (about 30) with high albedo (white in color) that become cold clusters are observed, which are as relevant as urban parks with high VC. The effect of these roofs is very significant ( Costanzo, Evola & Marletta, 2016 ); this way, they appear as urban oases with no VC.
Temperature and VC
Finally, LST was related to %VC. The variables were sequentially included with a view to comparing the full model (model 9) with a set of nested models ( table 3 ). The parsimony principle (Occam’s razor) stipulates that the simplest model is the one to choose.
Table 3. Results of the estimations of the nested multivariate linear regression models
| Variable/ Indicator | Mean and range◇ |
Model 1 | Model 2 | Model 3 | Model 4 | Model 5 | Model 6 | Model 7 | Model 8 | Model 9 |
|---|---|---|---|---|---|---|---|---|---|---|
| Intercept | -- | 42.0300*** | 44.0800*** | 43.2900*** | 43.4500*** | 43.6100*** | 42.8200*** | 42.7800*** | 42.8900*** | 42.8900*** |
| %VC | 12.05 (0- 59.44) |
-0.0511*** | -0.0516*** | -0.1034 *** |
-0.0864*** | -0.0777*** | -0.1059*** | -0.1054*** | -0.1125*** | -0.1135*** |
| Elevation (meters) | 219 (171- 351) |
-- | -0.0093*** | -0.0086 *** |
-0.0090*** | -0.0092*** | -0.0080*** | -0.0080*** | -0.0074*** | -0.0074*** |
| NDWI (x 100) | -15.93 (- 39.46-0) |
-- | -- | -0.0798 *** |
-0.0619*** | -0.0489*** | -0.0989*** | -0.0970*** | -0.0972*** | -0.0980*** |
| NDBI (x 100) | 0.03 (- 20.65-21.75) |
-- | -- | -- | 0.0397*** | 0.0511*** | 0.0365*** | 0.0336*** | 0.0211*** | 0.0205*** |
| Reflective roofs (%) | 0.87 (0-58.79) | -- | -- | -- | -- | -0.0217*** | -0.0163*** | -0.0155*** | -0.0163*** | -0.0162*** |
| Asphalt (%) | 2.23 (0-100) | -- | -- | -- | -- | -- | 0.0342*** | 0.0348*** | 0.0299*** | 0.0297*** |
| Bare soil (%) | 38.19 (0-100) | -- | -- | -- | -- | -- | -- | 0.0012*** | 0.0016*** | 0.0016*** |
| Population/hectare | 102 (0-383) | -- | -- | -- | -- | -- | -- | -- | -0.0015*** | -0.0012*** |
| Houses/hectare | 34 (0-80) | -- | -- | -- | -- | -- | -- | -- | -- | -0.0009 |
| Residual DF | -- | 11 504 | 11 503 | 11 502 | 11 501 | 11 500 | 11 409 | 11 408 | 11 407 | 11 406 |
| R2 | -- | 0.1287 | 0.2175 | 0.2490 | 0.2679 | 0.2747 | 0.3233 | 0.3239 | 0.3340 | 0.3341 |
| R2 Adjusted | -- | 0.1287 | 0.2174 | 0.2488 | 0.2677 | 0.2744 | 0.3230 | 0.3235 | 0.3335 | 0.3336 |
| AIC | -- | 27 314.7 | 26 080.3 | 25 609.9 | 25 317.7 | 25 212.5 | 24 416.3 | 24 408.4 | 24 237.7 | 24 238.1 |
| SCR | -- | 7 231 | 6 495 | 6 233 | 6 076 | 6 020 | 5 616 | 5 611 | 5 528 | 5 527 |
| ▵SCR | -- | -- | 737*** | 261*** | 157*** | 56*** | 403*** | 5** | 84*** | 1 |
Source: own elaboration with data from Landsat 8, Google Earth, Sentinel 2A and INEGI (2010, 2016).
Note:
*p < 0.05
**p < 0.01
***p < 0.001;
DF: degree of freedom.;
▵SCR: change in residual sum of squares.
Observations: 11 506.
◇Mean values per block.
By raster cell at polygon scale, ranges are different: %VC (0-91), NDWI (-71.62-58.53), NDBI (-55.06-91.12), LST (28.97-54.20). Houses/hectare was restricted to 80 (95% of blocks).
With these results, we conclude that model 8 is the one that best fits the data (R2 = 0.33). At urban-block scale, the model found a statistically significant negative correlation between LST and %VC. According to model 8, an increase in VC from 0 to 50 percent would have an effect of 5.7°C on the reduction of LST, as it would be the case of reforesting a park where, as deduced from graph 2, there is a large opportunity area to turn parks into urban oases. For the city of Hermosillo, Ortega-Rosas et al. (2020) suggested that increasing the urban forest cover in 10 percent would have an effect on the reduction of the daily mean maximum temperature of 0.11°C (CI at 95% 0.05-0.14), and a diminution of 0.4°C (CI at 95% 0.21-0.49) of the mean air temperature.
As regards control variables, not all the signs of the coefficients corresponded to those expected. Housing and population density variables were negative with a very reduced impact, it was expected that densely populated zones had a larger built surface ( Navarro-Estupiñán et al., 2020 ) as well as a higher LST. The signs of NDWI and NDBI were as expected, and their inclusion doubled the explanatory power of the reduced model. The relative amounts of asphalt, bare soil and reflective roofs per block had coefficients as expected, though with very low magnitudes.
The absence of natural or artificial streams and water bodies as components of Hermosillo’s urban ecosystem components was noticed with NDWI. It fluctuated from - 0.716 to 0.585, only 0.005 percent of all the cells recorded a value over 0.1, threshold from which the presence of water is detected; such cells were left out of the grid of urban blocks. High negative values ( < -0.38) were related to green areas, whereas less negative values ( ~-0.25-0.01) with bare soil or impermeable cover; which turned into a strong negative correlation between %VC and NDWI (-0.83, P < 0.05).
The results suggest that control variables related to soil uses are needed so that a better model specification is expected. For example, there were many mixed-use blocks that were sparsely populated and many undeveloped plots with bare soil, which were identified as warm clusters; moreover, there were also unpopulated blocks with green areas or sporting land use and abundant VC, and blocks with enclosed shopping centers with highly reflective roofs, which were considered cold clusters. However, the results of Navarro-Estupiñan et al. (2020) , which relate LST and soil uses, show little variance between them. In the present study, only 2.5 percent of raster cells had superior (inferior) values to two standard deviations for LST.
CONCLUSIONS
The use of remote sensing data offers a robust and sufficient accurate option to monitor UE, in particular, its green component. Data are constantly improving in accuracy and resolution. What is most important, there is a global policy of governments that sponsor spatial programs to make them available to the public for free.
Water bodies and courses as well as UE flora have the potential to mitigate the UHI effect, improving the inhabitants’ thermal comfort. However, “green” or “blue” areas in Hermosillo are scarce. The “blue” component is minimal and is represented by non-induced spaces (neither created nor designed) along the course and shores of the Sonora River ford such as La Sauceda wetland, the only water body for recreational use open to the public.
Furthermore, the results estimated a %TAVC for the city of Hermosillo of 11.93% (range 0-59%); according to the model, 38 percent of the urban blocks have a %VC equal or smaller than 10, this is, 90 percent of them has impermeable surface or bare soil. VC is largely composed of tree canopy. In dry season, the greenness of the city is explained by trees and shrubs since the herbaceous layer is virtually inexistent.
The following objective was the estimation of LST. The obtained results were in the range from 37.35 to 45.4 °C average LST per urban block. A statistically significant negative relationship between LST and the proportion of VC per block was found. The model suggested that an increment in 10 percent of VC would reduce LST in about 1.1ºC.
LST distribution in the urban polygon did not show the typical pattern with a warmer central nucleus and a descending gradient toward the urban periphery. It resembles a mosaic of warm or cold clusters. The spatial heterogeneity in the distribution of the LST variable may be interpreted as the effect of human beings’ modifying the weather at small scale, which creates oasis effects or diurnal cold clusters, a result of the presence or more VC.
Considering that UE and its green component are spaces designed by human beings, the implications of these results in public policies suggest promoting the sustainable densification of the urban forest –taking the context of water scarcity into context–, under the premise of accomplishing an urban-scale homogenous spatial distribution that provides universal access for the environmental services vegetation offers, for example, urban oases. Reforestation goals must be carried out with a view to increasing %TAVC, not only the number of planted trees.
The present analysis produces results at a resolution sufficient to be able to recommend mitigation actions at local level; this methodology is useful for governments and research centers to observe and monitor the urban environment and its benefits for people’s wellbeing.
REFERENCES
Abril Fimbres, N. A. (2016, octubre 18). Aguas negras, graveras y basureros. Proyecto Puente . [ Links ]
Acosta Enríquez, J. Á. (2009). Migration and Urbanization in Northwest Mexico’s Border Cities. Journal of the Southwest , 51 (4), 445-455. https://doi.org/10.1353/jsw.2009.0010 [ Links ]
Acosta Gutiérrez, M. I. (2016). 1 Informe de Trabajo 2016 ¡Para Cumplir Contigo! México: H. Ayuntamiento de Hermosillo. [ Links ]
Acosta Gutiérrez, M. I. (2017). 2 Informe de Trabajo 2017 . Hermosillo: H. Ayuntamiento de Hermosillo. [ Links ]
Alobaydi, D., Bakarman, M. A. y Obeidat, B. (2016). The Impact of Urban Form Configuration on the Urban Heat Island: The Case Study of Baghdad, Iraq. Procedia Engineering , 145 , 820-827. https://doi.org/10.1016/j.proeng.2016.04.107 [ Links ]
Anselin, L. (1995). Local Indicators of Spatial Association—LISA. Geographical Analysis , 27 (2), 93-115. https://doi.org/10.1111/j.1538-4632.1995.tb00338.x [ Links ]
Arellano, A. (2018, julio 31). Hermosillo tiene 300% menos de áreas verdes; los gobiernos no tienen estrategias para reforestar. Proyecto Puente . Recuperado de https://proyectopuente.com.mx/2018/07/31/sonora-tiene-300-menos-de-areas-verdes-los-gobiernos-no-tienen-estrategias-para-reforestar/ [ Links ]
Avdan, U. y Jovanovska, G. (2016). Algorithm for Automated Mapping of Land Surface Temperature Using LANDSAT 8 Satellite Data. Journal of Sensors , 2016 , 1480307. https://doi.org/10.1155/2016/1480307 [ Links ]
Barrera Alarcón, I. G. (2018). Metodología de evaluación de la sostenibilidad urbana a partir del análisis de las características climáticas y del medio físico construido (Tesis Doctoral, Universitat Politècnica de Catalunya, Departament de Tecnologia de l’Arquitectura). Recuperado de http://hdl.handle.net/2117/118004 [ Links ]
BBC News. (2018, julio 24). Reality Check: Mapping the global heatwave. BBC News . Recuperado de https://www.bbc.com/news/world-44936622 [ Links ]
Benavides Meza, H. M. (1989). Bosque urbano: La importancia de su investigación y correcto manejo . Presentado en Memoria Congreso Forestal Mexicano, S.A.R.H., A.N.C.F. y Gobierno del Estado de México, 19-22 julio de 1989. [ Links ]
Bernal Grijalva, M. M., Navarro Navarro, L. A. y Moreno Vázquez, J. L. (2019). Adopción de especies nativas en la gestión de espacios verdes públicos sostenibles: El caso de Hermosillo. Frontera norte , 31 . http://dx.doi.org/10.33679/rfn.v1i1.2049 [ Links ]
BLM. (1999). Sampling vegetation attributes, Interagency technical reference . Recuperado de https://www.nrcs.usda.gov/Internet/FSE_DOCUMENTS/stelprdb1044175.pdf [ Links ]
Bokaie, M., Zarkesh, M. K., Araseth, P. D. y Hosseini, A. (2016). Assessment of Urban Heat Island based on the relationship between land surface temperature and Land Use/ Land Cover in Tehran. Sustainable Cities and Society , 23 , 94-104. https://doi.org/10.1016/j.scs.2016.03.009 [ Links ]
Boletín Oficial. (2014, octubre 1). Programa de Desarrollo Urbano del Centro de Población de Hermosillo, Modificación 2014. Tomo CXCIV Número 18, Sección II. Boletín Oficial Gobierno del Estado de Sonora . [ Links ]
Boletín Oficial. (2018a, septiembre 10). Programa de drenaje pluvial e infraestructura verde del centro de población de Hermosillo 2018, Tomo CCII, Número 24 Secc. III. Boletín Oficial Gobierno del Estado de Sonora . [ Links ]
Boletín Oficial. (2018b, septiembre 27). Norma técnica que establece las características y requerimientos para la infraestructura verde en el municipio de Hermosillo. Tomo CCII. Número 26 Secc. II. Boletín Oficial Gobierno del Estado de Sonora . [ Links ]
Bolund, P. y Hunhammar, S. (1999). Ecosystem services in urban areas. Ecological Economics , 29 (2), 293-301. https://doi.org/10.1016/S0921-8009(99)00013-0 [ Links ]
Búrquez Valenzuela, F. (2003). Tercer Informe 2000-2003 . Hermosillo: H. Ayuntamiento de Hermosillo. [ Links ]
Cai, H., He, Z., Yang, D. y Deng, H. (2014). Distribution and formation of the abnormal heat island in Guiyang, southwestern China. Journal of Applied Remote Sensing , 8 (1), 083637. https://doi.org/10.1117/1.JRS.8.083637 [ Links ]
Carlson, T. N. y Ripley, D. A. (1997). On the relation between NDVI, fractional vegetation cover, and leaf area index. Remote Sensing of Environment , 62 (3), 241-252. https://doi.org/10.1016/S0034-4257(97)00104-1 [ Links ]
Chakraborti, S., Banerjee, A., Sannigrahi, S., Pramanik, S., Maiti, A. y Jha, S. (2019). Assessing the dynamic relationship among land use pattern and land surface temperature: A spatial regression approach. Asian Geographer , 36 (2), 93-116. https://doi.org/10.1080/10225706.2019.1623054 [ Links ]
Chow, W. T. L., Brennan, D. y Brazel, A. J. (2011). Urban Heat Island Research in Phoenix, Arizona: Theoretical Contributions and Policy Applications. Bulletin of the American Meteorological Society , 93 (4), 517-530. https://doi.org/10.1175/BAMS-D-11-00011.1 [ Links ]
City of Yuma. (2019). Tree & Shade Master Plan 2020 . Recuperado de https://www.yumaaz.gov/documents/community-development/community-planning/Tree_&_Shade_Master_Plan_20191219_FINAL_WebVersion.pdf [ Links ]
Comisión Nacional del Agua (Conagua). (2018). Datos en archivos en hoja de cálculo (Excel) de las temperaturas máximas y mínimas del periodo 2000-2017 de la estación climatológica Observatorio en Hermosillo de la Comisión Nacional del Agua. [ Links ]
Comisión Nacional para el Conocimiento y Uso de la Biodiversidad (Conabio). (2020, marzo 2). Portal de Geoinformación 2020, Sistema Nacional de Información sobre Biodiversidad [SNIB]. Recuperado de http://www.conabio.gob.mx/informacion/gis/ [ Links ]
Comisión Técnico Consultiva para la Determinación de los Coeficientes de Agostadero (Cotecoca). (1986). Situación actual de los recursos forrajeros renovables y su potencial forrajero: Sonora (sin publicar) . México: Comisión Técnico Consultiva para la Determinación de los Coeficientes de Agostadero-Secretaría de Agricultura y Recursos, Hidráulicos. [ Links ]
Comrie, A. C. (2000). Mapping a Wind-Modified Urban Heat Island in Tucson, Arizona (with Comments on Integrating Research and Undergraduate Learning). Bulletin of the American Meteorological Society , 81 (10). [ Links ]
Congedo, L. (2013). Semi-automatic classification plugin for QGIS. Sapienza Univ , 1-25. [ Links ]
Costanzo, V., Evola, G. y Marletta, L. (2016). Energy savings in buildings or UHI mitigation? Comparison between green roofs and cool roofs. Energy and Buildings , 114 , 247-255. https://doi.org/10.1016/j.enbuild.2015.04.053 [ Links ]
Davey Resource Group. (2014). Phoenix, Arizona Project Area Community Forest Assessment . Recuperado de https://azsf.az.gov/sites/default/files/files/forestry/ucf/Desert-Canopy-Summary-Community-Forest-Assessment_Final_013015.pdf [ Links ]
Declet-Barreto, J., Brazel, A. J., Martin, C. A., Chow, W. T. L. y Harlan, S. L. (2013). Creating the park cool island in an inner-city neighborhood: Heat mitigation strategy for Phoenix, AZ. Urban Ecosystems , 16 (3), 617-635. https://doi.org/10.1007/s11252-012-0278-8 [ Links ]
Del Río Sánchez, M. D. (2006). III Informe de Gobierno 2003-2006 . Hermosillo, Sonora: Ayuntamiento de Hermosillo. [ Links ]
Diario Oficial de la Federación (DOF). (2017, abril 26). DECRETO por el que se crea el Consejo Nacional de la Agenda 2030 para el Desarrollo Sostenible , México. [ Links ]
DOF. (2018, agosto 13). Aviso de Término de la Emergencia Extraordinaria por la presencia de onda cálida ocurrida del 23 al 26 de julio de 2018 en 64 municipios del Estado de Sonora. Coordinación Nacional de Protección Civil, Secretaría de Gobernación. Diario Oficial de la Federación [DOF] . Recuperado de http://diariooficial.gob.mx/nota_detalle.php?codigo=5534557&fecha=13/08/2018 [ Links ]
El Imparcial. (2014, septiembre 10). Plagas de moscos y ratas agobian a los vecinos en la Primero Hermosillo . Recuperado de https://www.elimparcial.com/sonora/hermosillo/Plagas-de-moscos-y-ratas-agobian-a-los-vecinos-en-la-Primero-Hermosillo-20140910-0290.html [ Links ]
Endsley, K. A. (2018). 9.09-Remote Sensing of Socio-Ecological Dynamics in Urban Neighborhoods. En S. Liang (Ed.), Comprehensive Remote Sensing, (pp. 90-105). https://doi.org/10.1016/B978-0-12-409548-9.10436-1 [ Links ]
Fan, C., Myint, S. W., Kaplan, S., Middel, A., Zheng, B., Rahman, A., … Blumberg, D. G. (2017). Understanding the Impact of Urbanization on Surface Urban Heat Islands— A Longitudinal Analysis of the Oasis Effect in Subtropical Desert Cities. Remote Sensing , 9 (7), 672. https://doi.org/10.3390/rs9070672 [ Links ]
Felger, R. S., Johnson, M. B. y Wilson, M. F. (2001). The trees of Sonora, México . Inglaterra: Oxford University Press. [ Links ]
Gallo, K. P., Tarpley, J. D., McNab, A. L., y Karl, T. R. (1995). Assessment of urban heat islands: A satellite perspective. Atmospheric Research , 37 (1), 37-43. https://doi.org/10.1016/0169-8095(94)00066-M [ Links ]
Gándara Camou, E. (2009). III Informe de Gobierno 2006-2009 . Hermosillo: H. Ayuntamiento de Hermosillo. [ Links ]
Gándara Magaña, J. (2012). III Informe de Gobierno 2009-2012 . Hermosillo: H. Ayuntamiento de Hermosillo. [ Links ]
García-Cueto, O. R., Jáuregui Ostos, E., Toudert, D. y Tejeda-Martínez, A. (2007). Detection of the urban heat island in Mexicali, B. C., México and its relationship with land use. Atmósfera , 20 (2), 111-131. [ Links ]
Gartland, L. M. (2008). Heat Islands Understanding and Mitigating Heat in Urban Areas . Recuperado de https://doi.org/10.4324/9781849771559 [ Links ]
Georgakis, C. y Santamouris, M. (2017). Determination of the Surface and Canopy Urban Heat Island in Athens Central Zone Using Advanced Monitoring. Climate , 5 (4), 97. https://doi.org/10.3390/cli5040097 [ Links ]
González-Gómez, J. (2018). Mecanismos De Coordinación Para La Implementación Nacional De La Agenda 2030: Desafíos y Oportunidades Para México. Revista Buen Gobierno , Julio-diciembre (25), 1-17. Recuperado de http://revistabuengobierno.org/home/wp-content/uploads/2019/04/BG_25_4.pdf [ Links ]
Grimmond, C. S. B., Oke, T. R. y Cleugh, H. A. (1993). The role of" rural" in comparisons of observed suburban-rural flux differences. Int Assoc Hydrol Sci Pub , (212), 165-174. [ Links ]
Gunawardena, K. R., Wells, M. J. y Kershaw, T. (2017). Utilising green and bluespace to mitigate urban heat island intensity. Science of The Total Environment , 584-585 , 1040-1055. https://doi.org/10.1016/j.scitotenv.2017.01.158 [ Links ]
Haashemi, S., Weng, Q., Darvishi, A. y Alavipanah, S. K. (2016). Seasonal Variations of the Surface Urban Heat Island in a Semi-Arid City. Remote Sensing , 8 (4), 352. https://doi.org/10.3390/rs8040352 [ Links ]
Hao, X., Li, W. y Deng, H. (2016). The oasis effect and summer temperature rise in arid regions-Case study in Tarim Basin. Scientific Reports , 6 (1), 35418. https://doi.org/10.1038/srep35418 [ Links ]
Howard, L. (1833). The Climate of London: Deduced from Meteorological Observations Made in the Metropolis and at Various Places Around it, Volume 1 . London: Harvey and Darton. [ Links ]
Ibrahim, F. y Rasul, G. (2017). Urban Land Use Land Cover Changes and Their Effect on Land Surface Temperature: Case Study Using Dohuk City in the Kurdistan Region of Iraq. Climate , 5 (1), 13. https://doi.org/10.3390/cli5010013 [ Links ]
Inegi (2019). Decimocuarta Edición del Directorio Estadístico Nacional de Unidades Económicas (DENUE) Instituto Nacional de Estadística y Geografía. Versión interactiva. Recuperado de https://en.www.inegi.org.mx/app/mapa/denue/ [ Links ]
Inegi. (2010). Instituto Nacional de Estadística y Geografía. Marco Geoestadístico. Censo de Población y Vivienda. Recuperado de http://www.beta.inegi.org.mx/temas/mapas/mg/ [ Links ]
Inegi. (2015). Encuesta Intercensal 2015. Recuperado de https://www.inegi.org.mx/programas/intercensal/2015/ [ Links ]
Inegi. (2016). Inventario Nacional de Viviendas 2016, Información por Manzanas con datos actualizados al año 2010. México: Instituto Nacional de Estadística y Geografía. Recuperado de http://www.beta.inegi.org.mx/app/mapa/inv/ [ Links ]
Inegi. (2020). Biblioteca Digital de Mapas. Recuperado de https://www.inegi.org.mx/app/mapas/ [ Links ]
Instituto Nacional de Estadística y Geografía (Inegi). (1992). Carta de Climas escala 1:1,000,000 . Sonora, México. [ Links ]
Inzunza, A. (2019, agosto 1). El vivero municipal de Hermosillo regala más de 500 árboles al día. Proyecto Puente . Recuperado de https://proyectopuente.com.mx/video/el-vivero-municipal-de-hermosillo-regala-mas-de-500-plantas-al-dia/ [ Links ]
Kim, J.-I., Jun, M.-J., Yeo, C.-H., Kwon, K.-H. y Hyun, J. Y. (2019). The Effects of Land Use Zoning and Densification on Changes in Land Surface Temperature in Seoul. Sustainability , 11 (24), 7056. https://doi.org/10.3390/su11247056 [ Links ]
Kopinak, K. (1997). Desert Capitalism: What are the Maquiladoras? Canadá: Black Rose Books Ltd. [ Links ]
Lagarda Lagarda, I., Vázquez Landeros, M. y Noriega Nieblas, J. L. (2009). Hermosillo a través de los mapas. Hermosillo, Sonora: Instituto Municipal de Cultura y Arte. H. Ayuntamiento de Hermosillo (2006-2009). [ Links ]
Landsberg, H. (1981). The Urban Climate . Nueva York: Academic Press. [ Links ]
Loelkes Jr., G. L., Howard Jr., G. E., Schwertz Jr., E. I., Lampert, P. D., y Miller, S. W. (1983). Land use/land cover and environmental photointerpretation keys (Report N. o 1600). https://doi.org/10.3133/b1600 [ Links ]
López Caballero, A. (2015). III Informe de Gobierno 2012-2015 . Hermosillo: H. Ayuntamiento de Hermosillo. [ Links ]
López Cárdenas, C. T. (2019). Primer Informe 2019, El Rescate de Hermosillo . Hermosillo: H. Ayuntamiento de Hermosillo. [ Links ]
López Gómez, A., Fernández García, F., y Arroyo Llera, F. (1995). Teledetección y clima urbano. Variaciones nocturnas y diurnas de las islas de calor en Madrid . Madrid: Consejo Superior de Investigaciones Científicas. [ Links ]
López, J. (2018). Desbordan basura canales y arroyos de Hermosillo. El Imparcial . Recuperado de https://www.elimparcial.com/sonora/hermosillo/Desbordan-basura-canales-y-arroyos-de-Hermosillo-20180806-0115.html [ Links ]
Lozano, A. (2015, octubre 6). Preocupa a vecinos lagunas entre Quiroga y Paseo Río Sonora. El Imparcial . Recuperado de https://www.elimparcial.com/sonora/hermosillo/Preocupa-a-vecinos-lagunas-entre-Quiroga-y-Paseo-Rio-Sonora-20151006-0253.html [ Links ]
Manley, G. (1958). On the frequency of snowfall in metropolitan England. Quarterly Journal of the Royal Meteorological Society , 84 (359), 70-72. https://doi.org/10.1002/qj.49708435910 [ Links ]
Matson, M., Mcclain, E. P., McGinnis, D. F. y Pritchard, J. A. (1978). Satellite Detection of Urban Heat Islands. Monthly Weather Review , 106 (12), 1725-1734. https://doi.org/10.1175/1520-0493(1978)1062.0.CO;2 [ Links ]
McFeeters, S. K. (1996). The use of the Normalized Difference Water Index (NDWI) in the delineation of open water features. International Journal of Remote Sensing , 17 (7), 1425-1432. https://doi.org/10.1080/01431169608948714 [ Links ]
Mercado Maldonado, L., y Marincic Lovriha, I. (2017). Morfología de Isla de Calor Urbana en Hermosillo, Sonora y su Aporte hacia una Ciudad Sustentable. Biotecnia , 19 (0), 27-33. https://doi.org/10.18633/biotecnia.v19i0.407 [ Links ]
Mildrexler, D. J., Zhao, M. y Running, S. W. (2011). Satellite Finds Highest Land Skin Temperatures on Earth. Bulletin of the American Meteorological Society , 92 (7), 855-860. Recuperado de https://journals.ametsoc.org/doi/pdf/10.1175/2011BAMS3067.1 [ Links ]
Miller, R. W., Hauer, R. J. y Werner, L. P. (2015). Urban Forestry: Planning and Managing Urban Greenspaces . Long Grove, Illinois: Waveland press. [ Links ]
Morales, I. (1999). NAFTA: The institutionalisation of economic openness and the configuration of Mexican geo-economic spaces. T hird World Quarterly , 20 (5), 971-993. https://doi.org/10.1080/01436599913442 [ Links ]
Moran, P. A. P. (1950). Notes on Continuous Stochastic Phenomena. Biometrika , 37 (1/2), 17-23. https://doi.org/10.2307/2332142 [ Links ]
Muñoz Fernández, A. (2018). 3 Informe de Trabajo 2018 . Hermosillo: H. Ayuntamiento de Hermosillo. [ Links ]
National Weather Service. (2017). Phoenix & Yuma Climate Year in Review. Recuperado de https://www.weather.gov/psr/Year_in_Review_2017 [ Links ]
Navarro Navarro, L. A. y Moreno Vázquez, J. L. (2016). Cambios en el paisaje arbolado en Hermosillo: Escasez de agua y plantas nativas. región y sociedad , 28 (67). https://doi.org/10.22198/rys.2016.67.a194 [ Links ]
Navarro-Estupiñán, J., Robles Morua, A., Díaz Caravantes, R. y Vivoni, E. R. (2020). Heat risk mapping through spatial analysis of remotely-sensed data and socioeconomic vulnerability in Hermosillo, México. Urban Climate , 31 , 100576. https://doi.org/10.1016/j.uclim.2019.100576 [ Links ]
Navarro‐Estupiñán, J., Robles‐Morua, A., Vivoni, E. R., Zepeda, J. E., Montoya, J. A. y Verduzco, V. S. (2018). Observed trends and future projections of extreme heat events in Sonora, Mexico. International Journal of Climatology , 38 (14), 5168-5181. https://doi.org/10.1002/joc.5719 [ Links ]
Nobel, P. S. (1984). Extreme temperatures and thermal tolerances for seedlings of desert succulents. Oecologia , 62 (3), 310-317. https://doi.org/10.1007/BF00384262 [ Links ]
Nowak, D. J., Rowntree, R. A., McPherson, E. G., Sisinni, S. M., Kerkmann, E. R., y Stevens, J. C. (1996). Measuring and analyzing urban tree cover. Landscape and Urban Planning , 36 (1), 49-57. https://doi.org/10.1016/S0169-2046(96)00324-6 [ Links ]
Ojeda Revah, L., y Espejel, I. (2014). Introducción. En L. Ojeda Revah y I. Espejel (Coord.), Cuando las áreas verdes se transforman en paisajes urbanos: La visión de Baja California, (pp. 11-18). Tijuana: El Colegio de la Frontera Norte. [ Links ]
Oke, T. R. (1982). The energetic basis of the urban heat island. Quarterly Journal of the Royal Meteorological Society , 108 (455), 1-24. https://doi.org/10.1002/qj.49710845502 [ Links ]
Organización Panamericana de la Salud. (2012). Frontera de Estados Unidos y México. Salud en las Américas, Edición de 2012: Volumen de países . Recuperado de https://www.paho.org/salud-en-las-americas-2012/index.php?option=com_docman&view=download&alias=178-frontera-estados-unidos-mexico-178&category_slug=sa-2012-capitulos-pais-23&Itemid=231&lang=pt [ Links ]
Ortega-Rosas, C. I., Enciso-Miranda, C. A., Macías-Duarte, A., Morales-Romero, D. y Villarruel Sahagún, L. (2020). Urban vegetation cover correlates with environmental variables in a desert city: Insights of mitigation measures to climate change. Urban Ecosystems , 1-17. https://doi.org/10.1007/s11252-020-00982-8 [ Links ]
Peña Salmón, C. Á. (2011). Metodología para la planificación de áreas verdes urbanas: El caso de Mexicali, Baja California . Baja California, México: Universidad Autónoma de Baja California. [ Links ]
Peng, S., Piao, S., Ciais, P., Friedlingstein, P., Ottle, C., Bréon, F.-M., … Myneni, R. B. (2012). Surface Urban Heat Island Across 419 Global Big Cities. Environmental Science & Technology , 46 (2), 696-703. https://doi.org/10.1021/es2030438 [ Links ]
Pickett, S. T. A., Burch, W. R., Dalton, S. E., Foresman, T. W., Grove, J. M., y Rowntree, R. (1997). A conceptual framework for the study of human ecosystems in urban areas. Urban Ecosystems , 1 (4), 185-199. https://doi.org/10.1023/A:1018531712889 [ Links ]
QGIS Development Team. (2017). QGIS Development Team Quantum GIS vs 2.18. Open Source Geospatial Foundation Project. Recuperado de http://qgis.osgeo.org [ Links ]
Qiu, G., Li, H., Zhang, Q., Chen, W., Liang, X., y Li, X. (2013). Effects of Evapotranspiration on Mitigation of Urban Temperature by Vegetation and Urban Agriculture. Journal of Integrative Agriculture , 12 (8), 1307-1315. https://doi.org/10.1016/S2095-3119(13)60543-2 [ Links ]
Rao, P. K. (1972). Remote sensing of urban heat islands from an environmental satellite. Bulletin American Meteorological Society , 53 (7), 647-648. https://journals.ametsoc.org/doi/pdf/10.1175/1520-0477-53.7.646 [ Links ]
Roth, M., Oke, T. R., y Emery, W. J. (1989). Satellite-derived urban heat islands from three coastal cities and the utilization of such data in urban climatology. International Journal of Remote Sensing , 10 (11), 1699-1720. https://doi.org/10.1080/01431168908904002 [ Links ]
San Diego Regional Urban Forests Council (SDRUFC). (2020). Tree Canopy – San Diego Regional Urban Forests Council (SDRUFC). Urban Tree Canopy Assessment. Recuperado de http://sdrufc.com/treecanopy [ Links ]
Sánchez Dórame, D. (2014, junio 3). Hermosillo alcanza casi los 50 grados; rompe récord en el mundo. Excélsior . Recuperado de https://www.excelsior.com.mx/nacional/2014/06/03/963120 [ Links ]
Sanders, R. A. (1984). Some determinants of urban forest structure. Urban Ecology , 8 (1), 13-27. https://doi.org/ 10.1016/0304-4009(84)90004-4 [ Links ]
Schmid, J. A. (1975). Urban Vegetation: A Review and Chicago Case Study . EE. UU.: Department of Geography-University of Chicago. [ Links ]
Shreve, F., y Wiggins, I. L. (1964). Vegetation and Flora of the Sonoran Desert, Volume 1. United States of America: Stanford University Press. [ Links ]
Skoković, D., Sobrino, J. A., Jiménez-Muñoz, J. C., Sòria, G., Julien, Y., Mattar, C., y Cristóbal, J. (2014). Calibration and Validation of land surface temperature for Landsat8-TIRS sensor . Presentado en LPVE (Land Product Validation and Evolution, ESA/ESRIN Frascati (Italy), Frascati (Italy). Recuperado de https://earth.esa.int/documents/700255/2126408/ESA_Lpve_Sobrino_2014a.pdf [ Links ]
Smith, C. L., Webb, A., Levermore, G. J., Lindley, S. J., y Beswick, K. (2011). Fine-scale spatial temperature patterns across a UK conurbation. Climatic Change , 109 (3), 269-286. https://doi.org/10.1007/s10584-011-0021-0 [ Links ]
Sobrino, J. A., Jiménez-Muñoz, J. C., Soria, G., Romaguera, M., Guanter, L., Moreno, J., … Martinez, P. (2008). Land Surface Emissivity Retrieval From Different VNIR and TIR Sensors. IEEE Transactions on Geoscience and Remote Sensing , 46 (2), 316-327. https://doi.org/10.1109/TGRS.2007.904834 [ Links ]
Trubetskoy, S. (2016, diciembre 14). Mexico’s urban pileups. Recuperado de https://sashat.me/2016/12/14/mexicos-urban-pileups/ [ Links ]
Tucker, C. J. (1979). Red and photographic infrared linear combinations for monitoring vegetation. Remote Sensing of Environment , 8 , 127-150. https://doi.org/10.1016/0034-4257(79)90013-0 [ Links ]
United Nations. (2015). Sustainable Development Knowledge Platform. Recuperado de https://sustainabledevelopment.un.org/ [ Links ]
United Nations. (2018). World Urbanization Prospects: The 2018 Revision. Department of Economic and Social Affairs, Population Division. Recuperado de https://population.un.org/wup/DataQuery/ [ Links ]
Valencia Juillerat, J. E. (2000). Juntos Cambiamos a Hermosillo … Gracias, Tercer Informe de Gobierno 1997-2000 . Hermosillo: H. Ayuntamiento de Hermosillo. [ Links ]
Walker, J. S., y Briggs, J. M. (2007). An Object-oriented Approach to Urban Forest Mapping in Phoenix. Photogrammetric Engineering & Remote Sensing , May (5), 577-583. https://doi.org/10.14358/PERS.73.5.577 [ Links ]
Zha, Y., Gao, J., y Ni, S. (2003). Use of normalized difference built-up index in automatically mapping urban areas from TM imagery. International Journal of Remote Sensing , 24 (3), 583-594. https://doi.org/10.1080/01431160304987 [ Links ]
5It is an average as it is always associated to a measuring geographic scale, for example, a city subdivided into polygons or pixels with a certain spatial resolution.
10Some comparison tests were carried out with other methods. For example: the estimates were consistent with those obtained from the free-access platform called I-Tree, created by scientists with the US Forest Service, which includes the tool I-Tree Canopy.
11VC was almost entirely composed of urban forest, which is an endurable and stable UE element; in this way, the one-year difference between the images for the calculation of LST and VC (2016 and 2017, respectively) was negligible.
12 These are given values of B=2 and A=1, originally. In the regression, they are estimated as β 0 intercept and β 1 slope, respectively.
Received: March 02, 2020; Accepted: June 15, 2020
 Este es un artículo publicado en acceso abierto bajo una licencia Creative Commons
