


Servicios Personalizados
Revista
Articulo
 texto en
  Inglés (pdf)
 Artículo en XML
 Referencias del artículo
 Enviar artículo por email
Indicadores
-
 Citado por SciELO
 -
 Accesos
Links relacionados
-
 Similares en
SciELO
Similares en
SciELO
Compartir

 Permalink
Frontera norte
versión On-line ISSN 2594-0260versión impresa ISSN 0187-7372
Frontera norte vol.31 México 2019 Epub 05-Feb-2020
https://doi.org/10.33679/rfn.v1i1.2049
Article
Adopting Native Species for the Sustainable Management of Urban Green Areas: The Case of Hermosillo

1Colegio de Sonora, México, mbernal@colson.edu.mx , http://orcid.org/0000-0002-3825-8686
2Colegio de Sonora, México, lnavarro@colson.edu.mx , http://orcid.org/0000-0002-5819-9628
3Colegio de Sonora, México, jmoreno@colson.edu.mx , http://orcid.org/0000-0001-8770-434X
The relevance of the sustainable management of public green spaces (PGSs) has increased as a result of the global trend of urban growth, especially in arid and semi-arid cities where planners are faced with the challenge of maintaining or increasing plant cover (PC) without increasing water consumption. This study analyzed legal and administrative documents concerning the regulatory framework for PGS in the city of Hermosillo. In addition, the floristic composition and PC of a sample of PGSs (n = 112) was estimated and the impact of this framework was determined using a case study. Our results indicate that the afforestation pattern derived from the current regulatory framework is unsustainable, and it results in insufficient PC in green spaces. On average, exotic species accounted for 62% of the afforestation pattern and PC averaged 27%.
Keywords: public spaces; green areas; sustainability; Hermosillo; México
La tendencia mundial de crecimiento urbano hace de la gestión sostenible de Espacios Verdes Públicos (EVP) un tema importante, principalmente en ciudades áridas y semiáridas, donde el reto es mantener/incrementar la Cobertura Vegetal (CV) sin aumentar la demanda de agua. Este estudio hizo un análisis documental de textos jurídico- administrativos del marco regulatorio de gestión de EVP. Posteriormente, para conocer el impacto de éste, se estimó la composición florística y la CV de una muestra de EVP (n=112) en un estudio de caso. Se encontró que el marco regulatorio actual no fomenta un patrón de reforestación sostenible y una suficiente CV. En promedio, las especies exóticas representaron 62 por ciento del patrón de reforestación y la CV fue de 27 por ciento.
Palabras clave: espacio público; áreas verdes; sostenibilidad; Hermosillo; México
INTRODUCTION
Vegetation in urban areas, or the supply of nature4 within cities, has acquired greater importance and attention as people tend to leave the country to live in urban areas. This trend is in tune with the growing global trend toward urbanization. According World Bank data, urban population in Latin America and the Caribbean accounted for 49% of the total population in 1960, increasing to 80% by 2015. In Mexico, urban population represented just over 43% in 1950, increasing to 78% by 2010. According to the National Institute of Statistics and Geography ( Inegi, 2010 ), only 14% of the population of Sonora lives in rural areas.
The urbanization process has neglected the provision of green areas, and the deficit of public green spaces (PGS) in Latin American cities seems to be the rule rather than the exception. This issue is most critical in cities located in arid and semi-arid climates. In these cities, maintaining vegetation exerts strong pressure on water resources, although this often goes unnoticed. The demand for environmental services in urban ecosystems, for instance, the effect of shade on temperature and thermal comfort, is also very high in these places ( Hedquist & Brazel, 2014 ).
PGSs are a constant theme in the agenda of most decision-makers responsible for public affairs at the international and local levels. For example, the Sustainable Development Goals set by the United Nations as the goal for the year 2030 involve achieving socially fair access to green spaces and safe public venues. It is important that these PGSs provide the expected ecosystem services, be accessible to all people, and more importantly, be socially functional. Therefore, public policies need to be based on sustainable PGS management models.
The main argument in this article is that arid climate, low water availability, and a strong preference for exotic species introduced from tropical or temperate rainy climates, which are not adapted to the local environment, has resulted in PGSs lacking enough natural variety. In this paper, the adoption of ecological (xeric5 ) landscaping models is proposed as an option to reconcile two contradictory objectives: to maximize greenery in PGSs and to minimize maintenance costs, especially of irrigation water.
The present study analyzes the case of the city of Hermosillo, located in arid northwest Mexico, in the binational bioregion of the Sonora Desert. This city is representative of many others established in arid and semi-arid climates, and it offers multiple learning opportunities concerning the need to provide PGSs with sufficient vegetation while water is used rationally. In this study, we have:
Conducted a documentary analysis of the regulatory framework related to the design, construction, and maintenance of PGSs.
Identified and geographically located PGSs administrated by the municipal government; these spaces are known as plazas, parks, and public gardens.
Estimated vegetation cover, tree density, and afforestation patterns of these spaces.
The study adopted a multidisciplinary approach and applied floristic analyses to urban tree and forest measurements; in addition, public policies, statistics, and geographical data were analyzed based on a documentary review. The following hypotheses guided the present study:
There is no clear and defined public policy to promote a sustainable PGS management model; consequently:
The floristic composition was dominated by exotic or introduced species.
In addition to this afforestation pattern, the apparent scarcity of resources to maintain PGSs has contributed to insufficient plant cover.
The discussion is structured in different sections. Firstly, the case study is briefly described, emphasizing the aridity of the city and the unreliability of its water sources. Secondly, the concept of PGS is discussed, focusing on the vegetal component, namely, floristic composition and plant cover, from the perspective of ecological xeric landscaping. The third section describes the method used in the study, followed by the data and results analysis section, which is subdivided into two parts: documentary research results and results of the analysis of the green component in a sample of PGSs. Finally, conclusions and recommendations arising from the analyses are summarized.
THE CASE STUDY
The city of Hermosillo is located at 29° 04’ 30.24” N, 110° 57’ 32.17” W, in the state of Sonora (see Map 1 in the Methods section). The area, in the northwest corner of Mexico, is within the bioregion of the Sonoran Desert. According to Köppen’s classification, the climate in the region is type BWh (arid or very dry); its average annual precipitation and temperature are 356 mm and 25 ° C, respectively. According to data from National Water Comission, Conagua’s North Hermosillo Station obtained between 1961 and 2016 (key 26- 139), maximum temperatures of 40-41 °C are registered from June to September, and the hottest extreme temperature, 49.5 °C, was registered in June ( Sánchez, 2014 ); average potential evaporation is 2,602 mm.
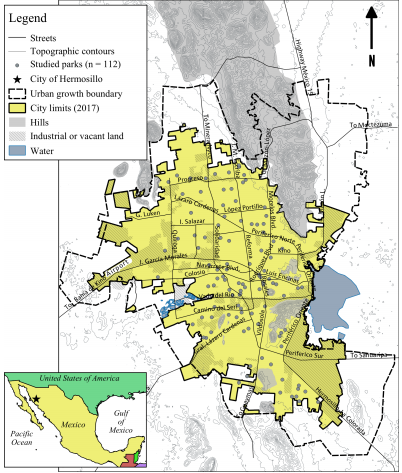
Source: Prepared by the authors based on data from the Hermosillo City Council (2014), Inegi (2013b), and photointerpretation of Google Earth (2016) images.
Map 1. Hermosillo City Polygon and Location of Studied Parks
According to the Intercensal Survey ( Inegi, 2015 ), the municipality of Hermosillo had 884,273 inhabitants. That same year, a growth rate of 2.7% was estimated for the city (State Population Council [COESPO], 2015 ) and national growth was estimated at 1.4% ( Inegi, 2015 ).
Although the city of Hermosillo has had a constant flow of water since 2013, this has not always been the case. According to Agua de Hermosillo, it was necessary to ration water (tandeos) in 2006 and during the period from 2010 to 2012. The city’s water resources are highly unstable due to the following reasons:
In 2017, 72.43% of the city’s total water supply came from underground sources;6 in addition, wells are often located on overexploited aquifers (Conagua, 2015a; 2015b).
The Abelardo L. Rodríguez dam, an important source of water for the city, has been nearly dry since 1998 (Navarro & Moreno, 2016; Romo, 2018).
Currently, 25% to 30% of the city’s supply depends on imported water from the Yaqui River basin, via the Acueducto Independencia.
Internal deficiencies in the operation of the municipal drinking water agency result in large amounts of water lost due to leaking (Salazar-Adams & Pineda-Pablos, 2010).
Although the city treats 100% of its wastewater, the possibility of using it for irrigation of urban green areas is limited. Only one public park uses treated water for irrigation;7 therefore, most of the green areas in the city compete for the use of drinking water with human users.
Public Green Spaces
Urban forests consist of trees, shrubs and associated herbaceous vegetation located within the boundaries of a city. It also includes lines of trees on sidewalks and median strips in streets and avenues, and in general, any type of assemblage of plants ( Benavides-Meza & Fernández-Grandizo, 2012 ) (graph 1). Together with streams and other water bodies, urban forests comprise what is known as the urban ecosystem or, as Bolund and Hunhammar (1999) put it, the green and blue spaces located within the urban area.

In the present study, the PGS was defined as a subtype of urban forest and a type of public space; it consists in public squares, parks, and gardens; most of the time, the municipal government is responsible for its administration and maintenance. Urbanistic terminology includes different terms to refer to these spaces; the Mexican regulatory system for urban recreational equipment prepared by the Secretariat of Social Development provides additional examples ( SEDESOL, 1999 ) (see table 1). Finally, a PGS must include three necessary components: vegetation, urban infrastructure, and public access. Although all three of these dimensions are important, this work focuses on the plant component of PGSs.
Table 1. Green Area Surface Suggested by SEDESOL (1999)
| Type | Green areas (%) | Minimum surface (m2) |
|---|---|---|
| Playground equipment | 22 | 1 250 |
| Neighborhood garden | 33 | 2 500 |
| Neighborhood park | 59 | 11 000 |
| City park | 91 | 91 000 |
Source: Adapted from SEDESOL (1999).
Vegetation: Green Cover
The term green area is a metaphorical expression that refers to the color of photosynthetically active vegetation, whether trees, shrubs, or grasses, in a given location. On the contrary, constructions, buildings, and infrastructure are referred to as gray infrastructure. The area of the vegetation layer that covers the soil in relation to the total area of the PGS is termed plant cover (PC).
Although the literature has not achieved consensus concerning the minimal proportion of PC for an area to be considered a PGS, it is expected to be sizable, since plants are responsible for many ecological functions that translate into urban ecosystem services (UES). Vegetation can improve the thermal sensation of outdoor locales as a result of evapotranspiration, and its shade reduces albedo values: trees can deflect between 75% and 90% of solar radiation (Kardinal-Jusuf & Nuyuk -Hien, 2016), increasing the comfort of the PGS. For instance, as early as 1975, the Chapultepec Forest in Mexico City was identified as a “cold island” of better air quality than the rest of the city ( Jáuregui-Ostos, 1975 ). Other UESs provided by the urban forest are carbon sequestration, rain delay, improvement of air quality and sound insulation.
Nowak et al. (1996) measured the urban forest tree cover in 58 cities in the United States, and their results ranged from 55% in Baton Rouge, Louisiana, to 0.4% in Lancaster, California; the authors conclude that the natural environment surrounding a city is the best predictor of its tree cover. For example, it varied from 0.4 to 26% in arid locations.8 The authors also found differences within each city as a function of land use; tree cover averaged 11.3% in urban parks located in arid areas and 47.6% in locations where the natural surroundings were forested.
For its part, SEDESOL (1999) describes a general architectural program for urban recreational areas in Mexico where the presence of PC is implicitly suggested. Although this program does not imply that the surface should be completely covered with vegetation, it refers to green areas, forests, or open areas (Table 1).
The percentage of PC and the social attractiveness of a PGS are not linearly associated. Attempts have been made to determine optimal tree density based on measurements of scenic beauty, security, and safety. For instance, Schroeder & Green (1985) found that the perception of scenic beauty in a park and the actual density of trees maintain an inverted-u relationship, that is, too few or too many trees result in unattractive landscapes. The optimal level was found to be between 150 and 160 mature trees per hectare, which is equivalent to 1.55 trees per 100 m2. In the case of cities such as Phoenix or Hermosillo, an average tree is estimated to have a crown radius of three meters, which means that 1.55 trees per 100 m2 represent 44% of PC.9
Sustainable PGS
The traditional urban landscape is usually dotted with green spaces including many exotic species, poorly adapted to the local climate, that require considerable maintenance, especially irrigation ( Spinti, Hilaire, & VanLeeuwen, 2004 ). An arid climate, low water availability, and a strong preference for non-native species introduced from rainy climates in tropical or temperate regions have resulted in a shortage of plant life in PGs. In Hermosillo, for instance, parks, plazas, and gardens are often places where a brownish-gray color predominates, and vegetation is scarce or inexistent ( Clemente-Marroquín, 2007 ). The intense solar radiation and absence of vegetation typical desert climates create the phenomenon known as urban heat islands, where the social function of this spaces is impossible due to the unattractive microclimate.
Clemente-Marroquín (2007) indicates that drought or water scarcity periods have drastic effects on public park maintenance in Hermosillo; a considerable amount of plants dries out and much additional work is required to keep irrigation systems running. Exotic species such as Ficus nitida, Ficus benjamina, and Grevillea robusta, among others, which are widely distributed in the city, are affected by diseases such as Texas root rot ( El Imparcial, 2014 ). Navarro and Moreno (2016) found that the arboreal landscape of the Hermosillo sidewalks was dominated by two non-native species: F. benjamina (45.34%) and black olive (Bucida buceras) (23.79%). The relationships among lack of vegetation, an insufficient water supply, and scarce use of local plant species has also been highlighted by Ojeda Revah and Álvarez (2000, p. 18) , who focused their study in Tijuana.
The preference for exotic species over native vegetation is not unique to the present case study. Raxworthy (2010) highlights how in Australia, an arid country where native vegetation has evolved mechanisms to cope with drought, inhabitants continue to adopt the European paradigm of a green landscape, which requires abundant water and is therefore unsustainable. A similar experience is described by Alam, Khattak, Ppoyil, Kurup, and Ksiksi (2017) concerning the United Arab Emirates. In all cases, cities are faced with the dilemma between favoring plant cover to maximize climate comfort or minimizing water use ( McPherson & Dougherty, 1989 ; Guhathakurta & Gober, 2007 ).
On the other hand, an ecological landscaping model has the potential to reconcile scarce resources for the maintenance of PGSs, especially irrigation water, with the demand for urban ecosystem services and people’s landscaping preferences ( Hitchmough & Dunnett, 2004 ). The first step in such direction would be to select plants adapted to the local temperature and water availability (rain and irrigation) ( Beck, 2013 ). On the other hand, xeriscape landscaping involves the design of gardens or PGSs that require little or no supplemental irrigation ( Tyman, 2011 ).
Thus, this approach considers non-native, alien, imported, introduced, or exotic species as inadequate for the local environment. Unwanted species are usually brought from mesic, temperate, or tropical environments; these species are adapted to humid conditions, and once established in the dry environment and high temperatures prevalent in cities such as Hermosillo, they require large amounts of water.
Strictly speaking, native plants are those among the species existing before the city engulfed the original environment, i.e., the natural vegetation one can find surrounding the city. Naturalized or introduced species and those that have become invasive are excluded from this category. For instance, the type of natural vegetation surrounding the city of Hermosillo was described by the Consultative Technical Commission for the Determination of Pastureland Coefficients ( COTECOCA, 1986 ) as arborescent scrub, a combination of medium-sized trees, shrubs, as well as some cacti. The local vegetation has also been classified as xerophilous scrub ( Rzedowski, 1990 ), xerophilous mesquite, sarcocaule (thick-stemmed) scrub, and desert microphyllum ( Inegi, 2013a ).
Water Demand for Urban Forests
Outdoor water consumption in single-family homes with landscaped spaces has been estimated at an average of 54.62% of the home’s total water consumption in arid and semi- arid cities in the United States southwest. A particular example of this consumption pattern is Tempe, Arizona, where 67.3% of the home’s water is consumed outdoor ( Western Resources Advocates, 2003, p. 63 ).
The large amounts of outdoor water consumed in arid and semiarid cities are reflected by the presence of water demand peaks during the summer. Johnson (1980) described a 124% increase in residential water demand in the city of Tucson during the month of July in comparison with the month of January. The same phenomenon was reported in Phoenix, where water demand in July was found to be more than twice as high as in February ( City of Phoenix, 2011 ). In the case of Hermosillo, the lowest monthly consumption levels occur in December whereas the highest occur in June, when demand is 30% higher.10
Most of the water consumed outdoors is assumed to be used for watering gardens. Sovocool (2005) took measurements before and after transforming a traditional garden into a xeriscape garden in Las Vegas and found that the changes resulted in 30% savings in annual water consumption for an area equivalent to a traditional lawn.11
Moll (1989) points out that cities such as Tucson, Arizona, face two major limitations to the development of urban vegetation: temperature and water. Native species have adaptive advantages over these limitations. For example, a mulberry tree (Morus spp.) can demand as much water as four paloverdes (Parkinsonia spp.) ( McPherson & Dougherty, 1989 ). This adaptive capacity can be observed in plants such as ironwood (Olneya tesota) ( Smith, Monson & Anderson, 1997, p. 73 ), littleleaf false tamarind (Lysiloma watsonii) ( Yetman, 2003, p. 203 ), and hopbush (Dodonaea viscosa), ( Felger, Johnson, & Wilson, 2001 ), which remain green in spite of the lack of water during the dry season.
Nevertheless, in cities such as Phoenix, xeriscaping fails to reduce temperature and increase people’s thermal comfort as in the case of mesic gardens with grass and exotic plants ( Chow & Brazel, 2012 ). As already mentioned, the adoption of native vegetation, available maintenance resources, and people’s landscaping preferences must be taken into account to achieve an optimal balance ( Hitchmough & Dunnett, 2004 ).
METHOD
The present study used both a quantitative and a qualitative strategy to accomplish its goals.
Quantitative Strategy
The unit of analysis was defined as the PGS, represented by individual parks and gardens administrated by the municipality. The Parks and Gardens Department of the municipality of Hermosillo provided a spreadsheet listing the city’s parks (updated to 2015), which were categorized as squares, rural locations, and boulevards. Only the category of squares was used in the present study; these venues totaled 669. The list included the name of the park, its location, and its area in square meters. The polygons of 590 squares were manually georeferenced and outlined based on this information and data from Google Earth.12
Determination of Plant Cover
A sample of 112 of the identified 590 squares was selected for analysis. Each of these polygons was photo-interpreted to differentiate masses of vegetation, gray infrastructure, and bare ground. Photo-interpretation consists in interpreting the features and characteristics of high-resolution satellite images based on shape, color, texture, pattern, association, and other a priori information that allows for the categorization of a geographical object (polygon, point, or line) within a pre-established class ( Loelkes, Howard, Schwertz, Lampert, & Miller, 1983 ). The analyst assigns a category and creates the object manually, simultaneously establishing its extension. PC was estimated as the quotient between the area photo-interpreted as vegetation and the total area of the PGS.
Floristic Composition
The number of trees in each PGS was counted with the help of experts, and each specimen was investigated using clues such as its common name and characteristic traits (size, color of flowers, fruits, etc.). Additionally, their genus, species, and families were determined to identify local species.
ANALYSIS OF DATA AND RESULTS PART I: REGULATORY FRAMEWORK
The current state of Hermosillo’s PGSs is the result of a public policy that has undermined both the quantity and quality of their green resources. Moreover, this situation has a negative effect on the general characteristics of the urban forest and the ecosystemic services it provides. The lack of sustainability of the city’s urban forest is expressed in a remark made by a landscaping entrepreneur: ‘...if the thousands of trees that we hear have been planted in Hermosillo had actually been planted, Hermosillo would be a jungle,’13 in reference to the preference for species not adapted to the Sonoran desert and the lack of monitoring and maintenance of afforested areas. Clearly, public efforts have failed to make the city any greener.14 Table 2 shows a summary of the laws and regulations affecting the PGSs in the city of Hermosillo, and the following paragraphs in this section provide a brief analysis of these laws.
Table 2. Laws, Regulations, and Norms Regulating PGSs
| Level | Name |
|---|---|
| Federal | General Law on Sustainable Forest Development. Diario Oficial de la Federación (DOF) June 5, 2018 |
| Federal | General Law of Ecological Balance and Environmental Protection (DOF January 28, 1988) |
| Federal | NOM 059 SEMARNAT 2010 |
| Federal | General Law of Human Settlements, Territorial Planning and Urban Development (DOF November 28, 2016) |
| Sonora | Law No. 254 on Territorial Planning and Urban Development of the State of Sonora published in Official Gazette (OG) No. 26, section IV, Volume CLXXVIII, dated September 28, 2006; Decree No. 149 of June 16, 2015 (BO No. 5, section I) |
| Sonora | Law No. 217 on Ecological Balance and Environmental Protection of the State of Sonora, (OG, No. 1, section I of January 3, 1991) |
| Sonora | Law for the Protection, Conservation and Promotion of Trees in Urban Areas of the State of Sonora (OG, August 8, 2016) |
| Sonora | Law for the Regulation of Joint Real Estate Ownership of the State of Sonora (BO, Volume CXCVIII, No. 49, section IV, December 19, 2016) |
| Hermosillo | Construction Regulations for the Municipality of Hermosillo (OG No. 6, section III of January 19, 2012) |
Source: Elaborated by the author based on documentary review.
a) International Recommendations
The city has adopted a norm of 9 m2 of green area per inhabitant. Reportedly, this volume is an international standard for PGSs recommended by the World Health Organization (WHO); however, we were unable to locate the original source where this recommendation was made, and how it was determined remains unknown. Noticing the same inconsistency, other authors have suggested that the parameter was never put forward by the WHO ( Henríquez-Ruíz, 2014 ; Huizar-Contreras & Ojeda Revah, 2014 ). However, multiple publications and different diagnoses ( Alanís-Flores, 2005 ; Jiménez-Pérez, Cuellar, & Treviño, 2013 ) focused on PGSs in cities around the world use the 9 m2 value as a reference ( OECD, 2017, p. 236 ; Mohapatra, 2016, p.12 ; Ros-Orta, 2013, p.31 ; Sorensen, Barzetti, & Williams, 1998, p.4 ).
In any case, the standard is difficult to implement due to different reasons. In the first place, it is not clear which spaces should be defined as green areas; in this regard, Rapoport and López-Moreno (1987, p.14) indicate that private urban gardens are often not included in green area calculations even though they represent an important amount of a city’s vegetation. A second issue is that the variables of even distribution and convenient access are seldom considered, despite that green areas should be no further than a 15-minute walk from potential users’ homes ( Sorensen, Barzettiy, & Williams, 1998 ). Finally, the standard says nothing about the quality of these spaces, for example, optimal PC or infrastructure and maintenance parameters or guidelines concerning social functionality.
Mexico has made international commitments related to green areas and urban ecosystems. For example, the 2011-2020 Strategic Plan for Biodiversity and Aichi Biodiversity Targets. Specifically, Target 14 concerns the safeguarding of ecosystems that provide essential services, considering that urbanization is, essentially, replacing a natural ecosystem with an urban ecosystem. The 2030 Agenda, adopted on September 25, 2015, established Sustainable Development Goal (SDG) 11 with the purpose of guaranteeing the safety, resilience, and sustainability of human cities and settlements. SDG 11.7 establishes the need for universal access to green areas and safe, inclusive, and accessible public spaces by 2030, particularly for women and children, the elderly, and the disabled. Explicit linkages between these international commitments and national, state, or local planning instruments are unavailable.
b) Federal Regulatory Framework
The General Law on Human Settlements, Territorial Zoning and Urban Development, a federal regulation, empowers states and municipalities to ensure an adequate balance between green areas and infrastructure construction based on national regulations on the subject (articles 75 and 76).
The creation of PGSs is concomitant with the urbanization process. The planning, design, and extension of these areas are firstly in charge of the developer or real estate developer, who must observe the relevant federal, state, and municipal regulatory frameworks. When urban areas grow at the expense of lands bearing natural vegetation and are part of the nation's forests, developers require authorization to change the land use, as described in the General Law on Sustainable Forest Development (article 93). A favorable decision concerning environmental impact, in accordance with the General Law of Ecological Equilibrium and Environmental Protection, must be obtained prior to this process. These authorizations are granted by a federal agency: the Semarnat.
It should be pointed out that Semarnat usually recommends or mandates the use of plant species present in the local geographical context for the afforestation of the green areas, boulevards, and median strips included in urban design, and it Promotes the rescue of species included in NOM 059-SEMARNAT-2010, which recommends making them available to the municipality. In addition, it suggests that the permanence of original vegetation should be privileged as much as possible.
Finally, SEDESOL (1999) elaborated a normative system for recreational areas that specifies the required architectural components, dimensions, service radius, and population to be benefited by the space. However, according to Huizar-Contreras (2012, p.23) , these recommendations are only guidelines, which means that their application is decided individually by the state or municipality.
c) State Regulatory Framework
In quantitative terms, state legislation determines the extent and, more recently, the possible PC of PGSs. For at least 30 years, from the Urban Development Law (February 18, 1985) to the Territorial Ordinance and Urban Development Law (September 28, 2006), which repealed it, until decree number 149 (July 16, 2015), which added and reformed the latter law, the policy was for the developer to donate 2% to 3% of salable area for parks and gardens.15
Decree number 149 amended the Law on Land Use Planning and Urban Development in favor of green areas via the following stipulations:
Article 27, section VI B, stipulates that green areas should be created in accordance with recommendations issued by the WHO in this regard.
Article 92, section IV, states the obligation of the municipal authority to receive and preserve green areas.
Several articles (96, 98, and 100) emphasize the use of natural, native, or adapted, non-introduced vegetation.
Article 103 stipulates that the donated area should be proportional to population density. As of 2015, all urban developments must donate 4.2 m2 per house for green areas; this area was required to increase by half a square meter per year until a maximum of 6.2 in 2019 for lots larger than 300 m2. These values are multiplied by 1.5.
For example, considering housing developments with a density of 50 houses per hectare, 125-133 m2 per lot, and an average density of 3.63 inhabitants per house, if 3% of the salable area was allocated to PGSs, the result was around 1.1 m2 per inhabitant. Given these minimum requirements, it was unlikely to meet the minimum WHO indicator unless the municipality built neighborhood parks to supplement the surface area donated by the developers, independently of its extension. On the other hand, the amendment to article 103, by decree number 149, fails to specify how the donation of green areas is proportional to population density. The 6.2 m2 per dwelling factor can be translated into a fixed 7% for 90 m2-dwellings, which would result in a PGS density below the WHO recommendation.
As explained above, the extension of PGSs is parallel to urbanization via donated areas or the construction of parks and gardens by the municipality. However, the recommended tree density for these spaces was never regulated. Recently, the state government approved the Law for the Protection, Conservation, and Development of Trees in Urban Areas in the State of Sonora, better known as “Ley Arbol.” Considering the specificity of this law in the matter of urban forest measurement, we decided to describe it and analyze it in detail in the following section.
Ley Árbol
This law is applicable to urban areas of more than 15 thousand inhabitants. As of the date of this article (August 2018), its relevant regulation had not been drafted and, to a certain extent, there was no evidence of its application. The law imposes a considerable administrative burden on municipalities to:
Develop a comprehensive management plan for urban trees.
Create a municipal urban tree system consisting of an inventory of all the trees located in public spaces.
Enforce the law, which includes carrying out inspections, authorizing pruning and felling, and creating a registry of technicians and decision-makers authorized to provide their services in the municipality.
Update regulations for construction and create a new regulation for green areas in accordance with this law.
One of the expected outcomes of this law is a tree catalog to guide the restitution of specimens in public spaces; in this regard, Article 46 establishes the preference for native and local species. It also calls for public and private plant nurseries to grow the species included in the catalog. These legislations open the opportunity to gradually change the current afforestation pattern in the city, which is dominated by exotic species ( Navarro & Moreno, 2016 ).
Citizens are imposed obligations such as:
Respecting the integrity of trees.
Reporting unauthorized pruning, felling, and transplanting activities.
Maintaining trees in their private property in good conditions, and fell them only after municipal authorization.
Watering the trees on the street closest to their home.
These obligations were not discussed with or communicated to the citizenry during the legislative process; therefore, the application of such obligations is expected to surprise many people.
In the case of urban developments, article 47 establishes a minimum of one one-year-old or two-meter high tree per house in sidewalks or green areas. As already mentioned, species must be selected from the tree catalog. Navarro and Moreno (2016) found an average of 5.27 trees per one hundred linear meters of curb (58% of samples had less than 5 trees). Considering 15 social interest houses (or eight residential houses) per 100 linear meters, the average represents less than one tree per house, therefore, observing this law would increase the number of trees in new urban developments.
d) Municipal Regulatory Framework
Article 115, section III, subsection g of the Mexican Federal Constitution, states that municipalities are in charge of parks and gardens. The state regulations described above are to be observed by the municipalities. The role of the municipality is subdivided into PGS planning, construction, maintenance, and species cataloging.
Planning
The Municipal Institute of Urban Planning of Hermosillo (IMPLAN) is a decentralized municipal agency whose purpose is to plan, regulate, and manage the territorial ordering of human settlements and urban development. Article 5, fraction XXVII of the IMPLAN creation agreement grants the agency the power to define the location of green areas, urban parks, and public gardens; it is also charged with the city’s afforestation plans, which must bear in mind the adequate proportion between green areas and housing buildings.
IMPLAN has a governing body tasked with the elaboration of an Urban Development Plan (UDP) to be approved by the city council. The latest UDP was published in 2014, and it included a land use and allocation map, in which PGSs appeared as green/sporting areas. Another category, conservation areas, were no more than areas of underbrush surrounded by or adjacent to urbanized areas.
The map was digitized by the authors to enable comparison with recent satellite images. The analysis of the map revealed that many of the polygons in the green/sporting area category include public offices, closed or abandoned locales, and many non-urbanized areas.16 The legal mechanisms to ensure that these sites be used as PGS and the forecasting criteria for such allocation are unclear. Therefore, the map was of no use to determine which PGSs are currently operating.
Construction
The design of the PGS is the responsibility of the developer. According to article 52 of the Construction Regulations for the Municipality of Hermosillo, the municipality must submit a detailed landscaping design plan for the PGSs to the General Coordination of Infrastructure, Urban Development and Ecology (CIDUE) of the municipality for approval.
PGS Maintenance and Inventory
PGSs are managed by CIDUE via the General Directorate of Urban Development and the Parks and Gardens Direction (PGD), which has a Tree Control Department (TCD). The purpose of these administrative areas is to provide conservation, maintenance, and afforestation services for public green areas, which are the responsibility of the municipality; they are also in charge of maintaining median strips in boulevards, planting trees, and irrigating. The TCD acquires and grows the trees planted in PGSs. Therefore, this government organism is partly responsible for deciding the species to plant.
In May 2016, the PGD was asked to inventory its green areas. The resulting list divided the city into four sectors and included the name of the green area, its surface, and its location. They were also classified into plazas, boulevards, and rural areas; since the latter were outside the polygon of the city, they were discarded from the analysis. Boulevards were not considered as PGS since most of them lack social infrastructure. The information provided by the PGD (summarized in Table 3), reveals that the area of PGS corresponding to plazas was 273 hectares, which represents 3.08 m2 per inhabitant.
Table 3. Green areas in the city of Hermosillo in charge of the PGD
| Sector | Plazas | Bulevar | Subtotals | ||||||
| QTY | Surface | Surface | QTY | Surface | Trees | QTY | Surface | Trees | |
| (m2) | (m2) | (m2) | |||||||
| Total | 669 | 2 730 709 | 27 056 | 130 | 944 847 | 17 458 | 799 | 3 675 556 | 44 514 |
Source: Prepared based on data from the Hermosillo PGD (2015).
QTY= Quantity.
Species Cataloging
As already mentioned, several articles (96, 98, and 100) of the Law on Land Use Planning and Urban Development stress the use of natural, native, or adapted non-introduced vegetation. Article 46 of the Ley Árbol stipulates the creation of a catalog of species.
Article 52 of the Construction Regulations for the Municipality of Hermosillo establishes that existing trees should be preferably preserved and that local species, adapted to the city’s climate, should be favored. The article presents a list of 16 recommended exotic tree species such as bitter orange, black olive, grevillea, nimtree (Azadirachta indica), kapok tree (Ceiba pentandra) and Yucatecan; 11 regional (native) species such as paloverde (Parkinsonia spp.), palo brea (Parkinsonia praecox), ironwood, mesquite, and tepeguaje; six palm species (one native); eight cactus species, and eight species of yucca and agave. Clearly, CIDUE has allowed for exotic species17 among the vegetation that can be planted in the city to accommodate the interests of real estate development projects.
PART II: STUDY OF THE GREEN COMPONENT
The regulatory framework described in the previous section has certainly influenced the design, quantity, and quality of the plant offer in PGSs. Although local species and species adapted to the local climate are often indicated as the adequate choice, many exotic trees are considered as “adapted” species by the construction regulation. This policy, or absence thereof, was evidenced by the information presented below.
Floristic Composition and Abundance of Species
To determine the extent to which the use of natural and non-introduced vegetation was observed in PGS, we analyzed a sample of 112 PGS distributed homogeneously throughout the city. A total of 6,065 trees belonging to 66 species were registered. Ten species represented around 85% of the afforestation pattern (Table 4). The average percentage of regional vegetation per PGS was 38; 21 different species were identified, 10 of which belonged to a single plant family—the Fabaceae (legumes)—and 10 species, despite being native, are adapted to riparian or more humid environments than those in the city, for example: uvalama (Vitex mollis), blackbead (Pithecellobium dulce), amapa (Unrelenting Tabebuia), west Indian elm (Guazuma ulmifolia) and desert willow (Chilopsis linearis). The most important native plants, either because of their abundance or their distribution, were mesquite, fan palm, tepeguaje, and blackbead.
Table 4. Most Abundant Registered Species (Percentage of Total Count)
| Common name | Genus and species | Origin | Abundance | Abundance |
|---|---|---|---|---|
| (%) | (categoría) | |||
| Black olive | Bucida buceras | India | 36.47 | Abundant |
| Mesquite | Prosopis spp. | Native | 16.99 | Scarce |
| Bitter orange | Citrus aurantium | Southeast Asia | 10.76 | |
| Fan palm | Washingtonia robusta | Native | 5.18 | Rare |
| Eucalyptus | Eucalipto spp. | Australia | 4.29 | |
| Nimtree | Azadirachta indica | Southeast Asia | 2.91 | |
| Pinguica | Ehretia tinifolia | India | 2.22 | |
| Tepeguaje | Lysiloma watsonii | Native | 2.07 | Very rare |
| Date palm | Phoenix dactylifera | Persian Gulf | 2.07 | |
| Kapok tree | Ceiba pentandra | South America | 2.01 | |
| Total | 84.97 |
Source: Prepared by the author based on field data (2017).
An aspect worth mentioning is that, although the spatial arrangement of the species in each PGS was not directly evaluated, it could be observed that native trees were mixed with exotic species. For example, mesquites were growing next to black olive trees, although the recommendations of xeric landscaping are to group trees according to their hydrological needs.
Index of Diversity
The afforestation pattern was dominated by a few species: 64% of the trees were black olives, mesquites, or bitter orange trees. Shannon’s H diversity index (Shannon & Weaver, 1949) was used to estimate the diversity of the landscape; this index determines the degree of diversity in a sample from a study area as compared to its potential diversity based on the overall pattern of species in the PGS universe (n = 112). This index ranges from a value of 0 in the case of a single-species afforestation pattern to 4.19 (natural logarithm of 66 for the case study) for a hypothetical case of maximum equitability where the 66 species were present in one PGS. On average, the studied parks had an index of 1.04, representing 25% of their potential diversity. It is important to mention that 17 of the 66 species were unique to single PGSs.
Frequency of Species
This indicator measures the presence or absence of a species in a given PGS. Therefore, it is a measure of the geographical distribution of the species in the city. In this regard, the best-distributed species were mesquite, black olive, and fan palm (Table 5).
Table 5. Registered Species Most Frequently Found In Parks
| Common name | Genus and species | Origin | Frequency (%) |
|---|---|---|---|
| Mesquite | Prosopis spp. | Native | 71.43 |
| Black olive | Bucida buceras | India | 69.64 |
| Fan palm | Washingtonia robusta | Native | 40.18 |
| Nimtree | Azadirachta indica | Southeast Asia | 32.14 |
| Bitter orange | Citrus aurantium | Southeast Asia | 30.36 |
| Blackbead | Pithecellobium dulce | Native | 27.68 |
| Yucateco | Ficus nitida | South Asia | 27.68 |
| Pinguica | Ehretia tinifolia | India | 25.89 |
| Flame tree | Delonix regia | Madagascar | 24.11 |
| Ficus tree | Ficus benjamina | India | 22.32 |
Source: Prepared by the author based on field data (2017).
The information obtained from the sample confirmed the second hypothesis, which states that the floristic composition of Hermosillo’s PGSs is dominated by exotic species. The diversity index is low, which suggests the predominance of a small number of species. These results are consistent with those found by Navarro and Moreno (2016), although they studied other components of the urban forest.
Plant Cover and Tree Density
The average area of the PGS sample was 5,850 m2 (range 145-94,708 m2); half of the sample had an area equal to or less than 2,154 m2. Mean PC was 27% (range 0-68%, graphic 2 ); it is important to mention that three of the PGS were completely devoid of plant cover. No statistically significant correlations were found among the variables of PC percentage, total PGS area, and total tree count. Tree density was 1.15 trees per 100 m2 (range 0 to 4.4).
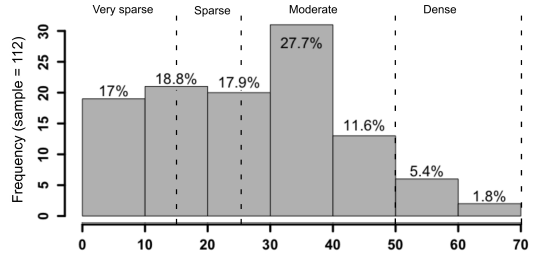
Source: Prepared by the author based on field data (2017).
Graphic 2. Distribution of Plant Cover Percentage in the Sample
For example, the park with the highest absolute count was Francisco I. Madero, with 1,439 trees (1.52 individual trees per 100 m2). This PGS is the oldest in the city; at the time of the present study, it was the only space receiving irrigation from treated water through a purple line, and its PC was 48%. On the other hand, the irrigation system of 87.50% of the studied PGSs used drinking water from the public grid and relied on drip irrigation, locally known as cajete, although it was not possible to verify whether the systems worked properly; moreover, the presence of this irrigation system was not significantly correlated with tree density or PC.
CONCLUSIONS AND RECOMMENDATIONS
This study focused on two very important components of the urban forest: parks and public squares. Our concept of public green space was based on three necessary conditions: public access to the space, the presence of vegetation, and the presence of services infrastructure or urban equipment. A geographical information system comprising 590 spaces that met such criteria and were run by the municipality was integrated using a list provided by the Municipality of Hermosillo. As noted by Clemente-Marroquín (2007) , a thorough census indicating the geographical location of all the PGSs in the city was unavailable. In addition, the information obtained from IMPLAN included many sites outside our criteria for PGS; therefore, the construction of an official database is work to be done in the future.
The first hypothesis in the present study claimed that the city lacked a clear and defined policy focused on the sustainable management of PGSs. The documentary analysis revealed that the norms concerning the supply of PGSs, in terms of quantity and quality, are fragmented and scattered in different legal and regulatory documents of international, national, state, and municipal competence. However, these guidelines and regulations are in conflict with widely accepted public policy objectives advocated by local politicians, such as the adoption of native species and species with low water requirements against the local preference for exotic species. The increase of PGS surface area in accordance with international standards is another conflicting issue.
The scattered nature of the current policy was reflected by the analyzed PGSs. Plant cover averaged 27%, which means that 73% of their surface area consists of gray infrastructure or bare ground. Moreover, PC was found to be between 0% and 20% in 36% of the spaces, and no correlation was found among PC, PGS size (area), and tree density. It was not possible to determine a minimum PC threshold for a PGS; however, in view of the extreme solar intensity and high temperatures characteristic of the city, the shade and thermal comfort provided by vegetation is considered an absolutely necessary component of these spaces. In this regard, and considering the values suggested by SEDESOL (1999) , PC was certainly insufficient in the PGSs considered in the present study, and the predominant landscape consists of bare soil and gray infrastructure.
The adoption of local plants is still modest: only 38% of the afforestation pattern corresponded to native species. The horizontal distribution of native species within each PGS was not estimated, but their spatial arrangement was observed to be random and mixed with exotic species.
The present study allows for lessons and recommendations that could be used in similar case studies. First, the matrix of available public space allocated to urban forest must be increased: current construction regulations leaves limited room for PGS. Second, physical space is not everything: it is important to reverse the current afforestation pattern concerning the relationship between local and exotic flora. Third, the use of native species does not entail the creation of brown-gray arid landscapes: xeriscaping techniques allow for the design of harmonious and scenically attractive environments, suitable for the city’s PGSs. Fourth, the diversity and PC of the city’s PGSs could be increased by intensifying the use of local plant species in addition to species capable of resisting the arid climate of the region. This strategy would significantly increase the provision of ecosystem services produced by these spaces. Fifth, it is necessary to create a multidisciplinary catalog of species (involving urban planners, landscape architects, ecologists, forest specialists, and public policy makers, among others) to reassess the Sonoran Desert landscape as a sustainable model for urban forests. The Ley Árbol, whose regulation remains unpublished and has failed to permeate to municipal regulations, provides an area of opportunity to create such a catalog, which would be ineffective if it not made mandatory and overseen at the municipal level. Sixth, despite the potential of ecological landscaping as a measure to reduce water consumption in the city, Hermosillo’s water operations agency has so far failed to include it among its portfolio of strategies to save water.
Finally, the provision of PGSs is unlikely to increase either in quantity or in quality, in compliance with international commitments concerning these spaces (such as the SDG established for 2030), as long as the current PGS management model continues to promote unsustainable traditional landscapes.
REFERENCES
Alam, H., Khattak, J. Z., Ppoyil, S. B., Kurup, S. S. and Ksiksi, T. S. (2017). Landscaping with native plants in the UAE: A review. Emirates Journal of Food and Agriculture, 29(10), 729-741. [ Links ]
Alanís-Flores, G. J. (2005). El arbolado urbano en el área metropolitana de Monterrey. Ciencia UANL, VIII (001), 20-32. [ Links ]
Beck, T. (2013). Principles of Ecological Landscape Design. Washington D. C.: Island Press. [ Links ]
Benavides-Meza H. M. y Fernández-Grandizo D. Y. (2012). Estructura del arbolado y caracterización dasométrica de la segunda sección del Bosque de Chapultepec. Madera bosques, 18(2), 51-71. [ Links ]
Bolund, P. and Hunhammar, S. (1999). Ecosystem services in urban areas. Ecological Economics, 29(2), 293-301. [ Links ]
Chow, W. T. and Brazel, A. J. (2012). Assessing xeriscaping as a sustainable heat island mitigation approach for a desert city. Building and Environment, 47(1), 170-181. [ Links ]
City of Phoenix. (2011). 2011 Water Resources Plan. City of Phoenix: Water Services Department. [ Links ]
Clemente-Marroquín, B. (2007). Los parques urbanos en Hermosillo de 1997 a 2007 ¿abandono o recuperación? (tesis de maestría). El Colegio de Sonora, Hermosillo. [ Links ]
Comisión Nacional del Agua (Conagua). (2015a). Actualización de la disponibilidad media anual del agua en el acuífero Costa De Hermosillo (2619), Estado de Sonora. Subdirección General Técnica, Gerencia de Aguas Subterráneas, Sugerencia de Evaluación y Ordenamiento de Acuíferos. Diario Oficial de la Federación, 20 de abril del 2015. [ Links ]
Comisión Nacional del Agua (Conagua). (2015b). Actualización de la disponibilidad media anual del agua en el acuífero Mesa del Seri-La Victoria (2621), Estado de Sonora. Subdirección General Técnica, Gerencia de Aguas Subterráneas, Sugerencia de Evaluación y Ordenamiento de Acuíferos. Diario Oficial de la Federación, 20 de abril del 2015. [ Links ]
Comisión Técnico Consultiva para la Determinación de los Coeficientes de Agostadero (COTECOCA). (1986). Situación actual de los recursos forrajeros renovables y su potencial forrajero: Sonora (sin publicar). Hermosillo, Sonora: Autor, Secretaría de Agricultura y Recursos, Hidráulicos. [ Links ]
Consejo Estatal de Población (Coespo). (2015). Indicadores de crecimiento demográfico y socioeconómico 2015. Recuperado de http://www.coespo.sonora.gob.mx/documentos/municipio/2015Hermosillo.pdf [ Links ]
Davey Resource Group (DRG). (2014). Phoenix, Arizona Project Area Community Forest Assessment. Prepared for the City of Phoenix and New Mexico State Forestry. [ Links ]
Dirección de Parques y Jardines (DPJ). (2015). Universo de áreas verdes 2015 por tipo y ubicación en el municipio de Hermosillo. Formato electrónico hoja de cálculo. Solicitud de información dirigida a: Enrique Duarte Ruelas, Director en Función de Parques y Jardines, H. Ayuntamiento de Hermosillo, ingresada el 31 de mayo de 2016. [ Links ]
El Imparcial. (6 de marzo de 2014). Mata “pudrición texana” a yucatecos. [ Links ]
Felger, R. S., Johnson, M. B. and Wilson, M. F. (2001). The trees of Sonora, México. Inglaterra: Oxford University Press. [ Links ]
Google Earth (2016). Hermosillo, Sonora, México. Ventana: xMin -111.085, y Min 28.9856, xMax -110.893, y Max 29.1808 (WGS84). Imágenes de Digital Globe de fechas: 5/16/2016 y 9/23/2016. Versión 7.1.7.2602 liberada 10/17/2016. Recuperado de https://www.google.com/earth/ [ Links ]
Guhathakurta, S. y Gober, P. (2007). The Impact of the Phoenix Urban Heat Island on Residential Water Use. Journal of the American Planning Association, 73(3), 317-329. [ Links ]
H. Ayuntamiento de Hermosillo (2014). Programa de Desarrollo Urbano del Centro de Población de Hermosillo, Modificación 2014. Boletín Oficial del Gobierno del Estado de Sonora: Tomo CXCIV Número 18, Sección II, septiembre. Hermosillo. Recuperado de http://www.boletinoficial.sonora.gob.mx/boletin/images/boletinesPdf/2014/septiembre/2014CXCIV18II.pdf [ Links ]
Hedquist, B. C. and Brazel, A. J. (2014). Seasonal variability of temperatures and outdoor human comfort in Phoenix, Arizona, USA. Building and Environment, 72, 377-388. [ Links ]
Henríquez-Ruíz, C. (2014). Modelando el crecimiento de ciudades medias: Hacia un desarrollo urbano sustentable. Chile: Ediciones UC. [ Links ]
Hitchmough, J. and Dunnett, N. (2004). Introduction to naturalistic planting in urban landscapes. En N. Dunnett y J. Hitchmough (Eds.), The Dynamic Landscape: Design, Ecology and Management of Naturalistic Urban Planting (pp. 1-32). Nueva York: Spon Press. [ Links ]
Huizar-Contreras, H. (2012). Evaluación de los parques de Tijuana desde un enfoque de justicia ambiental (tesis de maestría). El Colegio de la Frontera Norte, CICESE. Tijuana, B.C. [ Links ]
Huizar-Contreras, H. y Ojeda Revah, L. (2014). Una perspectiva de justicia ambiental: Tijuana. En L. Ojeda Revah e I. Espejel (Coords.), Cuando las áreas verdes se transforman en paisajes urbanos: La visión de Baja California (pp. 87-120). Tijuana: El Colef. [ Links ]
Instituto Nacional de Estadística y Geografía (Inegi). (2010). Volumen y crecimiento. Población total según tamaño de localidad para cada entidad federativa. Recuperado de http://cuentame.inegi.org.mx/poblacion/rur_urb.aspx?tema=P [ Links ]
Instituto Nacional de Estadística y Geografía (Inegi). (2013a). Conjunto de datos vectoriales de uso de suelo y vegetación escala 1:250 000, serie V (capa Unión), escala: 1:250000. edición: 2a. Aguascalientes: Autor. [ Links ]
Instituto Nacional de Estadística y Geografía (Inegi). (2013b). Marco Geoestadístico 2013, Versión 6.0. [ Links ]
Instituto Nacional de Estadística y Geografía (Inegi). (2015). Resultados definitivos de la Encuesta Intercensal 2015. Recuperado de http://www.inegi.org.mx/saladeprensa/boletines/2015/especiales/especiales2015_12_3.pdf [ Links ]
Jáuregui-Ostos, E. (1975). Microclima del Bosque de Chapultepec. Investigaciones geográficas, 1(6), 63-72. [ Links ]
Jiménez-Pérez, J., Cuéllar, G. y Treviño, E. (2013). Áreas verdes del municipio de Monterrey. Monterrey: Facultad de Ciencias Forestales de la UANL. [ Links ]
Johnson, R. B. (1980). Impacts of a New Water Resources Management Plan for Tucson, Arizona. Hydrology and Water Resources in Arizona and the Southwest, 10, 1-10. Recuperado de http://hdl.handle.net/10150/301226 [ Links ]
Kardinal-Jusuf, S. y Nuyuk-Hien, W. (2016). Valuing green spaces as a heat mitigation technique. En M. Santamouris and D. Kolokotsa (Eds.), Urban Climate Mitigation Techniques (pp. 41-66). Londres: Routledge. [ Links ]
Loelkes, G. L., Howard, G. E., Schwertz, E. L., Lampert, P. D. and Miller, S. W. (1983). Land Use/Land Cover and Environmental Photointerpretation Keys. U.S. Geological Survey Bulletin 1600. Recuperado de https://pubs.usgs.gov/bul/1600/report.pdf [ Links ]
McPherson, E. G. y Dougherty, E. (1989). Selecting trees for shade in the Southwest. Journal of Arboriculture, 15 (2), 35-43. [ Links ]
Mohapatra, B. (2016). Community Management of Urban Open Spaces in Developing Economies. Bingley, Inglaterra: Emerald Group Publishing. [ Links ]
Moll, G. (1989). In search of an Ecological Urban Landscape. En G. Moll y S. Ebenreck (Eds.), Shading Our Cities: A Resource Guide for Urban and Community Forests (pp. 13-24). Washington D.C.: Island Press. [ Links ]
Navarro, L. A. y Moreno, J. L. (2016). Cambios en el paisaje arbolado en Hermosillo: escasez de agua y plantas nativas. Región y Sociedad, 28(67), 79-120 [ Links ]
Nowak, D. J., Rowntree, R. A., McPherson, E. G., Sisinni, S. M. Kerkmann, E. R. and Stevens, J. C. (1996). Measuring and analyzing urban tree cover. Landscape and Urban Planning, 36(1), 49-57. [ Links ]
Ojeda Revah, L. y Álvarez, G. (2000). La reforestación de Tijuana, Baja California como un mecanismo de reducción de riesgos naturales. Estudios fronterizos, 1(2), 9-31. [ Links ]
Organización para la Cooperación y el Desarrollo Económicos (OECD). (2017). Environmental Performance Reviews: Korea 2017. París: Autor. [ Links ]
Peña-Salmón, C. A., Rojas-Caldelas, R. I., Arias-Vallejo, A. M. e Íñiguez-Ayón, Y. P. (2014). La gestión de parques urbanos: Mexicali. En L. Ojeda Revah e I. Espejel (Coords.), Cuando las áreas verdes se transforman en paisajes urbanos: La visión de Baja California (pp. 53-86). Tijuana, El Colef. [ Links ]
Rapoport, E. y López-Moreno, I. R. (1987). Aportes a la ecología urbana de la Ciudad de México. México: Editorial Limusa. [ Links ]
Raxworthy, J. (2010). Dryness: The aesthetic condition of landscape design in Australia. En O. Parodi (Ed.), Towards Resilient Water Landscapes: Design Research Approaches from Europe and Australia. Proceedings of the International Symposium on Water Landscapes at the University of New South Wales, Sydney, October 2009 (pp. 37-48). Alemania: KIT Scientific Publishing. [ Links ]
Romo, Y. (19 de julio de 2018). Sigue sequía en la presa Abelardo L. Rodríguez. El Sol de Hermosillo, p. 2 [ Links ]
Ros-Orta, S. (2013). Planificación y gestión integral de parques y jardines. Calidad, Sostenibilidad y PRL (2da. ed.). México: Mundi-Prensa Libros. [ Links ]
Rzedowski, J. (1990). Vegetación Potencial. IV.8.2. Atlas Nacional de México. Vol II. Escala 1:4000000. México: Instituto de Geografía, UNAM. [ Links ]
Salazar-Adams, A. y Pineda-Pablos, N. (2010). Escenarios de demanda y políticas para la administración del agua potable en México: el caso de Hermosillo, Sonora. Región y sociedad. 22(47), 105-122. [ Links ]
Sánchez, D. (3 de junio de 2014). Hermosillo alcanza casi los 50 grados; rompe récord en el mundo. Excélsior . Recuperado de https://www.excelsior.com.mx/nacional/2014/06/03/963120 [ Links ]
Schroeder, H. W. y Green, T. L. (1985). Public preference for tree density in municipal parks. Journal of Arboriculture, 11(9), 272-277. [ Links ]
Secretaría de Desarrollo Social (Sedesol). (1999). Sistema normativo de equipamiento urbano. Tomo V Recreación y deporte. Ciudad de México: Autor. [ Links ]
Shannon, C. E. y Weaver, W. (1949). The Mathematical Theory of Communication. Estados Unidos: University of Illinois Press. [ Links ]
Smith, S. D., Monson, R. K. and Anderson, J. E. (1997). Physiological Ecology of North American Desert Plants: with 86 figures and 21 tables. Alemania: Springer. [ Links ]
Sorensen, M., Barzetti, K. K. y Williams, J. (1998). Manejo de áreas verdes urbanas. Washington, D.C.: División de Medio Ambiente del Departamento de Desarrollo Sostenible del Banco Interamericano de Desarrollo. [ Links ]
Sovocool, K. A. (2005). Xeriscape Conversion Study Final Report. Estados Unidos: Southern Nevada Water Authority. [ Links ]
Spinti, J. E., Hilaire, R. S. and VanLeeuwen, D. (2004). Balancing Landscape Preferences and Water Conservation in a Desert Community. HortTechnology, 14(1) 72-77 [ Links ]
Tyman, S. (2011). Xeriscape. En K. Cohen y P. Robbins (Eds.), Green Cities: An A-to-Z Guide. Los Ángeles: Sage Publications. [ Links ]
Western Resource Advocates. (2003). Smart Water: A Comparison of Urban Water Use Efficiency Across the Southwest. Recuperado de https://www.waterboards.ca.gov/waterrights/water_issues/programs/hearings/cachuma/comments_rdeir/pacific_institute/4otherreports/wra_ch3smartwater2003.pdf [ Links ]
Yetman, D. (2003). The Guarijios of the Sierra Madre: Hidden People of Northwestern Mexico. Albuquerque: University of New Mexico Press. [ Links ]
5Xeriscape is an English term formed by two terms: “xeric,” or dry, and “scape,” or landscape. “Xeric landscaping” is a related term.
6Semi-structured interview with Specialized Assistant of Agua de Hermosillo’s Technical Management (August 16, 2018).
8PC in urban forests should not be confused with PGSs; the latter are expected to have less PC than urban forests.
9A study carried out in Phoenix, Arizona (Davey Resource Group, 2014) estimated that the city had 3,166,000 trees, representing 9% of PC for an area of 99,585,043 hectares. Calculations based on a circular canopy result in a radius of three meters. Applying the same procedure to the data obtained by the present study, we obtained the same value of three meters.
10Semi-structured interview with Specialized Assistant of Agua de Hermosillo’s Technical Management (August 16, 2018).
11This percentage represents 363.4 m3 of water per year. In Hermosillo, domestic water consumption usually ranges from 16 to 30 m3 per month.
12Photo-interpretation work was carried out from June to December 2016. According to Google Earth, available images were dated May, September, and November 2016.
13Miguel Cruz Ayala, Symposium on Landscaping in the Desert, organized by the private firm Árbol 2000 on November 22, 2014 in Hermosillo, Sonora.
14Municipal government records report a total of 353,888 planted trees, of various species, from 2003 to 2011.
15For example, Peña-Salmón, Rojas-Caldelas, Arias-Vallejo, and Íñiguez-Ayón (2014) point out that, in the case of the city of Mexicali, Baja California, at least 3% of the salable area of urban sprawls must be donated. Population density was not considered, which resulted in an unequal distribution of these spaces in the city.
16These sites classified as PGS can be viewed in Google Earth at the following geographic coordinates: National Forestry Commission (-110.924211, 29.076010), La Sauceda Park (-110.928147, 29.071637), and old landfill (-110.992079, 29.154573). The sites were visited (March 2018) to verify their land use.
17Huizar-Contreras and Ojeda (2014, p. 117) point out that, although the afforestation regulation for the municipality of Tijuana currently promotes the cultivation of native plants, the government has failed to encourage this initiative via a program aimed at supporting local producers.
Received: May 18, 2018; Accepted: September 27, 2018
 Este es un artículo publicado en acceso abierto bajo una licencia Creative Commons
