


Services on Demand
Journal
Article
 English (pdf)
 Article in xml format
 Article references
 Send this article by e-mail
Indicators
-
 Cited by SciELO
 -
 Access statistics
Related links
-
 Similars in
SciELO
Similars in
SciELO
Share

 Permalink
Frontera norte
On-line version ISSN 2594-0260Print version ISSN 0187-7372
Frontera norte vol.28 n.55 México Jan./Jun. 2016
Artículos
Cost and Relative Price Competitiveness of the Mexican Manufacturing Industry in the U.S. Market
Competitividad de costos y precios relativos de la industria manufacturera mexicana en el mercado estadounidense
Víctor Manuel Cuevas Ahumada
Universidad Autónoma Metropolitana, México. victorcuevasahumada@yahoo.com.mx.
Date of receipt: September 8, 2014.
Date of acceptance: April 11, 2015.
ABSTRACT
This research evaluates the long-term determinants of Mexican manufacturing competitiveness in the U.S. market. To perform this task, an International Competitiveness (IC) index is constructed and then a model is specified and estimated by using three different econometric methods. The empirical evidence across econometric techniques is consistent in indicating that IC is responsive to the peso-dollar real exchange rate, the yuan-dollar real exchange rate, labor productivity, wages, and the cost of credit. An important contribution of this paper is to show that manufacturing IC is influenced by the yuan-dollar real exchange rate and the real cost of credit.
Keywords: 1. international competitiveness, 2. manufacturing industry, 3. cointegration analysis, 4. Mexico, 5. United States.
RESUMEN
Esta investigación evalúa los determinantes a largo plazo de la competitividad de las manufacturas mexicanas en el mercado estadounidense. Para tal fin, se construye un índice de competitividad internacional (CI) y, posteriormente, se especifica y se estima un modelo mediante tres métodos econométricos. La evidencia sugiere que la CI responde a las siguientes variables: tipo de cambio real peso-dólar, tipo de cambio real yuan-dólar, productividad laboral, salarios y costo del crédito. Una contribución importante radica en demostrar que la CI manufacturera se ve afectada por el tipo de cambio real yuan-dólar y el costo real del crédito.
Palabras clave: 1. competitividad internacional, 2. industria manufacturera, 3. análisis de cointegración, 4. México, 5. Estados Unidos.
INTRODUCTION
This paper is aimed at evaluating the long-term determinants of Mexican manufacturing competitiveness in the U.S. market during the period January 2007-February 2014. To carry out this task, an International Competitiveness (IC) index is constructed. Such an index is based on the concept of market shares given that it assesses how fast Mexican manufacturing export volumes are growing vis-à-vis external demand, as measured by U.S. total manufacturing imports. After constructing such an IC index, we proceed to estimate its long-term responsiveness to a wide range of economic variables.
It is worth mentioning that the data set is necessarily limited due to significant changes in the coverage of official statistics for the Mexican manufacturing industry. As of January 2007, the National Institute of Statistics and Geography of Mexico (Inegi) widened the coverage of the data concerning the manufacturing industry, so as to include the maquiladora exporting firms. On the basis of the North American Industrial Classification System (NACIS) (U.S. Census Bureau, 2007), the new statistical series encompass 240 types of economic activity as opposed to the 205 types corresponding to the old statistical series. Therefore, the new data set cannot be matched with the old one to generate larger and more reliable samples.
Previous empirical evidence and economic theory were used as a basis for selecting the potential explanatory variables of the model. Furthermore, the long-term elasticities are estimated through the use of three econometric methods: Fully Modified Ordinary Least Squares (FMOLS), Canonical Cointegrating Regression (CCR), and Dynamic OLS (DOLS).1 The empirical evidence across econometric techniques is consistent in showing a long-term relationship between Mexico's manufacturing IC and the following key variables: the peso-dollar real exchange rate, the yuan-dollar real exchange rate, labor productivity, wages, and the cost of credit. This paper enriches the current empirical literature by providing long-term estimates concerning the effects of the yuan-dollar real exchange rate and the real cost of credit on Mexican manufacturing competitiveness in the U.S. market. To the best of our knowledge, there is a void to be filled in this regard.
The three long-term (or cointegrating) equations point to four important conclusions: First, a real depreciation of the peso weakens (rather than strengthens) IC as it increases the local currency cost of imported intermediate inputs, not to mention imported capital stock and technology. This finding contradicts previous empirical papers (Reinhart, 1995; Senhadji and Montenegro, 1999; Tellería, 2000; and Garcés, 2008) and reflects the excessive reliance of Mexican manufacturing enterprises on foreign suppliers of intermediate inputs. Second, a real depreciation of the yuan lowers the price of Chinese products in the U.S. market, which in turn reduces Mexican manufacturing IC. Therefore, Chinese exchange rate policy and the relative price of Chinese manufactures have a significant bearing on Mexico's export performance. Third, labor productivity has a positive impact on IC, which underlines the importance of investing more heavily in high-quality formal education and job-related training programs for the manufacturing industry. Finally, real wages and the cost of credit display a negative relationship with IC, highlighting the crucial role played by cost competition in the manufacturing sector.
This paper is organized as follows. Section 1 is a brief summary of the concept and most frequently used measures of IC. Section 2 is devoted to explaining the method used here to construct an IC index for the Mexican manufacturing sector. Section 3 provides an overview of the empirical literature in regard to the determinants of manufacturing export performance. Section 4 explains the model specification and the data set, and then performs the integration analysis. Section 5 carries out the cointegration tests and estimates the long-term elasticities by using three different econometric methods. Finally, as part of the conclusions, the main empirical findings and their policy implications are examined.
INTERNATIONAL COMPETITIVENESS: CONCEPTS AND MEASURES
Although the subject of IC has become increasingly important, scholars and institutions have not been able to reach a basic agreement on the meaning of the concept, the way to construct a general and consistent measure of IC, and the best set of government policies to effectively enhance IC. The lack of consensus regarding the concept of IC can be substantiated by analyzing a few representative authors. Boltho (1996) basically links IC with the real exchange rate, as relative prices and relative unit labor costs are highly dependent on the behavior of such a variable. Porter (1990) contradicts to some extent Boltho's purely macroeconomic view by stating that IC is closely related to total factor productivity and the myriad of microeconomic variables responsible for bringing about business success as well as economic growth. Schwab and Sala-i-Martín (2012:4) put forward a more comprehensive notion than the previous authors, maintaining that IC is "the set of institutions, policies, and factors that determine the level of productivity of a country." Finally, Delgado et al. (2012) refer to the "foundational competitiveness" of a country as the expected level of output per potential worker, as opposed to actual worker, which is supported by the country's macroeconomic policy, microeconomic environment, institutional arrangements, and social infrastructure.
Even though the concept of IC is still somewhat elusive, policymakers and academic scholars are increasingly aware that IC at the enterprise level depends on locational features such as government laws and regulations, the tax regime, and the quality and cost of production inputs such as labor and physical infrastructure. Therefore, proper policies and institutional reforms at the federal, state, and local level are of paramount importance to strengthen IC. This increasing awareness has led to a fruitful generation of IC indicators, such as:
1) The Global Competitiveness Index (GCI) developed by the World Economic Forum. The GCI is a weighted average index based on 113 indicators or subindices, which is published once a year. According to the 2013-2014 release, such an index was constructed for a total of 148 economies and Mexico was ranked 55th.
2) The World Competitiveness Index (WCI) constructed by the International Institute for Management Development. The WCI makes use of 337 criteria to establish the overall ranking of each of the 60 most important economies of the world. In the 2013 release, Mexico was 32nd.
3) The Competitive Industrial Performance (CIP) index formulated by the United Nations Industrial Development Organization. The CIP index is a weighted average of eight sub-indicators, designed to evaluate the industrial performance of 135 nations. In the 2012-2013 report, Mexico was 22nd.
In addition to these three renowned initiatives to gauge the competitiveness of a wide group of countries and establish their rankings, there are numerous unpublished IC reports and indicators generated by public and private organizations. Nonetheless, most of these indices are merely descriptive and cannot be used to perform an econometric analysis regarding the factors underpinning IC. Such a shortcoming, coupled with the aforementioned lack of theoretical consensus regarding the concept of IC, has led many authors to define and measure IC by way of a suitable proxy variable, namely a variable that captures a distinctive outcome of IC. For instance, Sachs, Porter, and Schwab (2002:16) refer to IC as the capability of a nation to achieve and sustain a high economic growth rate by means of sound economic policies and institutions, whereas Garelli (2006:3) defines it in terms of the country's ability to continuously generate value added through firms and people. Along these lines, Fouquin (1986) equates IC with the country's export participation in global markets while Nabi and Luthria (2002) and Cellini and Soci (2002), inter alia, emphasize that the ratio of domestic exports to rest-of-the-world imports represents a reasonably good measure of IC.
A MARKET-SHARE INDEX OF IC FOR MEXICAN MANUFACTURES
A salient feature of the Mexican manufacturing sector lies in its highly concentrated export structure. In fact, during the 2007-2013 period, 73.7 percent of Mexico's exports of manufactures went to the U.S.2 In such a context, the performance of the Mexican manufacturing industry in the U.S. market is a fairly good proxy for its overall export performance. The approach used here to assess manufacturing IC relies on the concept of market shares proposed by Fouquin (1986), Nabi and Luthria (2002) and Cellini and Soci (2002), among others, and takes advantage of the considerable weight of the U.S. in Mexican exports. Thus, we build an IC index capturing the dynamics of manufacturing exports vis-à-vis external demand, as measured by total U.S. manufacturing imports from the rest of the world. The index is built in five simple steps:
1) The real value of Mexican manufacturing exports to the U.S., denoted Xt , is obtained.
2) The real value of total U.S. manufacturing imports from the rest of the world, denoted Mt*, is calculated. This is the way we measure external demand as the U.S. is by far and away Mexico's main trading partner.
3) The ratio of first to the second variable is obtained (i.e., Xt/Mt*).
4) The previous quotient is re-expressed in natural logarithms (i.e., ln Xt- lnMt*).
5) The resulting logarithmic difference, ln Xt- lnMt*, is transformed into an index, with January 2007 equal to 100. Such an index will be symbolized by ICt .
In this manner, an increase in ICt indicates that Mexican manufacturing exports (Xt) are rising faster (or falling slower) than external demand (as measured by Mt*), which amounts to a higher penetration in the U.S. market. On the other hand, a decrease in ICt suggests that Mexico's manufacturing exports are growing slower (or declining faster) that external demand, which implies that Mexico is losing market share in the U.S. to third party competitors such as Canada and China or to domestic producers.
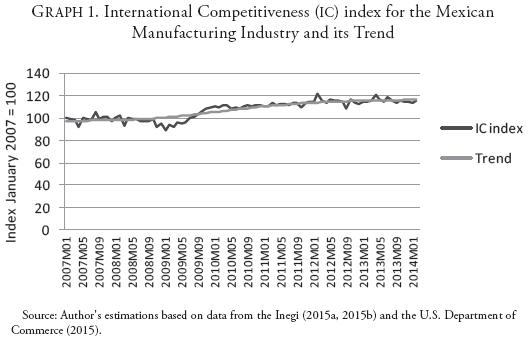
Graph 1 displays the IC index for the Mexican manufacturing sector (dark line) and its long-term trend (light line). The trend was obtained by the use of the Hodrick-Prescott filter (1997), which is a smoothing technique to estimate the long-run component of a time series. The light line shows that, on average, Mexican manufacturing IC has been increasing during the period January 2007-February 2014. In fact, the long-term trend increased by 19.16 units over this period, which essentially means that manufacturing exports have been growing at a moderately faster pace than external demand. As stated at the outset, we will use this index to carry out an empirical analysis regarding the determinants of manufacturing IC in the Mexican case. The baseline model is specified on the basis of economic theory and previous econometric evidence.
PREVIOUS ECONOMETRIC EVIDENCE
Given that our IC index measures how fast manufacturing exports to the U.S. are growing relative to external demand, it is quite reasonable to rely on the empirical literature concerning the short- and long-term drivers of export goods. Generally speaking, export models are specified under the following approaches: 1) gravity models of trade, 2) the augmented version of these models, 3) canonical demand models, and 4) mixed models combining demand- and supply-side variables. Under the classical gravity trade model, exports from one nation to another are positively related to their economic sizes and negatively related to transportation costs (Isard, 1954; Tinbergen, 1962; and Pöyhönen, 1963). The second strand of the literature is the one represented by Boisso and Ferrantino (1997), Bayoumi and Eichengreen (1997), and Bougheas, Demetriades, and Morgenroth (1999), inter alia, who incorporate variables such as common language, shared borders, and infrastructure, giving rise to the so-called augmented gravity model of trade. The explanatory power of this model is further improved by introducing variables such as prices, exchange rate, and exchange rate volatility, whose distinguishing feature is that they are basically unrelated to geography and space (Bergstrand, 1985; Summary, 1989; Wei, 1996; Soloaga and Winters, 2001; Martínez-Zarzoso and Nowak-Lehmann, 2002; and Rahman, Shadat, and Das, 2006).
According to the standard demand models, export volumes depend on the real exchange rate and the foreign level of income. Reinhart (1995), Senhadji and Montenegro (1999), Tellería (2000), and Garcés (2008) conclude that: 1) Economic activity abroad has a strong positive impact on exports, and 2) real currency depreciation raises IC and exports in developing countries through a favorable change in relative prices. Those papers, however, disregard or pay little attention to the fact that the real exchange rate affects IC and exports not only by changing relative prices, but also by altering relative unit labor costs and the domestic currency price of imported intermediate inputs, capital stock, and technology.
The dynamics of exports can also be explained by the so-called hybrid models, which combine demand- and supply-side variables. Riedel (1998) shows that omitting supply-side variables from export demand equations gives rise to miss-specifications errors and, therefore, biased parameter estimates. This influential paper motivated the formulation of a number of empirical models making use of not only demand- but also supply-side variables, such as wages and labor productivity. In the specific case of developing countries, Catão and Falsetti (2002), Mbaye and Golub (2002), and Aysan and Hacihasanoglu (2007) estimate the responsiveness of manufacturing exports to demand- and supply-side variables. On the supply side, the evidence suggests that manufacturing exports grow as unit labor costs fall. In a more detailed analysis, Aysan and Hacihasanoglu (2007) demonstrate that export performance is positively related to labor productivity and negatively related to real wages.
By the same token, Beck (2002), Gallagher, Moreno-Brid, and Porzecanski (2007), and Feenstra, Li, and Yu (2011) point out that the cost and availability of credit are major determinants of IC and the volume of exports in the short- and long-term. There is also evidence indicating that foreign direct investment (FDI) encourages exports in developing countries, given that they benefit from technology transfers and serve as a platform to export a great variety of goods to industrialized nations (Goldberg and Klein, 1997; UNCTAD, 2002; Pacheco-López, 2005; and Montobbio and Rampa, 2005).3 Last, many papers draw attention to the link between export volumes and technology-related variables, such as research and development (R&D) expenditure and the number of patents granted (Bhaduri and Ray, 2004; Montobbio and Rampa, 2005; Menji, 2010; and Neme and Valderrama, 2012).
MODEL SPECIFICATION, DATA SET, AND INTEGRATION ANALYSIS
The aim of this research is to estimate the long-term relationship between manufacturing IC and a set of explanatory variables, so as to formulate a few important policy recommendations. The selection of explanatory variables is based on previous empirical evidence and economic theory, but it is conditional upon the availability of monthly or at least quarterly data for the reference period (January 2007-February 2014). We face two specific data limitations: 1) beginning in January 2007, the National Institute of Statistics and Geography of Mexico widened the coverage of the statistical series for the manufacturing industry, meaning that the new data cannot be matched with old data to produce larger and more reliable samples, and 2) neither monthly nor quarterly data are available for technology-related variables such as R&D expenditure as a share of gross domestic product (GPD). In such a context, we specify a hybrid model including not only supply- and demand-side variables, but also two control variables to eliminate (or at least dampen) the effects of possible under-specification problems. We follow a general-to-specific model building process, which means departing from a large model and then perform a battery of tests to get rid of redundant variables and achieve a parsimonious final specification. The following IC function represents the departing model:

where:
ICt = International competitiveness index for the manufacturing industry;
QtMEX = Peso-dollar real exchange rate;4
QtCH = Yuan-dollar real exchange rate;5
vt = Labor productivity in the manufacturing industry;
Wt = Real average hourly wage in the manufacturing industry;
Rt = Cost of credit as measured by the real interest rate on 28-day government bonds (Cetes);
FDIt = Real Foreign Direct Investment in the manufacturing industry;
CUt = Percentage capacity utilization in the manufacturing industry;
Lt = Occupied workers in the manufacturing industry.
Note that equation 1 is based on previous empirical findings and economic theory, but includes only those variables for which monthly (or at least quarterly) data are available for the reference period.6 Percentage capacity utilization (ICt) and occupied workers (Lt) in the manufacturing industry play the role of control variables. Previous studies make use of these variables to deal with the so-called omitted-variable bias (Jiménez, Aguilar, and Kapsoli, 1998; Paiva, 2003; Athukorala and Suphachalasai, 2004; and Berrettoni and Castresana, 2007). For instance, capacity utilization is a good proxy for internal demand for exportable goods. Therefore, this variable can be useful in disentangling export market share expansions due to sudden declines in domestic consumption from those resulting from higher labor productivity, lower wages, interest rate cuts, and the like. This distinction is relevant given that an increase in export market share arising from lower-than-expected domestic demand cannot be associated with an IC enhancement. In contrast, labor productivity, wages, and interest rates are factors of IC and thus favorable changes in these variables can lead to legitimate increases in export market shares. On the other hand, the rationale for including occupied workers is that massive layoffs in the manufacturing sector are sometimes the byproduct of the introduction of new technology and equipment.
For each variable in Equation 1 we gathered monthly data from January 2007 to February 2014. In the particular case of FDI in the manufacturing industry, monthly data are unavailable, so quarterly data had to be used coupled with a frequency conversion method.7 In terms of data transformations, it is also important to stress that: 1) all variables are seasonally adjusted, and 2) with the exception of the real interest rate (Rt) and capacity utilization (Cut), which are merely expressed in percentages, all variables are measured by indices (with January 2007 equal to 100) and then stated in natural logarithms.8
Prior to performing the integration analysis, we provide a brief description of the variables initially considered in the data set. To accomplish this task, we calculate the average growth rate and the growth rate volatility for each variable over the sample period. The growth rate of each variable is computed on an inter-annual basis9 and, as a second step, the average growth rate is obtained. Moreover, the growth rate volatility is calculated through the use of variation coefficients, which are obtained in the following manner:

where EVCi denotes the estimated variation coefficient of the growth rate of variable i, Si stands for the sample standard deviation of the growth rate of variable i,  is the sample average growth rate of variable i, and N is the sample size. Therefore, is a normalization factor while (1+1/4N) is the small sample bias-correction factor developed by Sokal and Rohlf (1995). In this fashion, for a sample size N we obtain an unbiased and normalized measure of dispersion, which is useful for comparison purposes (Table 1):

According to Table 1, the average growth rate of manufacturing IC and labor productivity (vt) over the sample period is 2.72 and 1.19 percent, respectively. Moreover, if we examine the growth rate volatility of these two variables, the conclusion is that the growth in IC is not only higher but also more stable (i.e., less volatile). Real wages (Wt) and occupied workers (Lt) in the manufacturing sector grow at an average rate of 0.16 and 0.26 percent, respectively, but occupied workers exhibit a significantly higher volatility. This is indicative that salaries of workers tend to grow somewhat slower but at a much steadier pace than the employment level among them. The peso-dollar real exchange rate (QtMEX) tends to depreciate slightly with major variations, whereas the yuan-dollar real exchange rate (QtCH) tends to appreciate rapidly with minor variations. Put differently, exchange rate variations might have contributed to enhancing Mexico's IC in recent years. As to FDI in the manufacturing industry, we can observe a huge average rate of growth during the sample period, which is mainly due to the U.S. and global economic recovery. For instance, in the second quarter of 2013, FDI was more than ten times larger than in the second quarter of 2012. Nonetheless, the growth rate volatility of this variable is relatively small. It is also worth noting that: 1) the real interest rate (Rt) decreases at an accelerated and relatively stable rate, and 2) capacity utilization (CUt) displays a highly volatile behavior around a given value, since its rate of growth is close to zero while its estimated variation coefficient is extremely elevated.
The next step is to carry out unit root and stationarity tests to determine the order of integration of each variable. Two types of standard tests are undertaken: the Dickey-Fuller with Generalized Least Squares detrending developed by Elliott, Rothenberg, and Stock (DF-GLS, 1996), which is the most powerful version of the unit root tests, and the Kwiatkowski, Phillips, Schmidt, and Shin (KPSS, 1992), which is a stationarity test. As opposed to the unit root tests, the KPSS tests contrast the null hypothesis of stationarity against the alternative of unit root. To specify the test equations (i.e., to decide whether to include a constant, a constant and a linear trend, or none of the above), we resort to Hamilton's (1994:501) methodology. Such a method consists of choosing the specification that provides the best description of each time series, both under the unit root and the stationarity hypotheses. In case of doubt, the resulting test equations were also subjected to a battery of F- and t-type tests. Such tests are not conventional tests given that, in principle, we ignore whether each time series is stationary or not. In this manner, we made use of the critical values calculated by Dickey and Fuller (1981) and Dickey, Bell, and Miller (1986) for that specific purpose. Table 2 shows the outcome of the unit root and stationarity tests.10

Results in Table 2 indicate that six out of nine variables are clearly I(1) in levels and I(0) or stationary in first differences. Such variables are: and ICt, QtCH, vt, Wt, Rt, and Lt. FDIt in the manufacturing industry turned out to be stationary in levels, but in this particular case there was an information loss resulting from the use of a frequency conversion procedure. Therefore, to validate this result we take advantage of the fact that for this particular variable quarterly data are available for a relatively longer time interval: 1999-2013. Based on the whole sample period and omitting the frequency conversion procedure, both unit root and stationarity tests strongly indicate that this variable is in fact I(0) and, therefore, cannot be incorporated into the cointegration analysis.
Last, it is not infrequent that unit root and stationarity tests yield conflicting results and this is precisely the case for the remaining two variables: (QtMEX and CUt . In both cases, the DF-GLS tests suggest nonstationarity while the KPSS tests point to the conclusion of stationarity. In the case of QtMEX, the use of a larger time series (January 2000-February 2014) allowed us to conclude that this variable is in fact I(1) in levels. However, as stated before, in the case of CUt and many other variables specifically related to the manufacturing industry (such as vt, Wt and Lt) the new data set starting January 2007 cannot be matched with the old one to produce larger samples. Therefore, to reach a reasonable conclusion as to the order of integration of this variable (CUt), we resorted to the old data set and performed the same tests for the period January 1994-December 2006, which has the advantage of involving more observations. In this manner, we were able to establish that CUt is I(1) in levels. In summary, with the exception of FDIt, all the variables of the system are I(1) in levels and stationary in first differences.
COINTEGRATION ANALYSIS
In order to establish the existence of a long-term economic relationship between manufacturing IC and the other nonstationary variables in equation 1, two types of cointegration tests can be used: the multivariate cointegration tests proposed by Johansen (1995) and the single-equation tests developed by Engle and Granger (1987) and Phillips and Ouliaris (1990), among others. Although Johansen's testing procedure is very appealing, it was not feasible in this particular case. The explanation is that to perform Johansen cointegration tests we must first specify a pth-order Vector Auto-Regression (VAR) model in levels, where this model has to be congruent. Congruency is satisfied when the model residuals are serially uncorrelated, homoscedastic, and normally distributed. In this regard, it is worth mentioning that Johansen (1995:20) relaxes the last condition by saying that VAR residuals must not deviate too much from a multivariate normal distribution. Once congruency is achieved, we can proceed to reparameterize the pth-order VAR model in levels as a (p-1)th-order Vector Error-Correction (VEC) model and carry out the cointegration tests (Patterson, 2000:615). Unfortunately, in this case congruency cannot be attained regardless of the use of many different lag structures and information sets.11 Moreover, the use of "special effects" dummy variables as a means of improving residual behavior is not recommended here since it can alter the reliability of the Johansen cointegration tests.12
As an alternative course of action we make use of two different residual-based tests and then estimate the resulting cointegrating equations using three different econometric methods. The tests used here are the ones proposed by Engle and Granger (1987) and Phillips and Ouliaris (1990), whose common feature is that they attempt to determine whether the residuals of the cointegrating equation are stationary or not. If such residuals are stationary, then the variables involved share a long-term equilibrium relationship and vice versa. The basic difference between these two tests lies in the way of dealing with the presence of residual serial correlation in the test equation. The Engle-Granger test solves serial correlation through a parametric approach, whereas the Phillips-Ouliaris test does it through a nonparametric approach. Both tests are performed on the following cointegrating equation:

Two test statistics emerge from the Engle-Granger and Phillips-Ouliaris tests: the tau-statistics (τ-statistics) and the z-statistics. These test statistics happen to be sensitive not only to the assumptions made about intercepts and trends in the cointegrating regression, but also to the assumptions made about the stochastic process underlying the regressors of Equation 3. In this manner, the cointegrating equation must include a constant (b0 ) that plays the role of scale factor. On the other hand, the stochastic behavior of the explanatory variables in Equation 3 was subjected to a careful examination as part of the unit root and stationary testing, concluding that most variables include a constant and a linear trend. Table 3 displays the cointegration tests results.

The Engle-Granger and Phillips-Ouliaris tests are consistent in indicating that the variables in Equation 3 are cointegrated. In both cases the probability values for the null hypothesis of "no cointegration" are zero, which clearly leads to the conclusion that there is a long-term equilibrium relationship between IC and the other variables of the system.
The next step is to estimate the long-term elasticities by means of three different econometric methods: Fully Modified Ordinary Least Squares (FMOLS), Canonical Cointegrating Regression (CCR), and Dynamic OLS (DOLS). These three estimation procedures are useful in estimating long-run parameters but differ in the way of coping with the correlation between the cointegrating equation errors and the stochastic regressors innovations. To eradicate the effects of this correlation, the FMOLS estimator relies on a semi-parametric correction method (Phillips and Hansen, 1990), the CCR estimator performs stationary transformations of the data so as to make the usual least squares procedure appropriate (Park, 1992), and the DOLS estimator amplifies the cointegrating equation by including leads and lags of the regressors in first differences (Stock and Watson, 1993). Moreover, the number of leads and lags employed must be large enough to orthogonalize the error term of the cointegrating equation with respect to the stochastic regressors innovations. In summary, FMOLS, CCR, and DOLS account for endogeneity as well as serial correlation, giving rise to estimates that fulfill the following properties: 1) are asymptotically unbiased, 2) follow a blend normal distribution that is independent of non-scalar nuisance parameters, and 3) are adequate to perform asymptotic t- and Chi-square testing.
In must be emphasized, however, that the aforementioned asymptotic properties can only apply to long time series. Such a circumstance makes it relevant to study the small-sample properties of these three estimators. The most relevant papers in this regard are likely Inder (1993) and Montalvo (1995), who show that when working with small samples, 1) the DOLS estimator outperforms the CCR and FMOLS estimators in terms of efficiency and bias in the coefficient estimates, 2) the CCR estimator, in turn, outperforms the FMOLS estimator in these two respects (i.e., efficiency and bias in the parameter estimates), and 3) the DOLS estimator generates the most reliable t-statistics.
Table 4 reports the results of estimating Equation 3 by using three econometric methodologies: FMOLS, CCR, and DOLS. Therefore, three cointegrating equations are estimated. The empirical evidence across econometric techniques is consistent in indicating that, in the long run, IC is determined by the peso-dollar real exchange rate (QtMEX), the yuan-dollar real exchange rate (QtCH), labor productivity (vt), and the real cost of credit (Rt). Regardless of the estimation method employed, the parameter estimates associated with these variables are statistically significant and exhibit exactly the same sign. The coefficient estimate linked with real wages (Wt), on the other hand, achieves statistical significance only under the FMOLS and DOLS estimation methods but it displays the same sign in the three equations. As to the absolute magnitude of the parameter estimates, we can draw two basic conclusions: First, it is economically plausible under the three estimation procedures. Second, FMOLS and CCR yield basically the same outcome, but when applying DOLS the results change for some of the variables.

To carry out a careful interpretation of the empirical evidence, we shall use the DOLS regression model as our baseline model. As stated before, the DOLS estimator is the one with the most reliable performance when working with small samples. Thus, on the basis of the DOLS regression equation it can be concluded that: 1) A one-percentage-point depreciation of the peso-dollar real exchange rate lowers IC by 51 basis points, 2) a one-percentage-point real depreciation of the yuan vis-à-vis the US dollar reduces IC by 32 basis points, 3) a one-percentage-point increase in labor productivity raises IC by 108 basis points, 4) a one-percentage-point rise in real wages weakens IC by 45 basis points, and 5) a one-percentage-point escalation in the real cost of credit reduces IC by two basis points. Last, in every case the adjusted R2 reflects goodness of fit, the Durbin-Watson statistic suggests the absence of first-order serial correlation, the long-run variance is relatively small, and the Jarque-Bera probability value indicates that the regression residuals are normally distributed.
CONCLUSIONS AND ECONOMIC POLICY IMPLICATIONS
Some relevant economic policy implications can be drawn from the cointegration analysis. First, contrary to conventional economic theory and the dominant empirical literature, a real depreciation of the peso reduces manufacturing IC in the long run. A plausible interpretation of this finding is that real exchange rate depreciation generates two effects of opposite sign on manufacturing IC. On the demand side, it strengthens IC by lowering the price of Mexican manufactures in the U.S. market. On the supply side, however, real currency depreciation reduces manufacturing IC by raising the domestic currency cost of imported intermediate inputs, not to mention imported capital stock and technology. Given the marked reliance of Mexican manufactures on imported intermediate inputs, the negative effect of real currency depreciation prevails over the positive effect in the long term, so that manufacturing IC ultimately falls. Moreover, the high import content of Mexican manufacturing exports underlines the need to build and consolidate efficient production chains between large manufacturing enterprises and small- and medium-sized domestic suppliers of production inputs. Even in the face of pervasive processing trade, the successful implementation of this well-known policy prescription will to some extent raise both the domestic value added of manufacturing products and the job creation induced by exports.
Second, a real depreciation of the yuan vis-à-vis the U.S. dollar brings down the price of Chinese goods in the U.S. market which, in turn, weakens the IC of Mexican manufactures in the long term. The evidence suggests that the market share of the Mexican manufacturing sector in the U.S. can be significantly affected by Chinese exchange rate policy and, therefore, by the relative price of Chinese manufactures. In fact, the growing penetration of Chinese products in the U.S. market has given rise to justified concerns in national economic policy circles regarding whether, and if so to what extent, the yuan-dollar exchange rate may crowd out Mexican export performance.
The long-term coefficient estimates also indicate that an increase in labor productivity or a reduction in the real cost of credit will encourage the IC of Mexican manufactures. In such a context, an undervalued yuan could, to a certain degree, be offset by: 1) enhancing labor productivity faster than wages, thereby reducing unit labor costs, and 2) lowering the cost of short- and long-term financing in a broad sense, which essentially means bringing down real interest rates and removing financial constraints in the form of not only collateral obligations but also paperwork. These findings, in addition to the strong supply-side effect of a real depreciation of the peso, highlight the role played by cost competition in the Mexican manufacturing sector. More importantly, the impact of labor productivity on Mexican manufacturing IC reflects the need to invest more heavily in high-quality formal schooling education and job-related training. Dearden, Reed, and Van Reenen (2005), Padilla and Juárez (2007), and Mungaray and Ramírez (2007), among others, emphasize the linkage between human capital formation and productivity gains. In this manner, the Mexican government and all the relevant stakeholders (employers, workers, sector bodies, and training providers) must diagnose and fulfill not only general training needs in the manufacturing sector as a whole, but also specific training needs in every subsector and industry group in accordance with its technology and production requirements.
Finally, the long-term relationship between the real interest rates and the IC of the Mexican manufacturing sector points to another fundamental problem of the Mexican economy: the financial sector's oligopolistic structure coupled with relatively outmoded bankruptcy laws. Due to the lack of a well-developed financial system, credit flows to manufacturing firms (and to the private sector as a whole) are not only more expensive, but also more limited and delayed. The financial reform recently approved by the Mexican Congress should be undertaken so as to make credit flows cheaper and more easily available in the money and capital markets.
REFERENCES
Athukorala, Prema-chandra, and Suphat suphachalasai, 2004, "Post-Crisis Export Performance in Thailand," ASEAN Economic Bulletin, Pasir Panjang, Singapore, Institute of Southeast Asian Studies, Vol. 21, No. 1, pp. 19-36. [ Links ]
Aysan, Ahmet Faruk, and Yavuz Selim Hacihasanoglu, 2007, "Investigation on the Determinants of Turkish Export-Boom in 2000s," Germany, University Library of Munich (Munich Personal RePEc Archive Papers, No. 5493). [ Links ]
Bayoumi, Tamim, and Barry Eichengreen, 1997, "Is Regionalism Simply a Diversion? Evidence from the EC and EFTA," in Takatoshi Ito and Anne O. Krueger, eds., Regionalism versus Multilateral Trade Arrangements, Chicago, The University of Chicago Press, pp. 141-168. [ Links ]
Beck, Thorsten, 2002, "Financial Development and International Trade: Is there a Link?," Journal of International Economics, Elsevier, Vol. 57, No. 1, pp. 107-131. [ Links ]
Bergstrand, Jeffrey, 1985, "The Gravity Equation in International Trade: Some Microeconomic Foundations and Empirical Evidence," Review of Economics and Statistics, Massachusetts Institute of Technology Press Journals, Vol. 67, No. 3, pp. 474-481. [ Links ]
Berrettoni, Daniel, and Sebastián Castresana, 2007, "Exportaciones y tipo de cambio real: El caso de las manufacturas industriales argentinas," Revista de Comercio Exterior e Integración, Buenos Aires, Centro de Economía Internacional, No. 9, pp. 101-117. [ Links ]
Bhaduri, Saradindu, and Amit Shovon Ray, 2004, "Exporting through Technological Capability: Econometric Evidence from India's Pharmaceutical and Electrical/Electronics Firms," Oxford Development Studies, Routledge, Vol. 32, No. 1, pp. 87-100. [ Links ]
Boisso, Dale, and Michael Ferrantino, 1997, "Economic Distance, Cultural Distance, and Openness in International Trade: Empirical Puzzles," Journal of Economic Integration, Seoul, Center for Economic Integration, Vol. 12, No. 4, pp. 456-484. [ Links ]
Boltho, Andrea, 1996, "The Assessment: International Competitiveness," Oxford Review of Economic Policy, Oxford, Oxford University Press, Vol. 12, No. 13, pp. 1-16. [ Links ]
Bougheas, Spiros; Panicos O. Demetriades, and Edgar L. W. Morgenroth, 1999, "Infrastructure, Transport Costs and Trade," Journal of International Economics, Elsevier, Vol. 47, No. 1, pp. 169-189. [ Links ]
Catáo, Luis, and Elisabetta Falsetti, 2002, "Determinants of Argentina's External Trade," Journal of Applied Economics, Buenos Aires, CEMA University, Vol. 5, No. 1, pp. 19-57. [ Links ]
Cellini, Roberto, and Anna Soci, 2002, "Pop Competitiveness," BNL Quarterly Review, Rome, Banca Nazionale del Lavoro, Vol. 55, No. 220, pp. 71-101. [ Links ]
Dearden, Lorraine; Howard Reed, and John Van Reenen, 2005, "The Impact of Training on Productivity and Wages: Evidence from British Panel Data," London, Centre for Economic Performance (CEP Discussion Papers, No. 674). [ Links ]
Delgado, Mercedes; Christian Ketels, Michael Eugene Porter, and Scott Stern, 2012, "The Determinants of National Competitiveness," Cambridge, U.S., National Bureau of Economic Research (NBER Working Papers, No. 18249). [ Links ]
Dickey, David Alan, and Wayne Arthur Fuller, 1981, "Likelihood Ratio Statistics for Autoregressive Time Series with a Unit Root," Econometrica, Cleveland, The Econometric Society, Vol. 49, No. 4, pp. 1057-1072. [ Links ]
Dickey, David Alan; William R. Bell, and Robert B. Miller, 1986, "Unit Roots in Time Series Models: Tests and Implications," The American Statistician, Alexandria, United States, American Statistical Association, Vol. 40, No. 1, pp. 12-26. [ Links ]
Elliott, Graham; Thomas J. Rothenberg, and James H. Stock, 1996, "Efficient Tests for an Autoregressive Unit Root," Econometrica, Cleveland, The Econometric Society, Vol. 64, No. 4, July, pp. 813-836. [ Links ]
Engle, Robert Fry, and Clive William John Granger, 1987, "Co-integration and Error Correction: Representation, Estimation, and Testing," Econometrica, Cleveland, The Econometric Society, Vol. 55, No. 2, March, pp. 251-276. [ Links ]
Feenstra, Robert Christopher; Zhiyuan Li, and Miaojie Yu, 2011, "Exports and Credit Constraints under Incomplete Information: Theory and Evidence from China," Cambridge, United States, National Bureau of Economic Research (NBER Working Papers, No. 16940). [ Links ]
Fouquin, Michel, 1986, Industrie mondiale: La compétitivité à tout prix, Paris, CEPII Press. [ Links ]
Gallagher, Kevin; Juan Carlos Moreno-Brid, and Roberto Porzecanski, 2007, "The Dynamism of Mexican Exports: Lost in (Chinese) Translation?," World Development, Vol. 36, No. 8, pp. 1365-1380. [ Links ]
Garcés Díaz, Daniel Guillermo, 2008, "Análisis de las funciones de importación y exportación de México (1980-2000)," El Trimestre Económico, Fondo de Cultura Económica, Vol. LXXV, No. 297, January-March, pp. 109-141. [ Links ]
Garelli, Stéphane, 2006, Top Class Competitors: How Nations, Firms and Individuals Succeed in the New World of Competitiveness, West Sussex, United Kingdom, Wiley and Sons. [ Links ]
Goldberg, Linda, and Michael W. Klein, 1997, "Foreign Direct Investment, Trade and Real Exchange Rate Linkages in Southeast Asia and Latin America," Cambridge, United States, National Bureau of Economic Research (NBER Working Papers, No. 6344). [ Links ]
Hamilton, James Douglas, 1994, Time Series Analysis, Princeton, Princeton University Press. [ Links ]
Hodrick, Robert James, and Edward Christian Prescott, 1997, "Postwar U.S. Business Cycles: An Empirical Investigation," Journal of Money, Credit and Banking, Wiley, Vol. 29, No 1, February, pp. 1-16. [ Links ]
Inder, Brett, 1993, "Estimating Long-Run Relationships in Economics: A Comparison of Different Approaches," Journal of Econometrics, Elsevier, Vol. 57, No. 1-3, pp. 53-68. [ Links ]
Isard, Walter, 1954, "Location Theory and Trade Theory: Short-Run Analysis," Quarterly Journal of Economics, Oxford, Oxford University Press, Vol. 68, No. 2, May, pp. 305-320. [ Links ]
Jiménez, Félix; Giovanna Aguilar, and Javier Kapsoli, 1998, "Competitividad en la industria manufacturera peruana, 1985-1995," Lima, Pontificia Universidad Católica del Perú (Documento de Investigación del Departamento de Economía, No. 148). [ Links ]
Johansen, Soren, 1995, Likelihood-Based Inference in Cointegrated Vector Autoregressive Models, Oxford, Oxford University Press. [ Links ]
Kwiatkowski, Denis; Peter Phillips, Peter Schmidt, and Yongcheol Shin, 1992, "Testing the Null Hypothesis of Stationarity against the Alternative of a Unit Root," Journal of Econometrics, Elsevier, Vol. 54 , No. 1, pp. 159-178. [ Links ]
Mackinnon, James, 1996, "Numerical Distribution Functions for Unit Root and Cointegration Tests," Journal of Applied Econometrics, Wiley, Vol. 11, No. 6, November, pp. 601-618. [ Links ]
Martínez-Zarzoso Inmaculada, and Felicitas Nowak-Lehmann, 2002, "Augmented Gravity Model: An Empirical Application to Mercosur-European Union Trade Flows," Journal of Applied Economics, Wiley, Vol. VI, No. 2, November, pp. 291-316. [ Links ]
Mbaye, Ahmadou Aly, and Stephen Golub, 2002, "Unit Labour Cost, International Competitiveness, and Exports: The Case of Senegal," Journal of African Economies, Oxford, Oxford University Press, Vol. 11, No. 2, pp. 219-248. [ Links ]
Menji, Sisay, 2010, Export Performance and Determinants in Ethiopia, Munich (Munich Personal RePEc Archive Paper, No. 29427). [ Links ]
Mexican Ministry of Economy, 2015, "Estadística oficial de los flujos de IED hacia México," available at <http://www.economia.gob.mx/comunidad-negocios/competitividad-normatividad/inversion-extranjera-directa/estadistica-oficial-de-ied-en-mexico>, last accessed on September 8, 2015. [ Links ]
Montalvo, José, 1995, "Comparing Cointegrating Regression Estimators: Some Additional Monte Carlo Results," Economics Letters, Elsevier, Vol. 48, No. 3-4, June, pp. 229-234. [ Links ]
Montobbio, Fabio, and Francesco Rampa, 2005, "The Impact of Technology and Structural Change on Export Performance in Nine Developing Countries," World Development, Elsevier, Vol. 33, No. 4, pp. 527-547. [ Links ]
Mungaray, Alejandro, and Martín Ramírez-Urquidy, 2007, "Capital humano y productividad en microempresas," Investigación Económica, Facultad de Economía-UNAM, Vol. 66, No. 260, pp. 81-115. [ Links ]
Nabi, Ijaz, and Manjula Luthria, 2002, "Building Competitiveness: A Roadmap and Policy Guide," in Ijaz Nabi and Manjula Luthria, eds., Building Competitive Firms: Incentives and Capabilities, Washington, D.C., The World Bank, pp. 1-28. [ Links ]
National Institute of Statistics and Geography of Mexico (INEGI), 2015a, "Banco de Información Económica (BIE)," Mexico, available at <http://www.inegi.org.mx/sistemas/bie/>, last accessed on September 7, 2015. [ Links ]
National Institute of Statistics and Geography of Mexico (INEGI), 2015b, "Encuesta mensual de la industria manufacturera (EMIM)," Mexico, available at <http://www.inegi.org.mx/prod_serv/contenidos/espanol/bvinegi/productos/encuestas/establecimientos/indus_manu/emin_scian/emin.pdf>, last accessed on September 7, 2015. [ Links ]
Neme, Omar, and Ana Valderrama, 2012, "El ajuste de las exportaciones mexicanas: Implicaciones de política comercial," Perspectivas, Facultad de Economía, Universidad Autónoma de San Luis Potosí, Vol. 6, No. 1, pp. 3-32. [ Links ]
Pacheco-López, Penélope, 2005, "Foreign Direct Investment, Exports and Imports in Mexico," The World Economy, Wiley, Vol. 28, No. 8, August, pp. 1157-1172. [ Links ]
Padilla, Ramón, and Miriam Juárez, 2007, "Efectos de la capacitación en la competitividad de la industria manufacturera," Revista de la CEPAL, United Nations, Vol. 92, August, pp. 45-60. [ Links ]
Paiva, Claudio, 2003, "Trade Elasticities and Market Expectations in Brazil," Washington, D.C., International Monetary Fund (IMF Working Paper, No. 03/140). [ Links ]
Park, Joon, 1992, "Canonical Cointegrating Regressions," Econometrica, Cleveland, The Econometric Society, Vol. 60, No. 1, January, pp. 119-143. [ Links ]
Patterson, Kerry, 2000, An Introduction to Applied Econometrics: A Time Series Approach, New York, Palgrave MacMillan. [ Links ]
Phillips, Peter C. B., and Bruce E. Hansen, 1990, "Statistical Inference in Instrumental Variables Regression with I(1) Processes," Review of Economic Studies, Oxford, Oxford University Press, Vol. 57, No. 1, pp. 99-125. [ Links ]
Phillips, Peter C. B, and Sam Ouliaris, 1990, "Asymptotic Properties of Residual Based Tests for Cointegration," Econometrica, Cleveland, The Econometric Society, Vol. 58, No. 1, January, pp. 165-193. [ Links ]
Porter, Michael Eugene, 1990, The Competitive Advantage of Nations, London, Macmillan. [ Links ]
Porter, Michael Eugene, Jeffrey Sachs, and Klaus Schwab, 2002, The Global Competitiveness Report 2001-2002, New York/Oxford, World Economic Forum/Center for International Development-Harvard University/Oxford University Press. [ Links ]
Pöyhönen, Pentti, 1963, "A Tentative Model for the Volume of Trade between Countries," Review of World Economics, Kiel, Germany, Vol. 90, No. 1, pp. 93-100. [ Links ]
Rahman, Mustafizur; Wasel Bin Shadat, and Narayan Chandra Das, 2006, Trade Potential in SAFTA: An Application of the Augmented Gravity Model, Dhaka, Center for Policy Dialogue (CPD Occasional Paper Series, No. 61). [ Links ]
Reinhart, Carmen, 1995, "Devaluation, Relative Prices, and International Trade: Evidence from Developing Countries," IMF Staff Papers, Vol. 42, No. 2, pp. 290-312. [ Links ]
Riedel, James, 1988, "The Demand for LDC Exports of Manufactures: Estimates from Hong Kong," The Economic Journal, Royal Economic Society, Vol. 98, No. 389, pp. 138-148. [ Links ]
Sachs, Jeffrey; Michael Porter, and Klaus Schwab, 1992, The Global Competitiveness Report 2001-2002, New York, Oxford University Press. [ Links ]
Schwab, Klaus, and Xavier Sala-i-Martín, 2012, Insight Report: The Global Competitiveness Report 2012-2013, Geneva, World Economic Forum. [ Links ]
Senhadji, Abdelhak S., and Claudio E. Montenegro, 1999, "Time Series Analysis of Export Demand Equations: A Cross-Country Analysis," IMF Staff Papers, Vol. 46, No. 3, September-December, pp. 259-273. [ Links ]
Sokal, Robert, and James Rohlf, 1995, Biometry: The Principles and Practice of Statistics in Biological Research, New York, WH Freeman and Company. [ Links ]
Soloaga, Isidro, and Leonard Alan Winters, 2001, "Regionalism in the Nineties: What Effect on Trade, The North American Journal of Economics and Finance, Elsevier, Vol. 12, No. 1, March, pp. 1-29. [ Links ]
Stock, James H., and Mark W. Watson, 1993, "A Simple Estimator of Cointegrating Vectors in Higher Order Integrated Systems," Econometrica, Cleveland, The Econometric Society, Vol. 61, No. 4, July, pp. 783-820. [ Links ]
Summary, Rebecca, 1989, "A Political-Economic Model of U.S. Bilateral Trade," The Review of Economics and Statistics, Massachusetts Institute of Technology Press Journals, Vol. 71, No. 1, pp. 179-182. [ Links ]
Tellería, Gabriel, 2000, "Tipo de cambio, exportaciones e importaciones: El caso de la economía boliviana," Revista de Análisis, La Paz, Banco Central de Bolivia, Vol. 3, No. 1, pp. 7-40. [ Links ]
Tinbergen, Jan, 1962, Shaping the World Economy: Suggestions for an International Economic Policy, New York, The Twentieth Century Fund. [ Links ]
United Nations Conference on Trade and Development (UNCTAD), 2002, "World Investment Report 2002: Transnational Corporations and Export Competitiveness," [UNCTAD/WIR/2002], New York/Geneva, United Nations. [ Links ]
U.S. Census Bureau, 2007, "North American Industrial Classification System," U.S. Department of Commerce, available at <http://www.census.gov/cgi-bin/sssd/naics/naicsrch?chart=2007>, last accessed on September 7, 2015. [ Links ]
U.S. Department of Commerce, 2015, "International Trade Administration (ITA)," Washington D.C., available at <http://www.trade.gov/>, last accessed on September 7, 2015. [ Links ]
Wei, Shang-Jin, 1996, "Intra-National versus International Trade: How Stubborn are Nations in Global Integration?," Cambridge, United States, National Bureau of Economic Research (NBER Working Papers, No. 5531). [ Links ]
1 As shall be explained, the use of multivariate cointegration testing was not feasible in this particular case.
2 Source: own estimation based on data from the National Institute of Statistics and Geography (Inegi, 2015a, 2015b) of Mexico and the International Trade Administration database of the U.S. Department of Commerce (2015).
3 FDI can also lead to higher trade in intermediate inputs between parent and subsidiary companies.
4 The peso-dollar real exchange rate is obtained as follows: QtMEX = EMEXPUS /PMEX, where EMEX stands for the peso-dollar nominal exchange rate, PUS denotes the U.S. price level, and PMEX denotes the Mexican price level. The use of consumer price indices generated better econometric results than other alternatives, such as producer price indices.
5 The yuan-dollar real exchange rate was calculated in the conventional way: QtCH = ECH PUS /PCH, where ECH is the yuan-dollar nominal exchange rate and PCH is the Chinese price level. As in the previous case, we make use of consumer price indices given that they produced better econometric results than other price indices.
6 In the case of Foreign Direct Investment, for instance, monthly data are not available so that one has to use quarterly data coupled with a suitable frequency conversion method.
7 Unfortunately, frequency conversion necessarily entails an information loss.
8 Since the real interest rate and capacity utilization are expressed as percentages, these variables, as opposed to the others, do not really tend to grow over time.
9 The interannual growth rate for a given variable Xt, when working with monthly data, is calculated as follows: (Xt- Xt-12) / Xt-12)*100.
10 The aforementioned F- and t-type tests are not presented here for the sake of brevity, but are available upon request.
11 The information set is defined as the selection of variables that are jointly modeled, including not only stochastic variables but also deterministic regressors (i.e., the intercepts and trends in the VAR model).
12 The inclusion of dummy variables can alter the asymptotic behavior of the test statistics (i.e., the trace and maximum eigenvalue statistics) in a way that cannot be accounted for by the critical values of the cointegration test.

