


 nova página do texto(beta)
 Inglês (pdf)
 Artigo em XML
 Referências do artigo
 Enviar este artigo por email
 Citado por SciELO
  Similares em
SciELO
Similares em
SciELO 
 Permalink
Introduction
Intake of beverages (tea, infusions, decoctions, juices or nectars) has been considered to account for up to 21% of the consumed total energy by an adult, which comes particularly from sugar-sweetened beverages, contributing to the excessive energy intake linked to obesity and diabetes (Chávez et al., 2018). In addition, new food trends show that sweet carbonated beverages are displaced by functional beverages (Chávez et al., 2018). Functional beverages offer health and self-care benefits due to their high nutritional and bioactive compound content, which can be naturally functional or nutraceutical (Cong et al., 2020; Gunathilake, 2020). These beverages are more than half of the total value of the functional food market, with one-third of sales in the Asia-Pacific region (Cong et al., 2020). Most functional beverages are made from fruit pulp, vegetables, plant leaves alone or combined and they are a good source of nutrients and bioactive compounds (Carbonell-Capella et al., 2015).
One of these plants rich in bioactive compounds, such as phenolic compounds, alkaloids, and acetogenins, that can be used to prepare functional beverages is Annona muricata L. (Annonaceae) (Aguilar-Hernández et al., 2020b). The pulp of A. muricata has been used to elaborate beverages such as juices and nectars; the literature has reported that these beverages maintain their nutrients and bioactive compounds when they are processed with emerging technologies such as vacuum-thermosonication, or when they are consumed fresh and stored under refrigeration conditions (Martínez-Moreno et al., 2020).
On the other hand, A. muricata leaves are traditionally used as herbal remedies around the world in the form of infusions or decoctions for the treatment of ailments such as diabetes, hypertension, fever, vomiting, parasites, headache, cough, asthma, and even as anti-inflammatory and sedative agents (Coria-Téllez et al., 2018). However, the A. muricata infusions, decoctions, or teas have shown unfavorable features such as bitter taste and smell (Preciado-Saldaña et al., 2019). Because of this, adults and young people hardly consume these herbal products or do not consider the consumption of beverages based on this plant; therefore, it is necessary to find the balance between bioactive and organoleptic qualities for new consumers (Preciado-Saldaña et al., 2019).
The combination of fruit pulps and plant extracts has been scarcely explored and investigated. For example, one of the few reports showed that combining soursop pulp, whey, and the prebiotic inulin, makes a healthy beverage with antioxidant and antihypertensive activities (Guimarães et al., 2019; 2020). Hardoko et al. (2018) studied the combination of A. muricata leaves and green tea leaves to obtain an infusion with anti-hyperuricemic activity. They showed that the infusion obtained at 100 °C for 30 min produced the highest inhibitory action on the xanthine oxidase enzyme, concluding that this effect is due to the high content of phenolic compounds.
Thus, the formulation of functional beverages is challenging to satisfy new consumers who seek health benefits but prefer those with good organoleptic traits. The mixture design is a valuable tool for formulating and investigating the role of ingredients and their interactions in the final formulation; through this technique, a mathematical model related to the factors of the mixture and their responses was obtained (Cornell, 2002). The mixture design has been applied to find the best balance of content of nutrients, bioactive compounds, and sensory acceptability, as well as to optimize food formulation (Akonor, 2020). Therefore, this work aimed to obtain a characterized and sensorially accepted beverage using the combination of leaf extract and pulp of A. muricata.
Materials and Methods
Plant collection
Mature, healthy leaves and fully ripe fruits (free of damage) of A. muricata (Fig. 1A) were harvested from an orchard in Camichin de Jauja, Nayarit, Mexico (21°28'3.69''N 104°48'9.7''W) in January 2022 (Fig. 1B). The plant material was taxonomically identified by the taxonomist Daniel Sánchez of the National Laboratory for Plant Identification and Characterization of the University of Guadalajara under the voucher specimen number SIST-TRAT-2022-4, IBUG (#213959), information previously published (Nolasco-González et al., 2022).
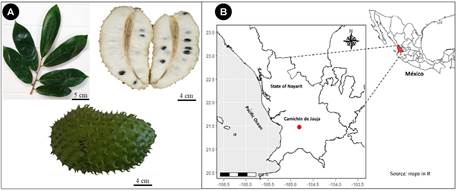
Figure 1: Place of collection of leaves and fruit of Annona muricata L. A. leaves, fruit and pulp of A. muricata; B. site Camichín de Jauja, Nayarit, Mexico. Photos by Yolanda Nolasco González.
Fruits were washed and de-pulped manually, then the pulp (13.59 °Brix, see Table 1) was ground in a blender (Oster©-All metal drive 6800, Boca Ratón, Florida, USA) and kept frozen (-18 °C) until further use. The leaves were dried in a convection oven (Memmert 854, Schwalbach, Germany) at 40 °C and pulverized in a scientific mill (CGoldenWall HC-2000, San Francisco, California, USA).
Table 1: Physicochemical characteristics of the raw material to prepare the beverages of Annona muricata L. TSS=Total soluble solid; pH=Hydrogen potential; L*=Luminosity; C*=Chromaticity; °Hue=Hue angle. Values represent the means ± standard deviation of three determinations (n=3). Different letter by row indicates significant differences between treatments (α=0.05).
| Response | Pulp | Ultrasonicated leaf extract | Leaf Infusion |
|---|---|---|---|
| TSS | 13.59±0.08a | 0.22±0.04b | 0.20±0.00b |
| pH | 3.70±0.11b | 5.76±0.15a | 5.74±0.18a |
| Acidity (%) | 1.56±0.10a | 0.13±0.02b | 0.11±0.01b |
| Ratio °Brix/Acidity | 8.55±0.46a | 1.67±0.28b | 1.83±0.17b |
| Color | |||
| L* | 55.57±0.32a | 17.79±0.58b | 18.32±0.71b |
| C* | 6.02±0.28b | 7.81±0.28a | 7.70±0.17a |
| °Hue | 114.84±0.47a | 89.10±1.53b | 88.41±1.62b |
Preparation of the aqueous extract of A. muricata leaves
The aqueous extract was obtained (2.5 g of dry leaf powder/100 ml of water) with ultrasound-assisted extraction at 80% sonication amplitude, 0.7 s pulse cycles, and 4.5 min extraction time (Nolasco-González et al., 2022) and then centrifuged at 16,000 xg for 10 min at 4 °C (Hermle Z32HK, Wehingen, Germany). Next. The supernatant was recovered by decantation, protected from light, frozen, and stored (-18 °C) until the preparation of the beverages. This extract was named leaf extract.
Formulation of beverages using a mixture design
A simple lattice mixture design for mixtures of three components (soursop pulp =X1, leaf extract =X2, and water =X3) was performed to formulate the beverages. The constraints for each component were: 0.20≤X1≤0.30, 0.30≤X2≤0.50, and 0.30≤X3≤0.50. It generated nine formulations (Table 1) for the beverage formulations. The three components represent 99.55% weight of the formulation, and the rest of the ingredients were constants (0.30% w/v Svetia brand© and 0.15% w/v citric acid).
All the ingredients were weighed according to their corresponding formulation (Table 1). According to the official Mexican guidelines, the beverages were prepared following good manufacturing practices of the NOM-173-SE-2021 (SE, 2021) and NOM-251-SSA1-2009 (SSA, 2009). Each drink was formulated by placing the previously ground pulp, leaf extract, sweetener, citric acid and finally the purified water in a sterile glass jar, according to each formulation. After they were mixed in a blender for homogenization and refrigerated (4 °C) for a week, the raw materials and beverages were analyzed.
Physicochemical evaluation
The acidity was measured with an acidity meter (Multi Fruits PAL-Easy ACIDF5, ATAGO©, Tokyo, Japan). The pH was measured with a potentiometer (Hanna© Instruments, HI 2210, Padua, Italy) using method 981.12 (AOAC, 2005). Total soluble solids (TSS) were determined with a digital refractometer (Hanna© Instruments, HI 96801, Padua, Italy) by method 932.12 (AOAC, 2005). The °Brix/acidity ratio was calculated with the total soluble solids and acidity ratio. The color was measured with a colorimeter (Minolta CR-400, Tokyo, Japan) and reported hue angle (°Hue), chromaticity (C*), and luminosity (L*).
Total soluble phenols (TSP) content was determined using the Montreau method (Montreau, 1972). The reaction mixture was measured at 750 nm wavelength with a microplate reader (800TS, Biotek, Winooski, Vermont, USA). The results were calculated as milligrams of gallic acid equivalents per 100 ml beverage (mg/100 ml).
The antioxidant capacity was evaluated with three methods: DPPH (1,1 diphenyl-2-picrylhydrazyl) assay was performed according to Prior et al. (2005), ABTS+ radical (2,2´-Azinobis-(3-ethylbenzothiazoline-6-sulfonic acid) assay (Re et al., 1999), and FRAP (Ferric-ion reducing antioxidant power) assay (Benzie and Strain, 1996). All absorbances were measured in a microplate reader (800TS, Biotek, Winooski, VT, USA). The results were expressed as millimole Trolox (6-hydroxy-2,5,7,8 tetramethylchroman-2-carboxylic acid) equivalents per 100 ml beverage (mmol/100 ml).
Sensory evaluation
Two sensory evaluations were tested to select a beverage with sensory acceptability. The first sensory evaluation was performed in the nine formulations using an unstructured hedonic scale of ten points (0=Dislike very much, 5=Indifferent, 10=Like very much) with a panel of fifty untrained judges to evaluate the characteristics of appearance, aroma, sweetness, taste, consistency, and quality according to Pedrero and Pagborn (1989). The 10-point scale consisted in that each judge had to indicate the preference of the attribute from the beginning of the scale (0 cm) to the end (10 cm). The centimeters each judge marked were then measured to evaluate the results statistically.
The first sensory evaluation selected two beverages with the highest scores. Judges preferred sweeter drinks, so the sweetness of the two selected drinks was adjusted with 4 g of sucrose per 100 ml of beverage. The two beverages were submitted to a second sensory analysis with a panel of fifty judges. The evaluation consisted of a preference test with a structured hedonic scale with three points (1=Dislike, 2=Neither like nor dislike, 3=Like) evaluating taste and general appearance according to Pedrero and Pagborn (1989).
Statistical analysis
The data of mixture design were analyzed using a regression analysis, using the model type Y = β1X1 + β2X2 + β3X3… βnXn. Where Y predicts the dependent variable (TSP, antioxidant capacity), β is the adjustment coefficient, and X represents the components. Also, model adequacy was assessed by analysis of variance (ANOVA) using the statistical software Minitab© v. 19 (Minitab, 2019) (Minitab LLC, Ferguson, PA, USA) to determine the effects of significant interactions in the model (p<0.05) and by quantification of the coefficient of determination (R-squared and R-adjusted). The Fisher-LSD test (α=0.05) assessed the differences between means. The polynomials generated Cox response trace plots for the dependent variables, and the response surface contour plots were based on the fitted model equation.
On the other hand, for the first sensory evaluation, the data were analyzed by ANOVA with multiple comparison tests (Fisher-LSD, α=0.05), and the highest qualified beverages were selected. The frequency percentage of the preference level scale for each attribute was calculated for the second sensory evaluation. According to the statistical results of the second sensory test and the content of TSP, a beverage was selected.
Comparison of physicochemical parameters and content of bioactive compounds between the selected beverage, an infused and commercial beverage
First, the leaf infusion was prepared with the A. muricata pulverized dried leaves wrapped in filter paper (2.5 g/100 ml), adding hot water (98 °C) and leaving it to stand for 10 min, after which the infusion was filtered for use (Nolasco-González et al., 2022). The infused beverage was then prepared using the same quantity of leaf power, water, pulp, sweetener, and citric acid as the selected beverage. It was packed in sterile glass jars and refrigerated (4 °C) for a week.
The commercial soursop pulp beverage (Boing©, Pascual Cooperative Society, S.C.L., Mexico City, caducity date: 02 March 23, batch: L1 74734 6:54) was obtained from a local supermarket in Tepic, Nayarit, Mexico.
The three beverages were analyzed physiochemically (as described above), and the content of different bioactive compounds was determined. Therefore, the content of total soluble phenols and antioxidant capacity were re-evaluated. In addition, the samples were also analyzed to determine phenolic compounds, total alkaloids, and total acetogenins.
Hydrolyzable polyphenols and condensed tannins
The hydrolyzable polyphenols and condensed tannins were determined in the dry residues after the soluble phenol extraction. For hydrolyzable polyphenols, 200 mg were hydrolyzed with H2SO4/methanol, 2:20 (v/v) at 85 °C for 20 h. Next, the sample was centrifuged (16000 xg, 10 min, 4 °C) (Hermle Z32HK, Wehingen, Germany) and the precipitates were resuspended twice with methanol (10 ml) and centrifuged at the same conditions. The supernatant mixture was subjected to a reaction using Folin-Ciocalteu reagent, and hydrolyzable polyphenols were calculated with a standard curve of gallic acid (G7384, Sigma-Aldrich©, St. Louis, Missouri, USA) as previously described (Montreau, 1972; Hartzfeld et al., 2002).
The dry residue (200 mg) was treated with 10 ml of n-butanol/HCl/FeCl3 (95:2.5:0.07, v/v/w) solution at 100 °C for 3 h to quantify condensed tannins. Afterwards, the sample was centrifuged (16000 xg, 10 min, 4 °C) (Hermle Z32HK, Wehingen, Germany), and the residues were rewashed with the same solution. The supernatants blend absorbance was determined at 555 nm in the microplate reader. Condensed tannins were calculated with a standard curve of tannins from Mediterranean carob pods (Ceratonia siliqua L.) (Reed et al., 1982). The results were expressed as mg/100 ml of sample.
Total flavonoids
The reaction consisted of 1 ml of sample, 1 ml of methanol, and 1 ml of 2% AlCl3 aqueous solution. The mixture was maintained in a dark condition with continuous stirring for 10 min. The absorbance was measured at 415 nm in the microplate reader (Bonvehí and Coll, 1994). Results were calculated with a standard curve of quercetin (Q4951, Sigma-Aldrich©, St. Louis, Missouri, USA) and expressed as mg/100 ml.
Total alkaloids
The extraction of alkaloids in the lyophilized sample (1 g) was performed with methanol (25 ml) in an ultrasonic bath (Cole-Palmer© 08895-1, IL, USA) for 1 h. The extract was filtered with Whatman paper No. 1, and 1 ml of the supernatant was mixed with 1 ml of HCl 2 N. Three washes were performed with 1 ml of chloroform, and the organic part was adjusted to neutral pH (NaOH, 0.1 N). Next, 5 ml of a 0.07 mg/ml bromocresol green solution (34.9 mg of bromocresol green, 1.5 ml of NaOH 2N, and distilled water to raise 500 ml volume) and 5 ml of phosphate buffer pH 4.7 were added; the mixture was stirred, and the alkaloid-bromocresol green complex was extracted with 4 ml of chloroform. The yellow complex was separated, and the absorbance was measured at 416 nm in a microplate reader (Fazel et al., 2010). A standard curve of atropine (A0132, Sigma-Aldrich©, St. Louis, Missouri, USA) was performed, and the results were expressed as atropine equivalents (mg/100 ml).
Total Acetogenins
Total acetogenins were determined as described by Aguilar-Hernández et al. (2020a) with slight modifications. The lyophilized sample (2 g) was mixed with chloroform (30 ml) and stirred in a rotary shaker (Heidolph©, Reax 2, Schwabach, Germany) for 2 h. The mixture was centrifuged (9380 xg, 10 min, 4 °C) (Hermle Z32HK, Wehingen, Germany), and the supernatant was recovered. The residue was resuspended with chloroform (20 ml), followed by agitation and centrifugation at the previously mentioned conditions. The supernatants were combined and evaporated to dryness. Subsequently, 1 ml of methanol was added to the dry extract, and 250 µl were taken and mixed with 2000 µl of Kedde reagent. The absorbance was measured at 505 nm in the spectrophotometer (Jenway©, 6705, Dunmow, Ukraine). Luis Gerardo Zepeda Vallejo (Department of Organic Chemistry of the National School of Biological Sciences (ENCB), Instituto Politécnico Nacional (IPN), Mexico City, Mexico) provided the annonacin standard (95% of purity). A standard curve of annonacin was performed, and results were expressed as annonacin equivalents (mg/100 ml).
Chemical profiling by UPLC-ESI-MS-QTOF of the selected beverage
The methanolic extract was prepared with 300 mg of lyophilized sample in an accelerated solvent extraction (Thermo-Scientific©, ASE 350 Dionex, Sunnyvale, California, USA) and concentrated to dryness by rotary evaporation (Büchi©, RII, Flawil, Switzerland). Then, the dried methanolic extract was dissolved in methanol with formic acid (0.1%) at 100 mg/ml, according to Monribot-Villanueva et al. (2022). The chemical profiling was performed in a UPLC Class I coupled to Synapt HDMi mass spectrometer (Waters©, Milford, Massachusetts, USA), and the separation conditions were as those previously described (Monribot-Villanueva et al., 2022). The mass spectrometric analysis was performed with an electrospray ionization source in negative and positive modes. Data were acquired and processed with MassLynx v. 4.1 software (Waters Inc., 2013). Tentative identification was performed by comparing the mass spectra with the reported in the Foodb database (Scalbert et al., 2014).
Quantification of phenolic compounds by UPLC-ESI-MS-MS of the selected beverage
The phenolic extraction was prepared as described above. Phenolic compounds were identified and quantified in a UPLC system coupled to a triple quadrupole mass spectrometer (Agilent Technologies©, 1290-6460, Santa Clara, California, USA). For the spectrometric conditions, a dynamic multiple reaction monitoring (dMRM) acquisition method was established for each phenolic compound, as it was previously reported by Juárez-Trujillo et al. (2018). The electrospraying ionization (ESI) source was operated in positive and negative ionization modes with a temperature of 300 °C, a gas (N2) flow of 5 l/min, a nebulizer pressure of 45 psi, the sheath gas temperature of 250 °C, the sheath gas flow of 11 l/min, the capillary voltage (positive and negative) was 3500 V and the nozzle voltage (positive and negative) of 500 V. The cell accelerator voltage was 7 V for each compound. The data were obtained with the MassHunter Workstation Software v. B.06.00 (Agilent Technologies©, 2012). For quantification, calibration curves were performed for each phenolic compound using commercial standards purchased from Extrasynthese (Lyon, France). The results are the average ± standard deviation of three replicates and are expressed as µg/g of dried extract.
Quantification of annonacin and pseudoannonacin by HPLC-DAD in the selected beverage
Acetogenins (ACGs) were extracted (as described above) from the selected beverage's dry extract and diluted with methanol. Then, it was filtered (0.22 µm membrane filters), and 10 µl were injected into an HPLC system (Agilent Technologies©, 1260 Infinity, Waldbronn, Germany) equipped with a photodiode array detector (DAD) fitted with an Agilent Zorbax SB C18 reverse-phase column (250 mm × 4.6 mm, 5µm) at 30 °C. The mobile phase consisted of methanol (eluent A) and water (eluent B), using a linear gradient: 0-40 min (85% A) and 40-60 min (85-95% A) at a flow rate of 1.0 ml/min (Yang et al., 2010). Acetogenins were calculated using standard curves of annonacin and pseudoannonacin (mg/100 ml). Luis Gerardo Zepeda Vallejo (Department of Organic Chemistry, ENCB, IPN) also donated pseudoannonacin (95% of purity).
Results
Physicochemical evaluation
The physicochemical characteristics of the raw material used to prepare the beverages of A. muricata are shown in Table 1. Soursop pulp presented higher TSS content (13.59 °Brix), acidity (1.56%) and °Brix/acidity ratio than the extracts. In addition, its color was white with a higher lightness (55.57). Leaf extract and leaf infusion had no significant differences among them (p>0.05); however, they presented low TSS content (0.20-0.22 °Brix), low acidity (0.11-0.13%) and °Brix/acidity ratio (1.67-1.83) with a light-yellow color.
The formulations obtained by the mixture design exhibited statistical differences in the physicochemical parameters (p<0.05) (Table 2). The highest content of total soluble solids (4.10-4.13 °Brix), acidity (0.48-0.50%), pH values (3.66-3.74), and the °Brix/acidity ratio (8.33 to 8.56) was determined in the formulations F2, F4, and F6. In contrast, the formulations with the highest water and leaf extract content exhibited less TSS and acidity values caused by a dilution effect (Table 2).
Table 2: Physicochemical characteristics of the formulated beverages of Annona muricata L. using the mixture design. LE=Leaf extract; TSS=Total soluble solid; L*=Luminosity; C*=Chromaticity; °Hue=Hue angle. Values represent the means ± standard deviation of three determinations and three replicates (n=9). Different letters by column indicates significant differences between treatments (α=0.05).
| Components in mixture | Physicochemical parameters | |||||||||
|---|---|---|---|---|---|---|---|---|---|---|
| Formulation (F) | Pulp (X1) | LE (X2) | Water (X3) | TSS (°Brix) | pH | Acidity (%) | Ratio (°Brix/Acidity) | Color | ||
| L* | C* | °Hue | ||||||||
| 1 | 20 | 30 | 50 | 3.03±0.15d | 3.62±0.01f | 0.35±0.02d | 8.77±0.65ab | 31.28±1.22f | 6.81±0.34f | 116.76±1.38a |
| 2 | 30 | 30 | 40 | 4.13±0.06a | 3.66±0.01e | 0.48±0.01a | 8.56±0.33abc | 40.28±1.80a | 9.17±0.08c | 111.34±0.45c |
| 3 | 20 | 50 | 30 | 3.20±0.00c | 3.72±0.01b | 0.39±0.02c | 8.14±0.31cd | 31.01±0.78f | 9.38±0.14c | 107.63±0.10d |
| 4 | 30 | 50 | 20 | 4.13±0.06a | 3.74±0.01ba | 0.50±0.012a | 8.33±0.26bc | 38.62±0.49ab | 11.44±0.69a | 105.70±0.56e |
| 5 | 20 | 40 | 40 | 3.20±0.00c | 3.69±0.02c | 0.36±0.02d | 8.98±0.39a | 32.24±0.22f | 8.39±0.32d | 112.59±0.46b |
| 6 | 30 | 40 | 30 | 4.10±0.00a | 3.74±0.02c | 0.48±0.01a | 8.54±0.18abc | 37.31±1.21bc | 10.47±0.11b | 107.72±1.18d |
| 7 | 25 | 30 | 45 | 3.30±0.00cb | 3.63±0.01fe | 0.40±0.01c | 8.25±0.21bc | 34.42±0.44de | 7.34±0.11e | 116.84±0.660a |
| 8 | 25 | 50 | 25 | 3.33±0.06b | 3.69±0.01c | 0.44±0.01b | 7.58±0.30d | 33.93±1.04e | 10.02±0.17b | 108.01±0.20d |
| 9 | 25 | 40 | 35 | 3.30±0.00cb | 3.65±0.02ed | 0.43±0.01b | 7.62±0.21d | 36.02±0.49dc | 9.45±0.28c | 110.16±0.35c |
The beverages exhibited changes (p<0.05) related to the quantity of pulp and leaf extract added. The luminosity, chromaticity, and °Hue depended on the pulp percentage; when more pulp was added, whiter tones were measured in the beverages. In contrast, when more leaf extract was added to the beverages, the beverages exhibited yellowish tones.
Total soluble phenols and antioxidant capacity
The content of TSP and the antioxidant capacity of the raw material used to prepare the beverages of A. muricata are shown in Table 3. Soursop pulp had lower TSP (0.49 mg/g) than leaf extract (0.82 mg/ml) and leaf infusion (0.68 mg/ml), but had higher contents of condensed tannins, hydrolyzable polyphenols, flavonoids, alkaloids and acetogenins. Antioxidant capacity depended on each raw material and assay. The pulp presented the highest antioxidant capacity with the ABTS assay, the leaf extract with FRAP and DPPH assays, and the leaf infusion had the lowest antioxidant capacity with ABTS assay. However, these experimental values differ from the TSP value and antioxidant capacity determined in the formulated beverages (Table 4). The formulation F4 (30% pulp, 50% leaf extract, and 20% water) displayed the highest content of TSP (114.04 mg/100 ml), as well as the highest antioxidant capacity (100.44-217.21 mmol/100 ml). On the contrary, formulation F1, with 30% leaf extract, 50% water, and 20% pulp, presented the lowest values of TSP (78.16 mg/100 ml) and antioxidant capacity (56.82-138.05 mmol/100 ml). Moreover, it is essential to highlight that the antioxidant capacity differed depending on the method used. The highest values were obtained with the DPPH assay, followed by FRAP and ABTS assays.
Table 3: Content of bioactive compounds in the raw material to prepare the beverages of Annona muricata L. FW=fresh weight; ABTS=2,2ʹ-azino-bis-(3-ethylbenzothiazoline-6-sulfonic acid; DPPH=2,2-diphenyl-1-picrylhydrazyl; FRAP=Ferric ion reducing antioxidant power; Nd=not detected. Values represent the means ± standard deviation of three determinations and three replicates (n=9). Different letters by row indicates significant differences between treatments (α=0.05).
| Response | Pulp (mg/g FW) | Leaf extract (mg/ml) | Leaf infusion (mg/ml) |
|---|---|---|---|
| Total soluble phenols | 0.49±0.01 | 0.82±0.02a | 0.68±0.01b |
| Antioxidant capacity (mM Trolox/ml) | |||
| DPPH | 1.83±0.03c | 5.26±0.03a | 2.78±0.08b |
| FRAP | 2.70±0.05b | 2.94±0.01a | 2.04±0.02c |
| ABTS | 2.86±0.09a | 1.36±0.00b | 1.36±0.00b |
| Condensed tannins | 1.13±0.02a | 0.04±0.00b | 0.01±0.00b |
| Hydrolyzable polyphenols | 1.77±0.01a | 0.17±0.01b | 0.06±0.01c |
| Total flavonoids | 0.10±0.01a | 0.07±0.01b | 0.04±0.01c |
| Total alkaloids | 0.14±0.02a | 0.07±0.01b | 0.07±0.01b |
| Total acetogenins | 0.70±0.00 | nd | nd |
Table 4: Total soluble phenols and antioxidant capacity of the formulated beverages of Annona muricata L. using the mixture design. TSP=Total soluble phenols; DPPH=2,2-diphenyl-1-picrylhydrazyl; ABTS=2,2ʹ-azino-bis-(3-ethylbenzothiazoline-6-sulfonic acid; FRAP=Ferric ion reducing antioxidant power. Values represent the means ± standard deviation of three determinations and three replicates (n=9). Different letters by column indicates significant differences between treatments (α=0.05).
| Component proportion in the mixture | Antioxidant capacity (mmol/100 ml) | ||||||
|---|---|---|---|---|---|---|---|
| Formulation (F) | Pulp (X1) | Leaf extract (X2) | Water (X3) | TSP (mg/100 ml) | DPPH | FRAP | ABTS |
| 1 | 20 | 30 | 50 | 78.16±1.47g | 138.05±2.34h | 123.80±1.55g | 56.82±10.49i |
| 2 | 30 | 30 | 40 | 92.41±2.80e | 150.76±0.29g | 127.62±0.45f | 65.18±0.65g |
| 3 | 20 | 50 | 30 | 104.84±0.65c | 189.22±0.99c | 170.45±1.85b | 91.15±1.03c |
| 4 | 30 | 50 | 20 | 114.04±0.59a | 217.21±2.72a | 175.12±0.38a | 100.44±0.07a |
| 5 | 20 | 40 | 40 | 88.00±1.12f | 159.51±1.55f | 132.42±1.91e | 73.62±0.61f |
| 6 | 30 | 40 | 30 | 100.01±1.10d | 172.14±0.74e | 141.79±0.08c | 79.36±0.79e |
| 7 | 25 | 30 | 45 | 80.17±1.87g | 141.68±3.01h | 122.44±0.56g | 63.00±0.11h |
| 8 | 25 | 50 | 25 | 111.12±1.91b | 199.95±3.18b | 170.77±0.57b | 95.93±0.56b |
| 9 | 25 | 40 | 35 | 97.85±0.62d | 176.35±2.76d | 137.42±1.03d | 86.33±1.45d |
Also, TSP values and antioxidant capacity were analyzed by regression analysis. The experimental data were adjusted to the mathematical models, which allowed us to estimate the regression coefficients, R-squared, and adjusted R-squared values (>0.90) (Table 5). For data of TSP, the best model was linear since there were no significant interactions (p>0.05) between the components of the mixture. In contrast, for antioxidant capacity data, in any assay, the best model was quadratic, with significant interactions (p<0.05) between their components (Table 5).
Table 5: Predicted models for total soluble phenols and antioxidant capacity of Annona muricata L. ABTS=2,2ʹ-azino-bis(3-ethylbenzothiazoline-6-sulfonic acid; DPPH=2,2-diphenyl-1-picrylhydrazyl; FRAP=Ferric ion reducing antioxidant power. *To indicate the significant effect (p<0.05) of the predictor variable on the response variable. NSI: No significant interactions (p>0.05).
| Predictor variable | Antioxidant capacity | |||
|---|---|---|---|---|
| TSP | DPPH | FRAP | ABTS | |
| Pulp (X1) | 1.32* | -3.27* | 6.24* | -8.55* |
| Leaf extract (X2) | 1.46* | 2.75* | 7.00* | 0.22* |
| Water (X3) | 0.14* | 1.03* | 2.50* | -1.17* |
| X1*X2 | NSI | 0.10 | -0.17* | 0.17* |
| X1*X3 | NSI | 0.06 | -0.07* | 0.16* |
| X2*X3 | NSI | -0.03 | -0.11* | 0.01 |
| R2 | 0.96 | 0.98 | 0.99 | 0.98 |
| Adj R2 | 0.96 | 0.97 | 0.99 | 0.97 |
The Cox response plots (Fig. 2) represent how each component influences the response variables. The union of the three elements is called the central point or central mixture (X1=0.25, X2=0.40, X3=0.35). To the right of the central point, leaf extract in the mixture increased TSP, and to the left decreased it. However, the leaf extract was the component that contributed to the most significant increase in TSP (p<0.05) (Fig. 2A). Likewise, increasing leaf extract raises the antioxidant capacity by DPPH, FRAP and ABTS assays (Fig. 2B-2D).
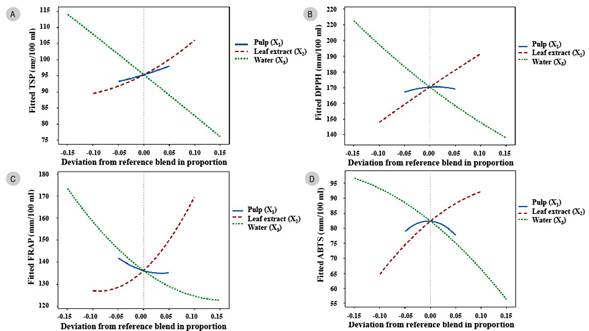
Figure 2: Cox response trace plot as a function of the proportion of soursop pulp, leaf extract and water. A. total soluble phenols; B, C, D. antioxidant capacity.
On the other hand, increasing the proportion of pulp in the formulations also showed a slight increase in TSP and antioxidant capacity with the DPPH assay. In contrast, with FRAP and ABTS, they decreased. However, if the amount of water increased in the formulation, the TSP and antioxidant capacity by the three assays decreased. Conversely, if the proportion of water fell, the response values increased (Fig. 2A-2D).
In addition, contour plots show the response surface based on a model equation (Fig. 3A-3D), in which all points having the same fitted response are connected to produce response contour lines, and the colored contour bands represent ranges of the held response values. The areas with intense color within the design space (red rhomboids) in the upper left corner correspond to the proportions of each component to maximize the highest TSP content and antioxidant capacity. At high extract, low water, and intermediate pulp ratios, bands of intense color are obtained, representing higher ranges of TSP and antioxidant capacity for all three assays. Moreover, the TSP content can be predicted by varying proportions of each factor.

Sensory evaluation
There were significant differences (p<0.05) between treatments for each sensory characteristic (Fig. 4). Formulations with 40-50% of leaf extract and 20-30% pulp (F3-F6 and F9) were less preferred by judges (scores of 5-6). In contrast, the formulations F1 and F7 were moderately accepted, while the formulations F2 (30% pulp and 30% leaf extract) and F8 (25% pulp and 50% leaf extract) had the highest qualification in sweetness, taste, consistency, and general quality with an average from 7.02 to 7.78, in a scale of 10 points (Fig. 4). For this reason, formulations F2 and F8 were selected for the second sensory evaluation.

Figure 4: Graphical plot of sensory profile of the soursop beverages formulated with the mixture design.
The second sensory test showed that there were no significant differences (p>0.05) in taste and general appearance in both formulations (Fig.5). According to the content of TSP (Table 4), F8 and F2 exhibited 111.12 and 92.41 mg/100 ml, respectively. In this sense, formulation F8 was selected to compare its content of bioactive compounds with an infused beverage and a commercial beverage.

Comparison in physicochemical parameters and content of bioactive compounds between the selected beverage, an infused beverage, and a commercial beverage
The selected and infused beverages had the same TSP content, pH and titratable acidity (p>0.05) and a °Brix/acidity ratio between 19.24 to 20.54; however, the commercial beverage exhibited low acidity and therefore a °Brix/acidity ratio of 41.37 (Table 6). Moreover, the selected beverage showed higher values of luminosity and chromaticity and lower °Hue values than the infused and commercial beverages (p<0.05). Thus, the color of the selected beverage was more yellow than the color of the infused beverage or commercial beverage. However, the color of the selected beverage (F8) was sensorially accepted (Fig. 4).
Table 6: Physicochemical characteristics in the selected beverage of Annona muricata L. compared with the infused and commercial beverages. 1Selected beverage formulated with pulp and leaf extract of Annona muricata using ultrasound (F8); 2Beverage formulated with pulp and leaf infusion of Annona muricata. Values represent the mean ± standard deviation of three determinations (n=3). Different letters by row indicates significant differences between beverages (α=0.05).
| Response | 1 Selected beverage | 2 Infused beverage | Commercial beverage |
|---|---|---|---|
| Total soluble solids (°Brix) | 7.63±0.21a | 7.67±0.06a | 7.67±0.06a |
| pH | 3.42±0.02c | 3.47±0.04b | 3.68±0.08a |
| Titratable acidity (%) | 0.40±0.03a | 0.37±0.01b | 0.18±0.01c |
| °Brix/Acidity | 19.24±0.23c | 20.54±0.27b | 41.37±0.85a |
| Color | |||
| Luminosity | 32.45±0.83a | 29.38±0.60b | 26.49±0.10c |
| Chromaticity | 8.06±0.20a | 6.33±0.30b | 1.48±0.08c |
| °Hue | 113.29±1.48c | 117.01±0.42b | 217.68±2.37a |
Table 7 shows that the highest content of TSP (110.53 mg/100 ml) and antioxidant capacity (96.24-200.92 mmol Trolox/100 ml) was found as follows: selected beverage>infused beverage>commercial beverage. Moreover, except for condensed tannins (p>0.05), the content of hydrolyzable polyphenols, total flavonoids, alkaloids, and acetogenins was higher (twice or three times more) in the selected beverage than in an infused beverage (p<0.05). At the same time, these compounds were not detected in the commercial beverage.
Table 7: Bioactive compounds in the selected beverage of Annona muricata L. compared with the infused and commercial beverages. 1Selected beverage formulated with pulp and leaf extract of Annona muricata using ultrasound; 2Beverage formulated with pulp and leaf infusion of Annona muricata. Values represent the means ± standard deviation of three determinations and three replicates (n=9). Different letters by row indicates significant differences between beverages (α=0.05).
| Parameter (mg/100 ml) | 1 Selected beverage (F8) | 2 Infused beverage | Commercial beverage |
|---|---|---|---|
| Total soluble phenols | 110.53±2.12a | 41.48±1.35b | 22.44±0.53c |
| Antioxidant capacity (mmol/100 ml) | |||
| DPPH | 200.92±3.25a | 152.87±2.07b | 31.72±3.14c |
| FRAP | 170.95±1.57a | 127.77±1.20b | 50.22±0.47c |
| ABTS | 96.24±0.81a | 85.38±0.82b | 22.68±0.71c |
| Condensed tannins | 7.06±0.26a | 6.71±0.49a | nd |
| Hydrolyzable polyphenols | 29.90±1.38a | 12.40±0.79b | nd |
| Total flavonoids | 0.68±0.07a | 0.45±0.04b | nd |
| Total alkaloids | 5.15±0.42a | 3.73±0.96b | nd |
| Total acetogenins | 13.41±0.36a | 12.52±0.31b | nd |
Chemical profiling of the selected beverage
The chemical profiling of the selected beverage is presented in Table 8. UPLC-MS-QTOF allowed us to tentatively identify in the beverage citric acid, sugars, and steviosides, additives that were manually added to the beverage. On the other hand, one terpene glycoside (cinnamoside), one phenolic alcohol (3,4-dihydroxyphenylethanol-4-diglucoside), one gallotannin (ethyl gallate 4-glucuronide), and four glycosylated phenolics (p-coumaroyl hexose, 2-hydroxybenzaldehyde O-[xylosyl-(1->6)-glucoside], rutin, and kaempferol rhamnoside-glucoside) were tentatively identified. In addition, two alkaloids (coclaurine and reticuline) and fifteen acetogenins (annohexocin, murihexocin A, murihexocin B, muricoreacin, muricin E, annomuricin C, muricatalicin, annopentonicin C, annonacin, annoreticuin-9-one, murisolin, bullatacin, annoglacin A and two acetogenins derivatives (with different retention time and m/z values) were tentatively identified with a good level of accuracy (mass error< ±5 ppm). Fourteen acetogenins are mono-tetrahydrofuranics, and one is bi-tetrahydrofuranic (bullatacin).
Table 8: Compounds tentatively identified by untargeted metabolomics in the selected beverage of Annona muricata L. RT=Retention time in min.; m/z=Mass/charge ratio in Daltons. Monoisotopic mass and Adduct m/z in Daltons.
| RT | m/z | Name | Formula | Monoisotopic Mass | Adduct | Adduct m/z | Mass Error (PPM) |
|---|---|---|---|---|---|---|---|
| 0.65 | 191.0199 | Citric acid | C6H8O7 | 192.027 | [M-H]- | 191.0197 | 1 |
| 1.17 | 647.2023 | Maltotetraose | C24H42O21 | 666.2219 | [M-H2O -H]- | 647.2035 | -1.9 |
| 2.11 | 477.1601 | 3,4-Dihydroxyphenylethanol-4-diglucoside | C20H30O13 | 478.1686 | [M-H]- | 477.1614 | -2.7 |
| 2.29 | 355.0664 | Ethyl gallate 4-glucuronide | C15H18O11 | 374.0849 | [M-H2O -H]- | 355.0665 | -0.3 |
| 2.74 | 325.0922 | p-Coumaroyl hexose | C15H18O8 | 326.1002 | [M-H]- | 325.0929 | -2.2 |
| 3.22 | 286.1447 | Coclaurine | C17H19NO3 | 285.1365 | [M+H]+ | 286.1438 | 3 |
| 3.39 | 415.1238 | 2-Hydroxybenzaldehyde O-[xylosyl-(1->6)-glucoside] | C18H24O11 | 416.1319 | [M-H]- | 415.1246 | -1.9 |
| 3.7 | 330.1706 | Reticuline | C19H23NO4 | 329.1627 | [M-H]- | 330.1705 | 2 |
| 3.8 | 395.1546 | 1-(3-Methylbutanoyl)-6-apiosylglucose | C16H28O11 | 396.1632 | [M-H]- | 395.1559 | -3.3 |
| 4.18 | 609.1459 | Rutin | C27H30O16 | 610.1534 | [M-H]- | 609.1461 | -0.3 |
| 4.43 | 593.1514 | Kaempferol rhamnoside-glucoside | C27H30O15 | 594.1585 | [M-H]- | 593.1512 | 0.3 |
| 4.63 | 593.1514 | Kaempferol rhamnoside-glucoside | C27H30O15 | 594.1585 | [M-H]- | 593.1512 | 0.3 |
| 5.23 | 517.2286 | Cinnamoside | C24H38O12 | 518.2363 | [M-H]- | 517.2291 | -1 |
| 6.12 | 1127.476 | Rebaudioside D | C50H80O28 | 1128.4836 | [M-H]- | 1127.4763 | -0.3 |
| 7.22 | 965.4247 | Rebaudioside A | C44H70O23 | 966.4308 | [M-H]- | 965.4235 | 1.2 |
| 7.56 | 949.4276 | Rebaudioside C | C44H70O22 | 950.4359 | [M-H]- | 949.4286 | -1.1 |
| 8.36 | 803.3702 | Rebaudioside B | C38H60O18 | 804.378 | [M-H]- | 803.3707 | -0.6 |
| 13.1 | 627.4467 | Annonaceous acetogenin (Annohexocin/Murihexocin A/Murihexocin B/ Muricoreacin) | C35H64O9 | 628.455 | [M-H]- | 627.4478 | -1.8 |
| 13.33 | 627.4468 | Annonaceous acetogenin (Annohexocin/Murihexocin A/Murihexocin B/ Muricoreacin) | C35H64O9 | 628.455 | [M-H]- | 627.4478 | -1.6 |
| 13.66 | 627.4462 | Annonaceous acetogenin (Annohexocin/Murihexocin A/Murihexocin B/ Muricoreacin) | C35H64O9 | 628.455 | [M-H]- | 627.4478 | -2.6 |
| 15.42 | 591.4233 | Muricin E | C33H60O7 | 568.4339 | [M+Na]+ | 591.4231 | 0 |
| 16.02 | 611.4532 | Annonaceous acetogenin (Annomuricin C/ Muricatalicin/ Annopentocin C) | C35H64O8 | 612.4601 | [M-H]- | 611.4528 | 0.7 |
| 16.13 | 595.4589 | Annonaceous acetogenin, like Annonacin | C35H64O7 | 596.4652 | [M-H]- | 595.4579 | 1.7 |
| 16.61 | 595.4579 | Annonaceous acetogenin, like Annonacin | C35H64O7 | 596.4652 | [M-H]- | 595.4579 | 0 |
| 16.96 | 593.4421 | Annoreticuin-9-one | C35H62O7 | 594.4496 | [M-H]- | 593.4423 | -0.3 |
| 17.21 | 595.4576 | Annonaceous acetogenin, like Annonacin | C35H64O7 | 596.4652 | [M-H]- | 595.4579 | -0.5 |
| 17.31 | 595.458 | Annonaceous acetogenin, like Annonacin | C35H64O7 | 596.4652 | [M-H]- | 595.4579 | 0.2 |
| 17.53 | 595.457 | Annonaceous acetogenin, like Annonacin | C35H64O7 | 596.4652 | [M-H]- | 595.4579 | -1.5 |
| 17.86 | 579.462 | Murisolin | C35H64O6 | 580.4703 | [M-H]- | 579.463 | -1.7 |
| 17.95 | 621.4728 | Annonaceous acetogenin like Bullatacin | C37H66O7 | 622.4809 | [M-H]- | 621.4736 | -1.3 |
| 18.17 | 621.4717 | Annonaceous acetogenin like Bullatacin | C37H66O7 | 622.4809 | [M-H]- | 621.4736 | -3.1 |
| 18.34 | 669.4929 | Annoglacin A | C37H68O7 | 624.4965 | [M+FA-H]- | 669.4947 | -2.7 |
Quantification of phenolic compounds and acetogenins of the selected beverage
Fourteen phenolic compounds were identified and quantified (Table 9) based on the retention time and mass spectrometry data compared with authentic standards. The most abundant phenolic compounds in the selected beverage were rutin (882.72 µg/100 ml), (-)-epicatechin (108.92 µg/100 ml), quercetin-3-glucoside (96.99 µg/100 ml), procyanidin B2 (68.22 µg/100 ml), kaempferol-3-O-glucoside (42.44 µg/100 ml), 4-coumaric acid (40.57 µg/100 ml) and chlorogenic acid (34.34 µg/100 ml). In addition, the main acetogenin quantified was pseudoannonacin (8.71 mg/100 ml), followed by annonacin (0.84 mg/100 ml).
Table 9: Quantification of phenolic compounds in the methanolic extract from the dried selected beverage of Annona muricata L. Values represent the mean ± standard deviation of three determinations (n=3). *Value determined below the limit of quantification.
| No. | Phenolic compounds | dMRM transition | Mass spectrometric conditions | Quantification | ||||
|---|---|---|---|---|---|---|---|---|
| Precursor ion | Production ion | RT (min) | Collision energy | Fragment | Polarity | (µg/100 ml) | ||
| 1 | Protocatechuic acid | 153.0 | 109.1 | 2.5 | 10 | 100 | negative | 2.99+0.05 |
| 2 | (+)-Catechin | 291.0 | 138.9 | 5.07 | 10 | 100 | positive | 5.70+0.05 |
| 3 | Chlorogenic acid | 355.1 | 163.0 | 5.34 | 10 | 100 | positive | 34.34+0.90 |
| 4 | Procyanidin B2 | 577.1 | 425.1 | 6.4 | 10 | 100 | negative | 68.22+9.12 |
| 5 | Vanillin | 153.0 | 124.9 | 6.52 | 10 | 100 | positive | 1.38+0.06* |
| 6 | (-)-Epicatechin | 291.0 | 138.8 | 6.96 | 10 | 100 | positive | 108.92+1.67 |
| 7 | 4-Coumaric acid | 165.0 | 147.0 | 7.21 | 10 | 100 | positive | 40.57+0.42 |
| 8 | Ferulic acid | 195.1 | 145.0 | 8.6 | 20 | 100 | positive | 0.91+0.10* |
| 9 | Ellagic acid | 300.5 | 145.0 | 9.98 | 30 | 170 | negative | 16.22+1.06 |
| 10 | Rutin | 611.0 | 302.9 | 10.35 | 10 | 100 | positive | 882.72+28.34 |
| 11 | Quercetin-3-glucoside | 465.0 | 303.0 | 10.57 | 10 | 100 | positive | 96.99+2.44 |
| 12 | Kaempferol-3-O-glucoside | 449.0 | 286.9 | 11.91 | 10 | 100 | positive | 42.44+1.39 |
| 13 | t-Cinnamic acid | 149.1 | 131.0 | 14.08 | 10 | 100 | positive | 4.73+0.10 |
| 14 | Methyl-cinnamate | 163.1 | 131.0 | 21.46 | 6 | 100 | positive | 0.80+0.02* |
Discussion
The newly formulated beverages considered with a potential functional must be evaluated to know the content and profile of bioactive compounds since the type and quantity of these bioactive compounds are indispensable to assume that the formulated beverages could have an essential biological activity when consumed by humans. In addition, nowadays, functional beverages are preferred by consumers if they taste good but have low caloric content.
Physicochemical evaluation
The difference in the physicochemical parameters of the pulp, leaf extract and leaf infusion is that the A. muricata fruits are sweet and acidic because simple sugars and organic acids are synthesized when ripe. In contrast, the leaves are the medium for photosynthesis and constant plant respiration, but they do not store these metabolites (Pinto et al., 2005). The highest titratable and total soluble solids were found in formulations F2, F4, and F6 due to 30% added pulp (13.59 °Brix and 1.56% of acidity) to these formulations. The physicochemical parameters found in this experiment are not comparable with soursop juices or nectars (14.3-15.0 °Brix, 3.85-4.6 pH, and 0.20-0.41 % acidity) reported previously (Ndife et al., 2014) that are considered sugar-sweetened beverages and could cause obesity and diabetes (Chávez et al., 2018). Therefore, it can be inferred that the prepared beverages in this research have a low caloric content.
On the other hand, acidity and pH contribute to the preservation and maintaining organoleptic properties that, together with TSS (°Brix/acidity ratio), exhibit a quality indicator of beverages (Taylor, 2016). The taste of the beverages is influenced by the °Brix/acid ratio, which increases with increasing sugars and decreasing acids. Thus, the beverages with the highest °Brix/acidity ratio could be preferred (Jordan et al., 2001). In addition, soursop juices (50% pulp) and nectars (35% pulp) show more luminosity and exhibit white tones (Dias et al., 2015; Anaya-Esparza et al., 2017); however, when leaf extract was added to the beverages, they would have a yellowish-white color (Guimarães et al., 2019).
Total soluble phenols and antioxidant capacity
It has been reported that the leaves and pulp of A. muricata are rich in secondary metabolites; however, the method and solvent of extraction of these metabolites are decisive (Aguilar-Hernández et al., 2020b). Ultrasound-assisted extraction is more efficient for causing plant cell rupture and extracting a higher content of soluble phenolic compounds than thermal extraction (infusion) or extraction by shaking at room temperature (Aguilar-Hernández et al., 2019). Therefore, a higher content of TSP was found in leaf extract when water was used as an extraction solvent, and insoluble compounds such as tannins, hydrolyzable polyphenols and acetogenins were lower (Nolasco-González et al., 2022).
The content of TSP and antioxidant capacity of the beverages experimented with in this work have not been reported yet. Therefore, comparing the soluble phenols and antioxidant capacity results with other reports is inappropriate because extraction and measurement methodologies differ. Nonetheless, the formulations of this work can be compared with other beverages described as functional. Preciado-Saldaña et al. (2019) reported 66.77 mg/100 ml of TSP from green tea (using 4.9 g of green leaves for 100 ml of water), 14.80 mg/100 ml from Hibiscus sabdariffa L. extract (using 4.9 g of flowers for 100 ml of water) or 34.07 mg/100 ml in the combination of Hibiscus sabdariffa extract and green tea (7:3 v/v). In this regard, the combination of A. muricata pulp and leaf extract exhibited higher content of phenolic compounds than those reports, but it depends on the quantity of pulp or leaf extract. It has been suggested that the intake of phenolic compounds in values higher than 600 mg/day/per adult person protects against chronic diseases (Cereceres-Aragón et al., 2019). Thus, 250 ml (1 cup) of formulations F4 or F8 could provide 47% of recommended daily intake.
The highest antioxidant capacity by DPPH assay in beverages and leaf infusion is attributed to major soluble phenolic compounds in beverages, since it has been reported that the DPPH radical is neutralized mainly by hydrophilic compounds (Foti et al., 2004). In contrast, the presence of flavonoids, tannins, alkaloids, and ACGS in pulp, leaf extract and beverages exhibited chelating capacity of Fe2+ and ABTS radical scavenging (Pérez-González et al., 2012; León-Fernández et al., 2019). Thus, the formulated beverages in this experiment exhibited different mechanisms to neutralize free radicals indicating that they are a good source of antioxidants. These antioxidants can neutralize oxidative stress and decrease inflammation, DNA damage, plasma glucose, etc. (Cong et al., 2020; Gunathilake, 2020).
The simple lattice mixture design was used to obtain an optimal formulation, where the mixture regression model explained up to 84% and 99% of the variability in the experimental data (Kumar et al., 2010; Akonor, 2020). In this study, the models explained up to 96% of the variability of the experimental data from mixture design, and the fit for TSP in the regression model was R2=0.96.
On the other hand, the Cox response trace plot is a statistical tool that demonstrates the behavior of the response variables when the proportion of each component in a mixture change. Thus, the regression model and the Cox plots allowed us to predict the ratio of each element that must be used to get the highest content of TSP and antioxidant capacity in beverages (Akonor, 2020). Also, the contour plot of the mixture design allowed us to see the interaction between the components according to the model equation, where the values of each element converge at a point to obtain the maximum values in the response variable (Verduga et al., 2022). This type of analysis has been used to formulate beverages and other foods, where the predictive models had significant adjustments (R2=0.727), and this gives certainty to have an excellent relationship between the proportion of raw materials used and their effect on the response (Verduga et al., 2022).
Sensory evaluation
Some formulated beverages in the first sensory evaluation with the highest leaf extract (50%) and the lowest pulp content (20%) had unpleasant tastes and odors. It can be attributed to the highest quantity of phytochemicals in the leaf extract that conferred bad taste (Oliveira et al., 2014). In beverages like green tea, the phenolic compounds affect sensory characteristics such as color, flavor, and taste (Oliveira et al., 2014). These phenolic compounds, such as flavonoids, tannins, and terpenoids, are responsible for bitterness and astringency (Oliveira et al., 2014). However, the percentage of pulp (25-30%) and sweeteners (stevia and saccharose) in the selected beverages achieved high acceptance by consumers despite including 30 or 50% leaf extract in the second sensory analysis. This is attributed to the samples predominantly conserving aroma and taste of soursop pulp.
Comparison of the physicochemical parameters and content of bioactive compounds between beverages
The critical changes in physicochemical parameters between beverages were the color and the °Brix/acidity ratio. Concerning this, in commercial beverages, the pulp percentage (10% pulp) with low acidity explains the high °Brix/acidity ratio, and the addition of titanium dioxide explains the white color. In contrast, the high yellow color of the selected beverage is justified by the leaf extract having been obtained by ultrasound, and it has been reported that ultrasound extracts more yellow compounds from leaves (such as terpenoids or carotenoids) than a thermal treatment to obtain the infusion (Nolasco-González et al., 2022). In addition, the highest content of bioactive compounds in the selected beverage is also influenced by the method to obtain the leaf extract. Nolasco-González et al. (2022) reported that the assisted-ultrasound extraction of bioactive compounds from A. muricata leaves was more effective than thermal treatment (infusion) by the cavitation effect that causes cellular fragmentation, allowing a high solvent transference into vegetal cells and extracting more phenolic compounds, alkaloids, and acetogenins.
Chemical profiling of the selected beverage
Cinnamoside is a terpene glycoside that has not been reported in Annona muricata. However, Nguyen et al. (2020) reported the presence of terpenoids in the seed extract of A. muricata. Phenolic compounds such as gallotanins and glycosylated derivates have widely been identified in the leaf extracts (George et al., 2015; Nolasco-González et al., 2022) and pulp (Jiménez et al., 2014; Aguilar-Hernández et al., 2019) of A. muricata. The alkaloids reticuline and coclaurine have also been reported in A. muricata leaves, and reticuline is the most abundant (Fofana et al., 2012). For example, reticuline has been quantified in the pulp (0.091 mg/100 g dry weight) and in leaves (5.76 mg/100 g dry weight) (Kotake et al., 2004). Likewise, the acetogenins annohexocin, murihexocin A, murihexocin B, muricoreacin, annomuricin E, annomuricin C, muricatalin, annopentonicin C, and annonacin found in this work have been identified in A. muricata leaves (Coria-Téllez et al., 2018). In addition, annonacin and annoreticuin-9-one have been identified in A. muricata pulp, while bullatacin and annoglaxin have been reported from A. muricata seeds (Coria-Téllez et al., 2018). Therefore, for the first time we tentatively identified a terpenoid, bullatacin, and annoglaxin in the mixture of leaf extract and pulp of A. muricata.
Quantification of phenolic compounds and acetogenins
Rutin, epicatechin, quercetin, and kaempferol have already been reported in pulp (in minor concentration) or a leaf extract (in significant concentration) of A. muricata using assisted extraction by ultrasound (Aguilar-Hernández et al., 2019; Cercato et al., 2021; Nolasco-González et al., 2022); however, the combination of these two components enriched its content in the selected beverage with phenolic compounds, principally flavonoids.
The annonacin isomers are the most representative (70%) acetogenins in pulp and leaf extracts (Champy et al., 2005). The latter authors quantified 10.9 mg/100 ml of annonacin in A. muricata juice and nectar, while infusion had 0.056 mg/100 ml, indicating that despite the hydrophobicity of acetogenins, they can be extracted in an aqueous medium.
In this context, the selected beverage of this experiment is shown to be a beverage with functional potential due to its alkaloids, phenolic compounds, and acetogenins. It has been demonstrated that phenolic compounds are anti-inflammatory, anti-microbial, anti-tumor, and antidiabetic agents mainly attributed to their potent antioxidant properties as free radical scavengers (Gullón et al., 2017). Also, alkaloids can act as antidepressant agents due to their affinity for the 5-HT1A receptors in vitro and participate in dopamine biosynthesis (Hasrat et al., 1997). Finally, the main biological activities of acetogenins are antimicrobial (López-Romero et al., 2022) and anti-cancer. It has been demonstrated that acetogenins have antitumoral action against a wide diversity of in vitro and in vivo models (cancer cell lines such as colon, breast, ovary, kidney, lung, pancreas, lymphoma, stomach, among others) (Coria-Tellez et al., 2018; Roduan et al., 2019).
Conclusions
The beverage with the highest content of total soluble phenols and antioxidant capacity, and good sensorial acceptability in flavor and appearance, was the formulation F8 with 25% pulp, 50% leaf extract, and 50% water. In addition, the combination of pulp and leaf extract to prepare the selected beverage (F8) increased the content of other bioactive compounds compared with an infused beverage and a commercial beverage of A. muricata. The most important bioactive compounds identified and quantified in the selected beverage were phenolic compounds and acetogenins; therefore, this beverage can be potentially functional and can contribute to the health of consumers.

