


 text new page (beta)
 English (pdf)
 Article in xml format
 Article references
 Send this article by e-mail
 Cited by SciELO
  Similars in
SciELO
Similars in
SciELO 
 Permalink
Introduction
Cashew (Anacardium occidentale L.) is native to Brazil and grown in tropical regions to produce cashew kernels, one of the edible nuts most commercialized on the international market (Brainer and Vidal, 2018) (Fig. 1). Brazilian production of cashew is concentrated in the northeastern region of the country, where the plant has socioeconomic importance, mainly in the semiarid region, for generating jobs and income in the dry season (Brainer and Vidal, 2018). In 2020, the Brazilian production of cashew nuts reached about 429,316 tons (IBGE, 2020).
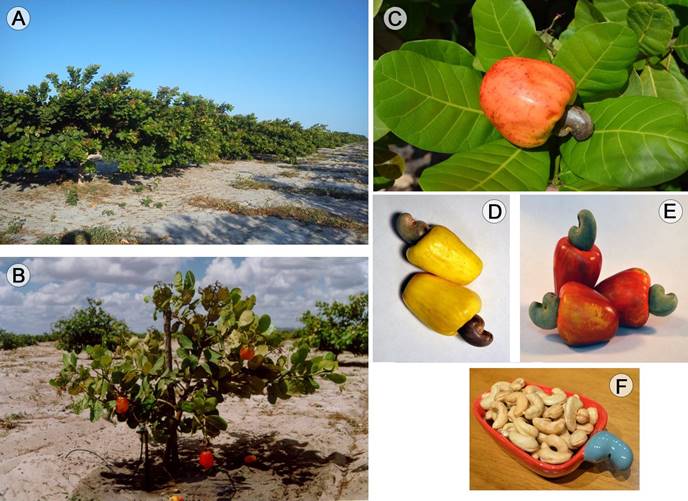
Figure 1: Morphological aspects from early dwarf cashew. A. early dwarf trees plantation; B. early dwarf cultivar BRS 189; C. fruit and pseudofruit of BRS 226; D. fruit and pseudofruit of EMBRAPA 50; E. fruit and pseudofruit of CCP 1001; F. cashew nuts. Sources: A. Luiz Augusto L. Serrano; B. Cláudio Norões; C-F. Ana Elisa Sidrim.
In Brazil, the production of cashew nuts increased due to the introduction of early dwarf cashew cultivars in the 1980s (Figueirêdo et al., 2016). These cultivars are more productive, easy to grow, and more disease resistant than other commercial cultivars. However, there is currently a small number of cashew cultivars. Thus, it becomes necessary to identify kinship relationships between cashew cultivars to select genotypes with favorable characteristics for cultivation and consumption, such as plant height, disease resistance and nutritional quality of the kernel (Serrano and Pessoa, 2016).
The cashew tree is mainly known for the production of two natural products: the cashew nut (the fruit) and the pseudofruit (an expanded and fleshy peduncle) (Fig. 1 C, D, E, F). The nuts (main commercial product) have a much broader market. They are consumed in nature as whole almonds or fragmented which are mainly used as recipe ingredients (cakes, pastries, candies and chocolates), enriching their taste and appearance (Gadani et al., 2017). The peduncle is largely consumed as fresh fruit and in the form of juice and derivative (Carneiro et al., 2019).
Despite the great foreign market designed especially for nuts consumption, the peduncle, although it has good potential for industrialization, has been poorly explored (Freitas et al., 2020). Therefore, a great improvement to the industry of such attractive products would be generating cultivars with both quality desirable for peduncles and nuts consumption. As shown in Table 1, Brazilian early dwarf cashew cultivars have great advantage, because it is possible to find plants specifically reliable to peduncle consumption, such as BRS 189, and for the nuts market, as such BRS 274 and 275, which have higher cashew nuts production (Cavalcanti and Barros, 2009).
Table 1: Main agro-industrial characteristics of 6-year-old cashew cultivars under experimental conditions in the municipality Pacajus, Ceará state (CE), Brazil. Sources: Cavalcanti and Barros, 2009; Cavalcanti et al., 2013; Vidal Neto et al., 2013.
| Cultivars | Type | Peduncle color | Mean peduncle weight (g) | Nut weight (g) | Kernel weight (g) | Parental relation |
| CCP 06 | Early dwarf | yellow | 76.5 | 6.4 | 1.6 | CP 06 (dwarf) individual phenotypic selection |
| CCP 09 | Early dwarf | orange | 87 | 7.7 | 2.1 | CP 09 (dwarf) individual phenotypic selection |
| CCP 76 | Early dwarf | orange | 135 | 8.6 | 1.80 | CP 76 (dwarf) individual phenotypic selection |
| CCP 1001 | Early dwarf | orange | 84.6 | 7.0 | 1.90 | CP 1001 (dwarf) individual phenotypic selection |
| EMBRAPA 50 | Early dwarf | yellow | 111 | 11.2 | 2.9 | individual phenotypic selection in CP 06 (dwarf) × CP 07 (common) progeny |
| EMBRAPA 51 | Early dwarf | reddish | 104 | 10.4 | 2.6 | phenotypic selection in a polycross progeny |
| BRS 253 | Early dwarf | reddish | 91.3 | 10.2 | 2.7 | 96 (P96D) |
| BRS 274 | common clone | orange | 128.6 | 16 | 16.00 | individual phenotypic selection in a segregated population |
| BRS 275 | hybrid between an early dwarf and a common clone common | orange | 108 | 11.0 | 11.4 | individual phenotypic selection within CCP 1001 (dwarf) × CP 12 (giant common) control-pollinated progeny |
| BRS 226 | orange | 102.6 | 9.75 | 2.72 | individual phenotypic selection | |
| BRS 189 | Early dwarf | reddish | 155.4 | 7.9 | 2.1 | individual phenotypic selection within CCP 1001 (dwarf) × CCP 76 (dwarf) control-pollinated progeny |
| BRS 265 | Early dwarf | reddish | 118,2 | 12.5 | 2.8 | individual phenotypic selection within CCP 76 (dwarf) open pollinated progeny |
Studies on genetic divergence provide parameters for identifying potential parents for crossbreeding that generate a greater heterotic effect, heterozygosity, and the probability of obtaining superior genotypes in segregating generations (Sethi et al., 2016). In cashew, for example, it is interesting to improve the characteristics of its kernels, such as size and nutritional quality. This is because from larger and healthier cashew nuts (high nutritional value), the industry offers good products to obtain higher consumption standards. Therefore, larger nuts are more attractive to consume as whole nuts, a larger market with higher prices. In addition, the large widespread consumption of cashew nuts is due to its nutritional properties. These properties are mainly linked to the high content of lipids and proteins (Salehi et al., 2019; Oliveira et al., 2020).
Such studies have been widely carried out from the implementation of molecular tools such as RAPD (Random Amplified Polymorphic DNA) and ISSR (Inter Simple Sequence Repeats) markers. Both markers are highly polymorphic, of low cost, and easily used in experiments. In addition, using more primers with different sequences increases the coverage of the plant genome by allowing access to distinct genomic regions (Nadeem et al., 2018).
The markers used in this work can access different regions of the DNA, performing a great screening to inform the differences between genetically close plants. The use of molecular markers has been promising in the study of genetic variability in cashew germplasm (Sethi et al., 2016; Thimmappaiah et al., 2016). This work also aimed to evaluate the physicochemical characteristics of almonds from twelve cashew cultivars and to study the genetic diversity among them to identify superior genotypes for future breeding programs.
Material and Methods
Description of cashew cultivars and sampling
Twelve cashew cultivars were evaluated. Among them, ten were early dwarf (CCP 06, CCP 09, CCP 76, CCP 1001, EMBRAPA 50, EMBRAPA 51, BRS 189, BRS 226, BRS 253, BRS 265), one hybrid between an early dwarf and a common clone (BRS 275), and one common clone (BRS 274) (Table 1). All cultivars were from the Cashew Breeding Program of Embrapa Agroindústria Tropical, Fortaleza, Ceará state, Brazil. Figure 2 shows the geographic origin of cultivars.
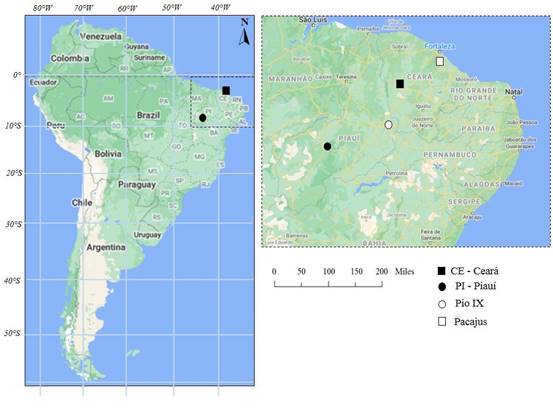
Figure 2: Geographic origin of cashew tree for this study in Brazil. Pacajus (-4.17398, -38.4638) at the Ceará and Pio IX (-6.84773, -40.5836) at the Piauí.
Leaf and kernel samples for each cultivar were collected from trees located on the experimental field of the Embrapa Agroindústria Tropical Cashew Germplasm Bank (BAG Cashew), in Pacajus, Ceará, Brazil. All trees in the BAG Cashew are identified, documented, characterized, and subsamples of all accessions are deposited in the Germplasm Bank of Embrapa Recursos Genéticos and Biotecnologia, Brasilia, an accredited institution for reference samples.
Ten cashew nuts of each cultivar were manually harvested and detached from the peduncle and sent to the Laboratory of Biochemistry, at the Universidade Federal Rural do Semi-Árido, Mossoró, Rio Grande do Norte, Brazil. Plastic bags with kernels were kept at room temperature until the start of the experiments. The young leaves of the same cultivars were collected, stored in plastic bags and kept on ice until reaching the Laboratory of Plant Biotechnology, at the Universidade Federal Rural do Semi-Árido, Mossoró, Rio Grande do Norte, Brazil. Samples were then stored at -20 °C temperature and DNA isolation was performed next.
Physicochemical traits evaluation
The physicochemical traits were evaluated from previously steamed cashew kernels. Upon steaming, cashew kernels were dried at room temperature and then crushed in a mortar. The following parameters were analyzed, following methods described by the Adolfo Lutz Institute (IAL, 2008): pH, titratable acidity, moisture, ash, lipids, and proteins (Table 2).
Table 2: Physicochemical characterization of twelve cashew cultivars kernels.
| Cultivars Identification | pH (%) | Acidity (%) | Moisture (%) | Ashes (%) | Proteins (%) | Lipids (%) |
| EMBRAPA 50 | 6.98 | 0.78 | 7.36 | 2.80 | 29.4 | 43.5 |
| EMBRAPA 51 | 6.73 | 0.70 | 5.98 | 2.78 | 26.6 | 48.4 |
| CCP 06 | 6.92 | 0.71 | 7.20 | 3.06 | 30.9 | 48.5 |
| CCP 09 | 6.80 | 0.88 | 6.02 | 2.72 | 23.6 | 46.5 |
| CCP 76 | 6.82 | 0.90 | 7.73 | 3.09 | 27.1 | 44.2 |
| CCP 1001 | 6.92 | 0.73 | 3.36 | 2.27 | 27.4 | 46.8 |
| BRS 189 | 6.91 | 0.85 | 6.00 | 2.94 | 34.2 | 39.7 |
| BRS 226 | 6.80 | 0.81 | 6.61 | 2.80 | 25.7 | 50.3 |
| BRS 253 | 6.81 | 0.76 | 12.50 | 2.53 | 29.6 | 54.6 |
| BRS 265 | 6.89 | 0.84 | 6.78 | 2.93 | 31.0 | 47.6 |
| BRS 274 | 6.83 | 0.90 | 6.24 | 2.35 | 26.3 | 54.0 |
| BRS 275 | 6.76 | 0.81 | 7.99 | 2.88 | 31.6 | 46.2 |
| Mean | 6.85 | 0.81 | 6.98 | 2.76 | 28.62 | 47.53 |
| Standard deviation | 0.08 | 0.07 | 2.11 | 0.26 | 3.01 | 4.19 |
The BRS 253 cultivar was discarded from this part of the study because, at the beginning of the experiment, cashew kernels from this clone had high moisture due to the peel removal. During the execution of the experiments, it was hard to obtain more samples from this cultivar.
For pH analysis, a 3.0 g fresh nut was placed in 30 ml of distilled water, and the pH was measured directly with a potentiometer (Fisherbrand™, AE150, Massachusetts, USA). This same solution was used to determine acidity. For this purpose, three drops of phenolphthalein were added and then the solution was titrated with 0.1 M sodium hydroxide (NaOH). In the pH analysis, the concentration of free hydrogen ions (H3O+) in solution is determined. Acidity is a measure of the organic acids present in the solution, which can be either weak acids (they do not completely dissociate in water) or strong acids (they completely dissociate in water).
Many acids cannot completely dissociate in water. These acids have a low dissociation constant (Ka), generating a low concentration of H3O+ in solution. This can cause differences in the values of acidity and pH, as the acidity can be high, but the composition of acids can be mostly weak acids, generating little H3O+ in solution and low pH value.
To determine moisture, 5.0 g of fresh nut weighed in a porcelain crucible were dried in an oven (at 105 °C for 4 h) and then in a desiccator. For ashes, 2.0 g of dried nut from moisture analysis weighed in a crucible were placed in a muffle at 550 °C and kept for 6 h, and then the sample was weighed, after being cooled in a desiccator.
Lipids were extracted using hexane in a Soxhlet extractor (HMK21043, Beijing, China). 1.0 g sample weighed (dried nut) in a cartridge was dissolved with 125 ml hexane. Then, the residue was placed in an oven at 105 °C and in a desiccator.
Crude protein was determined according to the Kjeldahl Method (Kirk, 1950). 0.5 g of sample (dried nut) was digested with 200 mg of catalytic mixture (potassium sulfate and copper sulfate at 9:1 ratio) and 5 ml of sulfuric acid. Then, the digested solution was distilled using 20 ml of NaOH (40%), 10 ml of boric acid (4%), and a mixed indicator (bromocresol green and methyl red) to receive the ammonia released in the chemical reaction. Subsequently, the distillate obtained was titrated with 0.1 N hydrochloric acid (HCl).
The physicochemical characteristics of cashew kernels (pH, titratable acidity, moisture, ash, lipids, and proteins) were evaluated in triplicate in a completely randomized experimental design. Data were submitted to one-way analysis of variance (one factor = cashew cultivars), and the significant differences between the means of each genotype were evaluated by the Tukey test at 5% probability level in Past software v. 4.03 (Hammer et al., 2001).
To assess the physicochemical diversity among cashew cultivars, we used an UPGMA cluster analysis, as implemented in the software Genes v. 2013 (Cruz, 2013). A genetic dissimilarity matrix was constructed using the Euclidean coefficient and a cluster analysis by ANOVA was performed based on the mean of the distances. To validate this clustering, the cophenetic correlation coefficient (CCC) was calculated using the dissimilarity between the cultivars as a measure of genetic distance.
DNA analysis
DNA was extracted from fresh leaves of each cultivar using the CTAB method as described by Ferreira and Grattapaglia (1995). Then, the DNA quality was checked using electrophoresis under 80 V for 30 min in 1% agarose gel stained with ethidium bromide (10 mg ml-1). Subsequently, the gel was photographed under UV light on an image system (Bio-Rad, Gel Doc 2000, San Diego, USA) and the samples were compared with DNA quantification standard from DNA lambda for further dilution to 10 ng μl-1.
The DNA samples were amplified using eight ISSR primers (Table 3). The amplification reactions comprised a 12 μl final volume, containing 1.2 μl of 10X reaction buffer (20 mM Tris-HCl pH 8.0, 100 mM KCl, and 3.2 mM MgCl2), 1.0 μl of dNTP (0.25 mM), 2.0 μl of DNA (10 ng μl-1), 2.0 μl of each primer (0.2 μM), 0.2 μl of Taq DNA Polymerase (5 U μl-1), and ultrapure water (5.6 μl). The amplification reactions were carried out in a thermocycler (Bio-Rad, Gel Doc 2000, San Diego, USA), programmed for an initial denaturation (at 94 °C for 4 min), followed by 35 cycles of denaturation (at 94 °C for 40 s), annealing (at 40, 45 or 50 °C, depending on the primer), and an extension (at 72 °C for 1 min), followed by a final extension (at 72 °C for 2 min). Successful amplification was checked by agarose electrophoresis (1.5% agarose gel ran for 220 min at 110 V, stained with 10 mg ml-1 ethidium bromide, and visualized under UV light on an image system (Bio-Rad, Gel Doc 2000, San Diego, USA).
Table 3: The extent of DNA polymorphism in twelve cashew cultivars generated by eight different ISSR and 15 RAPD primers. Tm=annealing temperature, NAF=number of amplified of fragments, NPF=number of polymorphic fragments. *R=A/G; Y=C/T. Adapted from Santana et al. (2011), with modifications.
| Primer (5'-3') | Nucleotide sequence (5'-3') | Tm (°C) | NAF | NPF | % Polymorphic loci |
| ISSR | |||||
| DiGA3'C | GAGAGAGAGAGAGAGAC | 45 | 4 | 4 | 100 |
| DiGA3'T | GAGAGAGAGAGAGAGAT | 40 | 6 | 6 | 100 |
| TriAAG 3'RC | AAGAAGAAGAAGAAGRC | 40 | 3 | 2 | 66.6 |
| TriAGG 3'RC | AGGAGGAGGAGGAGGRC | 45 | 5 | 5 | 100 |
| TriTCA 3'RC | TCATCATCATCATCARC | 40 | 4 | 4 | 100 |
| TriTCT 3'RC | TCTTCTTCTTCTTCTRC | 40 | 3 | 3 | 100 |
| TriCAT 3'RC | CATCATCATCATCATRC | 50 | 7 | 7 | 100 |
| TriCGA 3'RC | CGACGACGACGACGARC | 45 | 3 | 3 | 100 |
| Total | 35 | 34 | |||
| Mean | 4.3 | 4.2 | 95.8 | ||
| RAPD | |||||
| OPA 01 | CAGGCCCTTC | 40 | 5 | 4 | 100 |
| OPA 02 | TGCCGAGCTG | 40 | 14 | 14 | 100 |
| OPA 07 | GAAACGGGTG | 40 | 5 | 4 | 80 |
| OPA 08 | GTGACGTAGG | 40 | 10 | 10 | 100 |
| OPA 10 | GTGATCGCAG | 40 | 6 | 6 | 100 |
| OPA 12 | TCGGCGATAG | 40 | 7 | 7 | 100 |
| OPA 14 | TCTGTGCTGG | 40 | 7 | 7 | 100 |
| OPA 19 | CAAACGTCGG | 40 | 11 | 11 | 100 |
| OPAA 03 | TTAGCGCCCC | 40 | 4 | 4 | 100 |
| OPAA 07 | CTACGCTCAC | 40 | 8 | 8 | 100 |
| OPD 05 | TGAGCGGACA | 40 | 9 | 9 | 100 |
| OPD 09 | CTCTGGAGAC | 40 | 9 | 9 | 100 |
| OPH 01 | GGTCGGAGAA | 40 | 9 | 9 | 100 |
| OPH 07 | CTGCATCGTG | 40 | 7 | 7 | 100 |
| OPH 10 | CCTACGTCAG | 40 | 11 | 11 | 100 |
| Total | 122 | 120 | |||
| Mean | 8.1 | 9.2 | 98.6 |
The RAPD markers were obtained from amplifications with 15 arbitrary primers (Table 3) in reactions with a final volume of 12 μl. Reactions were prepared under the same conditions as described for the ISSR markers, except that primer concentration was 0.33 μM. Amplification was performed in a thermocycler (Bio-Rad, PTC-100®, California, USA) programmed for an initial denaturation at 94 °C for 5 min followed by 40 cycles consisting of: denaturation at 94 °C for 30 s, annealing at 40 °C, and extension at 72 °C for 1 min; followed by a final extension at 72 °C for 7 min. The amplification products were subjected to agarose electrophoresis under the same conditions as described for the ISSR markers.
Statistical analyses
Based on the analysis of the band pattern produced by each primer (RAPD and ISSR), a binary matrix was built with both molecular markers, attributing number one to the presence and zero to the absence of polymorphic bands. From the presence/absence matrix, a genetic dissimilarity matrix was obtained using the Euclidean coefficient, which was used as input for cluster analysis using the UPGMA clustering method (Faleiro, 2007), as implemented in the software Statistica v. 8 (Weiß, 2007). To compare the genetic diversity among the cultivars using the RAPD and ISSR markers and physicochemical attributes, a Mantel test approach to calculate Pearson’s correlation coefficient between the dissimilarity matrices was implemented in the software Statistica v. 8 (Weiß, 2007).
Results
Physicochemical traits
Cashew kernels from the twelve cashew cultivars evaluated showed pH values close to neutrality, 6.8 on average. Acidity was 0.81% on average, with values ranging from 0.70% to 0.90%, which corresponded to EMBRAPA 51 and BRS 274, respectively. The standard deviation was low (0.0007), so that no significant difference for acidity was observed among cultivars, according to the F test at 5% probability level. Moisture in cashew kernels was 6.69% on average, with 0.021 standard deviation. The contents of ashes, lipids and proteins in cashew kernels were 2.76, 47.2, and 28.6% on average. Table 2 shows the results of the physical and chemical properties of each variety. Figure 3A and Table 4 show the similarity relationships among accessions based on physicochemical traits. The supplementary material (Appendix) shows the results of ANOVAs for each characteristic that was tested to differentiate the cultivars.
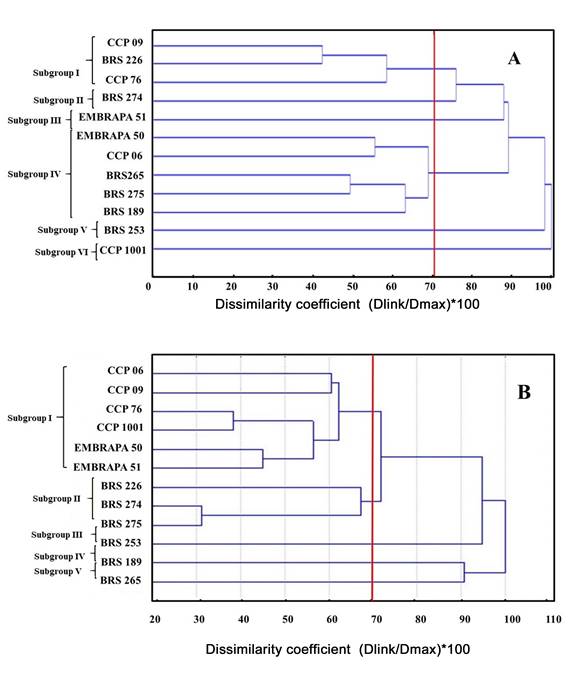
Figure 3: Dendrograms obtained from statistical analyses based on physicochemical (A) and molecular (B) data for the twelve cashew cultivars. A. the dendrogram was constructed using the UPGMA clustering method in the software Genes; B. the dendrogram was obtained in Statistica software. The red line indicates the cutoff point for arrangement of groups.
Table 4: Euclidean distance matrix based on physicochemical characters in twelve cashew cultivars determined using Euclidean coefficient.
| EMBRAPA 50 | EMBRAPA 51 | CCP 06 | CCP 09 | CCP 76 | CCP 1001 | BRS 189 | BRS 226 | BRS 253 | BRS 265 | BRS 274 | BRS 275 | |
| EMBRAPA 50 | 0.0 | 5.8 | 5.2 | 6.6 | 2.4 | 5.5 | 6.2 | 7.7 | 12.2 | 4.4 | 11.0 | 3.5 |
| EMBRAPA 51 | 0.0 | 4.4 | 3.5 | 4.5 | 3.2 | 11.5 | 2.1 | 9.4 | 4.5 | 5.6 | 5.8 | |
| CCP 06 | 0.0 | 7.6 | 5.7 | 5.5 | 9.4 | 5.5 | 8.2 | 1.01 | 7.2 | 2.5 | ||
| CCP 09 | 0.0 | 4.5 | 4.6 | 12.5 | 4.3 | 11.9 | 7.5 | 7.9 | 8.2 | |||
| CCP 76 | 0.0 | 5.1 | 8.5 | 6.3 | 11.7 | 5.2 | 9.9 | 4.9 | ||||
| CCP 1001 | 0.0 | 10.2 | 5.09 | 12.2 | 5.07 | 7.8 | 6.3 | |||||
| BRS 189 | 0.0 | 13.6 | 16.9 | 8.5 | 16.3 | 7.2 | ||||||
| BRS 226 | 0.0 | 8.2 | 5.9 | 3.7 | 7.3 | |||||||
| BRS 253 | 0.0 | 9.1 | 7.10 | 9.7 | ||||||||
| BRS 265 | 0.0 | 7.9 | 1.95 | |||||||||
| BRS 274 | 0.0 | 9.60 | ||||||||||
| BRS 275 | 0.0 |
Genetic diversity
Analyses with the RAPD and ISSR markers generated a total of 163 DNA bands, from which 159 were polymorphic (Table 3). Thus, the joint analysis provided 97.5% of polymorphism. The average of bands per primer was 8.13 polymorphic bands for RAPD and 5.1 for ISSR.
Using ISSR markers, TriCAT 3'RC was the most informative primer, amplifying seven bands (Fig. 4). Using RAPD markers, the most informative primer was OPA 02, producing 14 bands (Fig. 5).
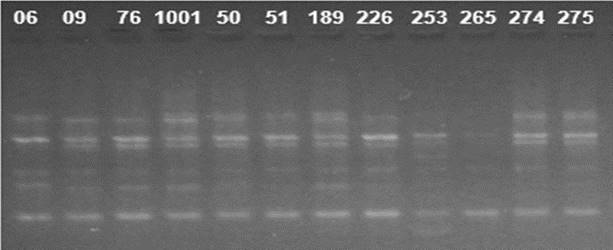
Figure 4: Amplification pattern of twelve cashew cultivars using the ISSR 04 primer. Numbers 06 to 275 correspond to the studied cultivars.
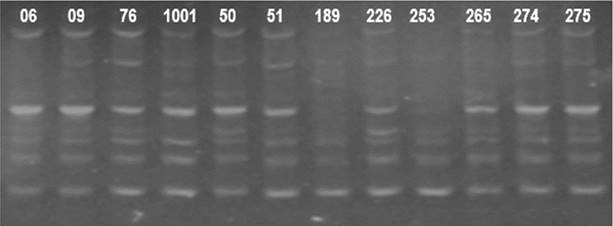
Figure 5: Amplification pattern of twelve cashew cultivars using the RAPD OPA 02 primer. Numbers 06 to 275 correspond to the studied cultivars.
The genetic dissimilarity coefficients among the twelve cashew cultivars ranged from 4.0 to 14.0. BRS 274 and BRS 275 were the cultivars with the highest similarity degree (4.0), while CCP 09 and BRS 189 were the most genetically distant (14.0, Table 5). Moreover, cutoff at 70% genetic similarity in the dendrogram arranged the cultivars into five subgroups (Fig. 3B).
Table 5: Euclidean distance matrix based on RAPD and ISSR molecular markers in twelve cashew cultivars determined using Euclidean coefficient.
| EMBRAPA 50 | EMBRAPA 51 | CCP 06 | CCP 09 | CCP 76 | CCP 1001 | BRS 189 | BRS 226 | BRS 253 | BRS 265 | BRS 274 | BRS 275 | |
| EMBRAPA 50 | 0 | 5.816 | 5.23 | 6.67 | 2.458 | 5.584 | 6.274 | 7.78 | 12.238 | 4.442 | 11.016 | 3.547 |
| EMBRAPA 51 | 0 | 4.484 | 3.557 | 4.593 | 3.219 | 11.556 | 2.199 | 9.488 | 4.551 | 5.635 | 5.823 | |
| CCP 06 | 0 | 7.671 | 5.767 | 5.524 | 9.477 | 5.543 | 8.203 | 1.015 | 7.272 | 2.544 | ||
| CCP 09 | 0 | 4.539 | 4.674 | 12.596 | 4.383 | 11.985 | 7.523 | 7.983 | 8.246 | |||
| CCP 76 | 0 | 5.163 | 8.584 | 6.365 | 11.726 | 5.264 | 9.972 | 4.937 | ||||
| CCP 1001 | 0 | 10.202 | 5.099 | 12.219 | 5.074 | 7.835 | 6.312 | |||||
| BRS 189 | 0 | 13.602 | 16.9 | 8.559 | 16.35 | 7.28 | ||||||
| BRS 226 | 0 | 8.275 | 5.953 | 3.795 | 7.317 | |||||||
| BRS 253 | 0 | 9.157 | 7.106 | 9.748 | ||||||||
| BRS 265 | 0 | 7.98 | 1.95 | |||||||||
| BRS 274 | 0 | 9.607 | ||||||||||
| BRS 275 | 0 |
Subgroup I clustered CCP 06, CCP 09, CCP 76, CCP 1001, EMBRAPA 50, and EMBRAPA 51. Subgroup II grouped BRS 226, BRS 274, and BRS 275. Subgroups III, IV, and V were composed only of one clone: BRS 253, BRS 189, and BRS 265, respectively.
Correlation analysis between molecular markers and physicochemical characteristics
The correlation coefficient (r=0.02) between the similarity matrices generated by the RAPD markers and physicochemical attributes was positive but not significant according to the Mantel test at 5% probability (p=0.49). Also, the correlation coefficient (r=-0.04) between the ISSR and physicochemical matrices was negative, and, although significant at 1% probability by the Mantel test, no correlation between these two matrices existed (p=0.01).
Discussion
Physicochemical traits
The pH we observed (6.8) was similar to that reported by Liu et al. (2019) in cooked (6.14) and raw (6.20) cashew kernels. Moisture in cashew kernels is relatively high, and moisture content differed significantly among cultivars. However, the BRS 253 cultivar was irrelevant for the study because, at the beginning of the experiment, cashew kernels from this clone had high moisture due to the peel removal.
Peel removal under water vapor conditions may explain the higher initial moisture in kernels. Also, the other factors may affect moisture content evaluation, such as the method used. Moreover, the size of cashew kernels may affect water retention and removal, and, as the size is genetically inherited, moisture differed significantly among cultivars. Akinhanmi (2008) and Liu et al. (2019) reported 7.2% and 3.04 moisture, respectively.
Regarding ashes, the content was close to the value of 2.80% found by Akinhanmi (2008). Ashes are the inorganic substances present in food, that is, the mineral content. Minerals are essential for diet because they act as cofactors in many physiological processes. Cashew kernels are rich in minerals, mainly selenium, which acts as a powerful antioxidant (Souza et al., 2017).
The lipid content found (47.2%) was similar to those found by Akinhanmi (2008) and Liu et al. (2019), 49.1 and 54.1%, respectively. Cashew nuts are rich in oleic and linoleic acids, fatty acids with therapeutic properties against cardiovascular diseases, besides controlling glycemia (Mohan et al., 2017).
On the other hand, the protein content (28.6%) in the present study was higher than that obtained by Griffin and Dean (2017) in raw kernels (17.2%), and lower than that found by Akinhanmi (2008), 36.3%. Despite the differences in these contents, results support that cashew nuts are an abundant source of protein and amino acids. Rich in these compounds, such cashew kernels are useful for the food industry in providing value-added products (Liu et al., 2018).
Genetic diversity
According to Colombo et al. (1998), generating 50 to 200 polymorphic fragments in such analyses is sufficient for estimating genetic relationships within and between species. Similarly, using RAPD and ISSR markers to assess genetic diversity among 40 cashew cultivars from India, Thimmappaiah et al. (2016) found 163 bands, from which 129 were polymorphic, corresponding to 79.6% polymorphism. Castro et al. (2016), using the same markers to study the genetic diversity among 56 grapevine cultivars, observed that 145 fragments were amplified, from which 116 were polymorphic bands, an 80% polymorphism. Thus, such results showed that both markers are effective in assessing genetic diversity.
Subgroup I junction in the dendrogram (Fig. 3B) is explained by the fact that CCP 09, CCP 76, and CCP 1001 were obtained from an individual phenotypic selection from a CCP 06 population. Also, because EMBRAPA 50 was generated from a cross between CCP 09 and CCP 76, the branch in the dendrogram joining the two cultivars is short, showing their genetic similarity. Moreover, EMBRAPA 51 originated within a cross-bred progeny of CCP 76, followed by clonal selection. Therefore, these latter cultivars are close to the group containing CCP 76 (Vidal Neto et al., 2013).
In Subgroup II, cultivars have different origins from the previous ones. BRS 226 was generated from an individual phenotypic selection of MAP-42, a mother plant of early dwarf cashew from Fazenda CAPISA, Piauí (Paiva and Barros, 2004). BRS 274, in turn, originated from an individual phenotypic selection of common cashews in a segregating population (Paiva, 2007a). On the other hand, BRS 275 was obtained by selection within a cross-pollination progeny, originating from cross between an early dwarf (CCP 1001) and a common cashew mother plant (CP 12) (Paiva, 2007b).
The clone BRS 253 in Subgroup III was generated by individual phenotypic selection from an early dwarf mother plant (P96D), which originated from a cross-bred progeny (Paiva, 2004). Thus, the origin explains why this clone was grouped apart.
Similarly, Subgroup IV grouped only the clone BRS 189. Although generated from the selection of progenies from crosses between CCP 1001 and CCP 76, BRS 189 was distant from its parents. Because the ISSR and RAPD markers can randomly access the DNA regions, common sequences between cultivars may not have been accessed in the analysis, which explains the way the cultivars were grouped (Vidal Neto et al., 2013).
Finally, Subgroup V contained only a cultivar originated from an individual phenotypic selection within open-pollinated progenies from the CCP 76 early dwarf cashew. However, both cultivars were not grouped because the markers did not access the common DNA sequences between them (Vidal Neto et al., 2013).
According to Pessoni (2007), the highest genetic diversity among cashew plants occurs within populations of the genus Anacardium, while lower variation results from differences among populations. Likewise, Carvalho et al. (2012) showed that 93.36% of the molecular variation among bushy cashew (Anacardium humile A. St.-Hill.) cultivars occurred within the population, while 6.64% was among those populations.
Analysis with the physicochemical markers showed that the genetic similarity between the cashew cultivars ranged from 2.199 to 16.900. BRS 189 and BRS 253 were the most genetically distant genotypes, while EMBRAPA 51 and BRS 226 were the closest ones (Table 4). In addition, cutoff at 70% genetic similarity arranged cultivars into six subgroups, as shown in the dendrogram (Fig. 3A). Subgroup I included CCP 09, BRS 226, and CCP 76. Subgroups II, III, V, and VII were composed just of BRS 274, EMBRAPA 51, BRS 253, and CCP 1001, respectively. Moreover, Subgroup IV was composed of EMBRAPA 50, CCP 06, BRS 265, BRS 275, and BRS 189. Furthermore, 0.63 cophenetic correlation coefficient (CCC) can be considered significant and of medium magnitude, indicating the consistency of the clustering.
Magalhães et al. (2018) found high genetic diversity among acerola (Malpighia emarginata DC.) cultivars, using physicochemical attributes. Similarly, using morphological characteristics, such as plant growth, flowering, fruit, and nut characters, Jena et al. (2016) found high variability among twelve cashew cultivars.
Regarding the origin, obtaining method, and respective parents of the twelve cultivars studied here (Paiva, 2004; 2007a, b; Vidal Neto et al., 2013), genetic diversity among the cultivars was low, considering the molecular analysis used. Also, the molecular data were not similar to the physicochemical ones.
Correlation analysis between molecular markers and physicochemical characteristics
Dasmohapatra et al. (2013), using ISSR markers and morphological traits to estimate genetic variability among 25 cashew varieties from India, obtained lower and non-significant correlation coefficient (r=0.005).
Environmental conditions influence the expression of physicochemical and other quantitative traits of agronomic interest. Also, such characteristics are subject to natural selection, which acts on genetic level, generating differences among plants of the same genus. Thus, plants with the same DNA sequences can express different DNA regions, which makes the correlation analysis difficult. However, despite the divergence between the generated clusters, some considerations must be made.
The cultivars BRS 189 and BRS 253 are distantly related, as shown in the dendrogram generated based on DNA markers (Fig. 3B). However, they had the highest protein and lipid contents, 34.2 and 54.6%, respectively. Such plants can be used in future breeding programs to improve the contents of these compounds.
CCP 1001 showed the lowest moisture (3.36%) among cultivars, pH close to neutrality (6.92), and low acidity (0.73%) (Table 2). Such attributes are important for the industry because they improve the conservation and taste of the cashew kernels. Also, moisture is difficult to determine because the process is influenced by peel removal and environmental conditions under which plants grow. In addition, because the cashew kernels from the CCP 1001 cultivar have low acidity, they can be eaten toasted, with good acceptance by consumers.
In conclusion, although the results obtained with the ISSR and RAPD markers were not similar, using more than one marker allows obtaining complementing results. It thus improves the strategies of conservation and the use of germplasm. There was no correlation between the molecular and physicochemical data and high variability was found among the cashew cultivars. The cashew kernels from the twelve cultivars studied here had low acidity and pH, considerable moisture and ash contents, and high protein and lipid contents. BRS 189, BRS 253, and CCP 1001 showed the best values for proteins, lipids, acidity, and pH. In addition, those cultivars have maximum distance genetic among them. Therefore, the results suggests that they are more suitable for breeding programmes.

