


 text new page (beta)
 English (pdf)
 Article in xml format
 Article references
 Send this article by e-mail
 Cited by SciELO
  Similars in
SciELO
Similars in
SciELO 
 Permalink
Introduction
Erythroxylum pauferrense Plowman (Erythroxylaceae) is a plant species endemic to northeastern Brazil, where it is popularly known as “Guarda-orvalho”. This species is an understory shrub, 1.5 to 4 m high, found only in Paraíba state, where its holotype originates from Areia city (Loiola et al., 2007). There are small subpopulations of this species in isolated fragments of humid forests, because its habitat has been destroyed by deforestation, reducing considerably the number of adult individuals. Therefore, E. pauferrense is listed in the “EN” category according to the Lista Vermelha da Flora do Brazil (CNCFlora, 2020), which means that it is an endangered species. Despite this, the species has high ecological importance, acting in the preservation of the endemic genetic resources of the regions of occurrence (Ribeiro et al., 2019c).
Given the importance of E. pauferrense, physiological studies on its growth, propagation, development, and reproduction become necessary. Therefore, studies for determining leaf area are relevant, since this growth variable is one of the most used to assess the ecophysiology of forest and crop species (Wang and Zhang, 2012; Santana et al., 2018). In addition, leaves gather characteristics that directly influence the interception and absorption of light for photosynthetic activity, transpiration rate, and stoma opening, thus affecting the metabolism and dry matter production (Spann and Heerema, 2010; Candido et al., 2013; Osnas et al., 2013; Schmildt et al., 2014; Taiz et al., 2017).
Leaf area can be determined by many methods, classified as direct (destructive and non-destructive) and indirect (non-destructive) (Peksen, 2007; Malagi et al., 2010; Sousa et al., 2015; Toebe et al., 2019). Direct methods are simple to perform and accurate, but laborious, in addition to becoming unviable for endangered species, plants smaller in size, and individuals at a growth stage in which it is not possible to remove leaves, because they can severely damage the plant (Mota et al., 2014; Schmildt et al., 2014). In contrast, indirect methods are quick to perform, precise for plants growing in different environmental conditions, and allow multiple evaluations in the same individual through regression equations, which is fitted using leaf blade dimensions (such as length and width), without destroying the sample (Bosco et al., 2012; Lima et al., 2012; Pompelli et al., 2012; Souza and Amaral, 2015; Ribeiro et al., 2019a).
Adjustment of regression equations to estimate leaf area has been employed for many forest species, such as Combretum leprosum Mart. (Candido et al., 2013), Acrocomia aculeata (Jacq.) Lodd. ex Mart. (Mota et al., 2014), Merremia aegyptia (L.) Urban (Assis et al., 2015), Juglans regia L. (Keramatlou et al., 2015), Handroanthus chrysotrichus (Mart. ex A. DC.) Mattos, Tabebuia impetiginosa (Mart. ex DC.) Standl., Tabebuia roseoalba (Ridl.) Sand. (Monteiro et al., 2017), Erythroxylum simonis Plowman (Ribeiro et al., 2018a), Erythroxylum citrifolium A.St.-Hil. (Ribeiro et al., 2019a), and Psychotria carthagenensis Jacq. and Psychotria hoffmannseggiana (Willd. ex Schult.) Müll. Arg. (Ribeiro et al., 2019b). For E. pauferrense, a regression model for estimating its leaf area is of fundamental importance, because it may contribute to future studies on the propagation, preservation, and conservation of this species in forest remnants of the Atlantic Forest. Therefore, this research aimed to obtain an equation from regression models that meaningfully estimate the leaf area of E. pauferrense using linear dimensions of its leaf blades.
Materials and Methods
The study was carried out in the Mata do Pau-Ferro (6°58'12''S, 35°42'15''W), a state park located in Areia city, Paraíba state, Northeast region, Brazil (Fig. 1). The conservation unit is situated in the Brejo Paraibano microregion, Agreste mesoregion, where altitudes reach 400 to 600 m, 22 °C average temperature, and 1400 mm average annual rainfall (Ribeiro et al., 2018b). Classified according to Peel et al. (2007) as Aw', the climate of the region is hot and humid tropical with autumn-winter rains.
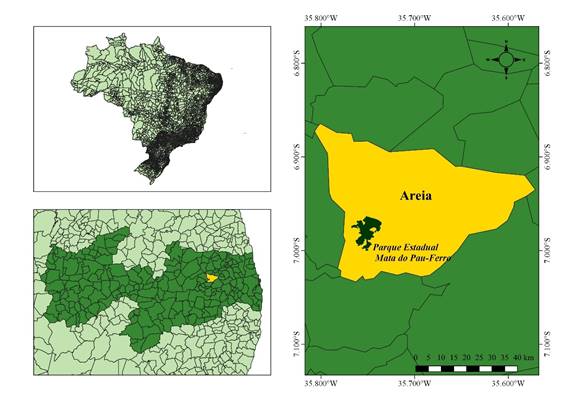
Figure 1: Geographic location of Parque Estadual Mata do Pau-Ferro, situated in Areia city, Paraíba state, Northeast Brazil.
For performing allometric measurements, 1200 leaves of different shapes and sizes were collected from E. pauferrense (herbarium EAN, Federal University of Paraiba, Campus II-CCA, voucher number 24843) in 50 mother plants (without damaging the plants), but choosing those healthy limbs without pest, disease and abiotic damages (Bianco et al., 2007; Lucena et al., 2011; Schmildt et al., 2014). As they were collected, the leaves were stored in thermal containers with ice to avoid water loss, and then transported to the Plant Ecology Laboratory, Federal University of Paraíba (Campus II). In the laboratory, maximum length (L) (cm) and width (W) (cm) of each leaf blade were measured using a millimetric ruler, as shown in Figure 2, and values were used to calculate the product of length by width (L.W) (cm²), length by length (L.L) (cm²), and width by width (W.W) (cm²). Moreover, to determine the real leaf area (LA) (cm²), each limb was photocopied using a scanner (Epson, model L395, Tokyo, Japan), and the images were processed and analyzed in ImageJ® (Powerful Image Analysis) software (Ribeiro et al., 2018a).
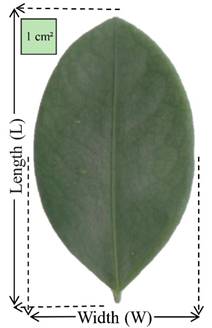
Figure 2: Linear dimensions (maximum length (L) and maximum width (W)) of leaf blade Erythroxylum pauferrense Plowman used to estimate leaf area.
A descriptive analysis was performed for L, W, L.W, L.L, W.W, and LA of all 1200 leaf blades, obtaining the minimum, maximum and average values, mean, total amplitude, median, variance, standard deviation, standard error, coefficient of variation, asymmetry, and kurtosis. Also, the data were analyzed for normality using the Lilliefors test.
Allometric equations were obtained by simple linear, linear without intercept, quadratic, cubic, power, and exponential regression models, as described in Table 1. Then, the equation that meaningfully estimated the leaf area of E. pauferrense based on linear dimensions of its leaf blade was selected by checking the following assumptions: higher determination coefficient (R²) and Willmott's index (d) (Willmott et al., 1981) (equation 1); lower Akaike information criterion (AIC) (Akaike, 1974) (equation 2) and root mean square error (RMSE) (Janssen and Heuberger, 1995) (equation 3); and the BIAS index closest to zero (Leite and Andrade, 2002) (equation 4). Statistical analyses were performed using the R package 'hydroGOF' (Zambrano-Bigiarini, 2020) in R software v.4.0.0 (R Core Team, 2020).
Table 1: Description of the regression models used to estimate the leaf area of Erythroxylum pauferrense Plowman.
| Model | Description (Equation) |
|---|---|
| Simple linear | LA=a+b*L |
| Simple linear | LA=a+b*W |
| Simple linear | LA=a+b*(L.W) |
| Linear without intercept | LA=b*(L.W) |
| Simple linear | LA=a+b*(L.L) |
| Simple linear | LA=a+b*(W.W) |
| Quadratic | LA=a*L 2 +b*L+c |
| Quadratic | LA=a*W 2 +b*W+c |
| Quadratic | LA=a*(L.W) 2 +b*(L.W)+c |
| Quadratic | LA=a*(L.L) 2 +b*(L.L)+c |
| Quadratic | LA=a*(W.W) 2 +b*(W.W)+c |
| Cubic | LA=a*L 3 +b*L 2 +L*C+d |
| Cubic | LA=a*W 3 +b*W 2 +C*W+d |
| Cubic | LA=a*(L.W) 3 +b*(L.W) 2 +C*(L.W)+d |
| Cubic | LA=a*(L.L) 3 +b*(L.L) 2 +C*(L.L)+d |
| Cubic | LA=a*(W.W) 3 +b*(W.W) 2 +C*(W.W)+d |
| Power | LA=a*Lb |
| Power | LA=a*Wb |
| Power | LA=a*(L.W)b |
| Power | LA=a*(L.L)b |
| Power | LA=a*(W.W)b |
| Exponential | LA=a*bL |
| Exponential | LA=a*bW |
| Exponential | LA=a*b(L.W) |
| Exponential | LA=a*b(L.L) |
| Exponential | LA=a*b(W.W) |
where:
Results
The leaf blades of E. pauferrense showed length (L) that ranged from 0.924 to 6.991 cm, with 3.925 cm on average and 6.067 cm amplitude, while width (W) ranged from 0.569 to 3.658 cm, with 2.130 on average and 3.089 cm amplitude. In turn, the product of length by width (L.W) varied from 0.773 to 25.397 cm², with 8.971 cm² on average and 24.624 cm² amplitude; product of length by length (L.L) differed between 1.848 and 13.982 cm², with 7.852 cm² on average and 12.134 cm² amplitude; and product of width by width (W.W) expressed values from 0.323 to 13.381 cm², 4.873 cm² on average and 13.057 cm² amplitude. Finally, leaf area (LA) ranged from 0.475 to 18.075 cm², 6.033 cm² on average, and 17.600 cm² amplitude (Table 2). Regarding variation in data, the lowest coefficients of variation were those from length and width (30.08 and 27.19%, respectively), whereas the highest coefficients were those from L.W (50.75%), L.L (45.03%), W.W (49.55%), and LA (51.78%) (Table 2).
Table 2: Minimum, maximum, mean, total amplitude, median, variance, standard deviation, standard error, coefficient of variation (CV), asymmetry, kurtosis, and Lilliefors test for normality of length (L), width (W), product of length by width (L.W), product of length by length (L.L), product of width by width (W.W), and leaf area (LA) of 1200 leaf blades of Erythroxylum pauferrense Plowman. a Asymmetry differs from zero by the t-test at 5% probability; b Kurtosis differs from three by the t-test at 5% probability; *Significant at 5% probability; ** Significant at 1% probability.
| Descriptive statistic | L (cm) | W (cm) | L.W (cm²) | L.L (cm²) | W.W (cm²) | LA (cm²) |
|---|---|---|---|---|---|---|
| Minimum | 0.924 | 0.569 | 0.773 | 1.848 | 0.323 | 0.475 |
| Maximum | 6.991 | 3.658 | 25.397 | 13.982 | 13.381 | 18.075 |
| Mean | 3.925 | 2.130 | 8.971 | 7.852 | 4.873 | 6.033 |
| Total amplitude | 6.067 | 3.089 | 24.624 | 12.134 | 13.057 | 17.600 |
| Median | 3.931 | 2.165 | 8.472 | 7.862 | 4.687 | 5.641 |
| Variance | 1.394 | 0.335 | 20.728 | 1.054 | 1.188 | 9.760 |
| Standard deviation | 1.180 | 0.579 | 4.552 | 2.358 | 2.414 | 3.124 |
| Standard error | 0.035 | 0.017 | 0.138 | 0.071 | 0.073 | 0.094 |
| CV (%) | 30.08 | 27.19 | 50.75 | 45.03 | 49.55 | 51.78 |
| Asymmetrya | -0.154 | -0.277 | 0.435 | -0.152 | 0.4128 | 0.512 |
| Kurtosis + 3b | 2.738 | 2.769 | 2.838 | 2.739 | 2.823 | 2.974 |
| Lilliefors | 0.0017** | 0.0158* | <0.0001** | 0.0018** | <0.0001** | <0.0001** |
Scatterplots between pairs of the variables L, W, L.W, L.L, W.W, and LA evidenced different relationships between them, suggesting adjustments of linear and non-linear models (Fig. 3).
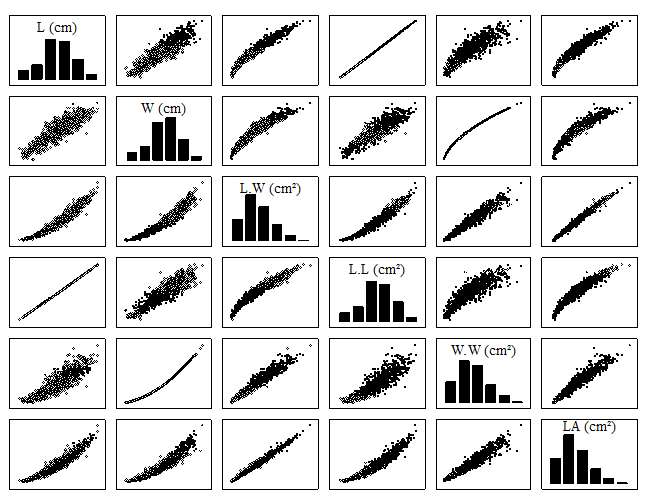
Figure 3: Histograms and scatterplots between length (L), width (W), product of length by width (L.W), product of length by length (L.L), product of width by width (W.W), and leaf area (LA) of Erythroxylum pauferrense Plowman.
Distribution of the 1200 leaf blades of E. pauferrense relative to different size classes is shown in Fig. 4. It was found that 58.6% of leaf areas were between 0.45 and 6 cm², indicating that most leaves from this forest species are small in size (Fig. 4).
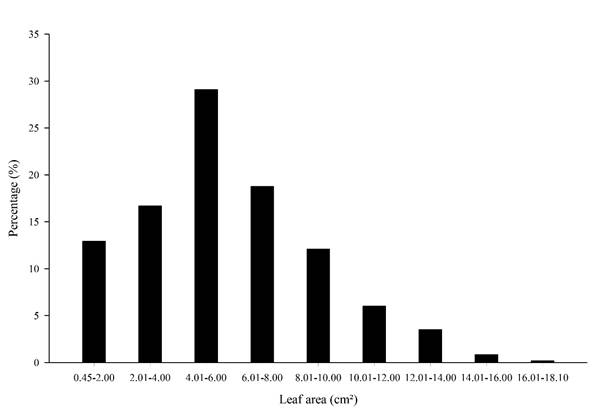
Figure 4: Percentage distribution of leaf area (LA) of 1200 leaf blades of Erythroxylum pauferrense Plowman by different size classes.
The regression models and adjusted allometric equations for estimating the leaf area (ŷ) as a function of linear dimensions of the leaf blades (L, W, L.W, L.L, and W.W) are shown in Table 3. Among the adjusted equations, the linear regression model without intercept (when the regression line does not pass through the origin) using the product of length by width (L.W) showed the highest R² (0.9960) and d (0.9953), lowest RMSE (0.4255) and AIC (1231.61), and BIAS index closest to zero (-0.0130) (Table 3). Therefore, ŷ=0.6740*L.W was the equation that best estimated the leaf area of E. pauferrense through the linear dimensions of its leaf blades. Moreover, this equation predicts that 67.40% variation in leaf area can be explained by the product of length by width (L.W).
Table 3: Regression models, equations, determination coefficient (R²), Akaike information criterion (AIC), root mean square error (RMSE), Willmott's index (d), and BIAS index for linear dimensions of leaf blades of Erythroxylum pauferrense Plowman. (1) Linear dimensions: length (L) and width (W).
| Model | x1 | Equation | R² | AIC | RMSE | d | BIAS |
|---|---|---|---|---|---|---|---|
| Linear | L | ŷ=-3.814+2.509*L | 0.8987 | 3064.66 | 0.9932 | 0.9727 | -0.0377 |
| Linear | W | ŷ=-4.759+5.066*W | 0.8821 | 3229.62 | 1.0718 | 0.9678 | -0.0495 |
| Linear | L.W | ŷ=-0.0636+0.6796*LW | 0.9810 | 1250.10 | 0.4297 | 0.9951 | -0.0296 |
| Linear (0.0) | L.W | ŷ=0.6740*LW | 0.9960 | 1231.61 | 0.4255 | 0.9953 | -0.0130 |
| Linear | L.L | ŷ=-3.842+1.257*LL | 0.9007 | 3043.84 | 0.9837 | 0.9733 | -0.0389 |
| Linear | W.W | ŷ=0.01467+1.23495*WW | 0.9106 | 2929.61 | 0.9332 | 0.9761 | -0.0365 |
| Quadratic | L | ŷ=-0.3010+0.4832*L+0.2641*L² | 0.9224 | 2777.17 | 0.8690 | 0.9795 | 0.0330 |
| Quadratic | W | ŷ=-0.1158+0.1364*W+1.2023*W² | 0.9102 | 2936.22 | 0.9352 | 0.9760 | 0.0396 |
| Quadratic | L.W | ŷ=0.1081+0.6355*LW+0.0022*LW² | 0.9814 | 1232.82 | 0.4257 | 0.9951 | 0.0230 |
| Quadratic | L.L | ŷ=-0.3702+0.2578*LL+0.0651*LL² | 0.9237 | 2760.23 | 0.8622 | 0.9799 | -0.0362 |
| Quadratic | W.W | ŷ=-0.0910+1.2847*WW-0.0046*WW² | 0.9107 | 2930.11 | 0.9325 | 0.9762 | -0.0365 |
| Cubic | L | ŷ=-0.1475+0.3358*L+0.3058*L²-0.0036*L³ | 0.9224 | 2779.04 | 0.8689 | 0.9795 | 0.0313 |
| Cubic | W | ŷ=1.0122-1.8363*W+2.2417*W²-0.1693*W³ | 0.9104 | 2934.65 | 0.9336 | 0.9761 | 0.0331 |
| Cubic | L.W | ŷ=0.0655+0.6551*LW-0.000012*LW²+0.00007*LW³ | 0.9814 | 1252.96 | 0.4307 | 0.9951 | 0.0239 |
| Cubic | L.L | ŷ=-0.2870+0.2179*LL+0.070*LL²-0.00024*LL³ | 0.9236 | 2762.19 | 0.8622 | 0.9799 | -0.0356 |
| Cubic | W.W | ŷ=0.2031+1.0397*WW+0.0468*WW²-0.0030*WW³ | 0.9111 | 2925.51 | 0.9297 | 0.9763 | -0.0358 |
| Potency | L | ŷ=0.4939*L1.7847 | 0.9226 | 2775.08 | 0.8689 | 0.9795 | 0.0319 |
| Potency | W | ŷ=1.252*W1.988 | 0.9103 | 2934.26 | 0.9352 | 0.9760 | -0.0276 |
| Potency | L.W | ŷ=0.6422*LW1.0193 | 0.9812 | 1240.80 | 0.4279 | 0.9951 | 0.0230 |
| Potency | L.L | ŷ=0.1429*LL1.7860 | 0.9237 | 2758.26 | 0.8622 | 0.9798 | -0.0304 |
| Potency | W.W | ŷ=1.2508*WW0.9943 | 0.9107 | 2929.40 | 0.9331 | 0.9761 | -0.0397 |
| Exponential | L | ŷ=1.159*1.485L | 0.9033 | 3036.43 | 0.9803 | 0.9724 | -0.0566 |
| Exponential | W | ŷ=0.9401*2.2839W | 0.8923 | 3149.88 | 1.0331 | 0.9691 | -0.0555 |
| Exponential | L.W | ŷ=2.503*1.094LW | 0.8923 | 2864.81 | 1.0331 | 0.9691 | -0.0555 |
| Exponential | L.L | ŷ=1.157*1.219LL | 0.9039 | 3029.25 | 0.9771 | 0.9726 | -0.0573 |
| Exponential | W.W | ŷ=2.552*1.177WW | 0.8426 | 3574.95 | 1.2571 | 0.9511 | -0.0852 |
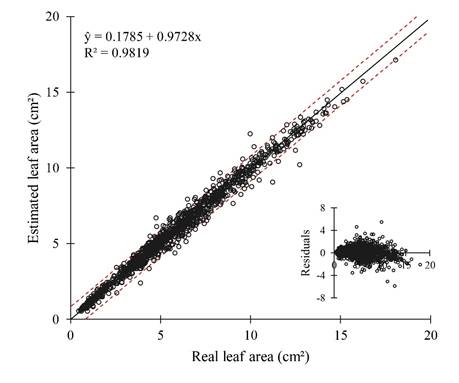
Data fit a normal distribution, and variances were homoscedastic, supporting that the equation ŷ=0.6740*L.W can meaningfully estimate the leaf area of E. pauferrense (Fig. 5). Moreover, the estimated leaf area using this equation positively correlated with the real leaf area, with a 0.9819 determination coefficient (R²) (Fig. 6).
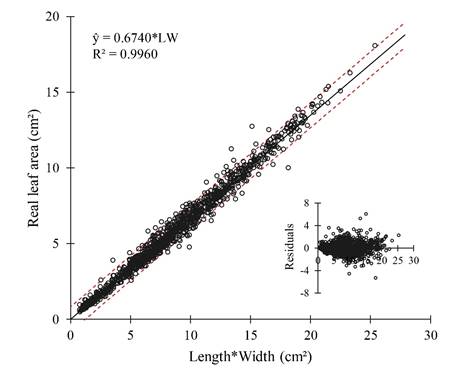
Figure 5: Relationship between the real leaf area (LA) and the product of length (L) by width (W) of leaf blades of Erythroxylum pauferrense Plowman, using the equation ŷ = 0.6740*LW. Residual dispersion pattern for this model is shown in the inserted chart.
Discussion
High values of amplitude, standard deviation, standard error and coefficient of variation found in this study are of fundamental importance in studies that estimate the leaf area using regression models (Levine et al., 2017; Oliveira et al., 2019a). Such great variation in the data indicates the reliability of models, which can represent large, medium, and small leaves, allowing measurements at different phenological stages of the plant (Pezzini et al., 2018). Thus, the number of leaves used in this study (1200) was adequate for estimating the leaf area of the species through linear dimensions. Moreover, high variation in L.W and LA values was also observed in previous studies (Schmildt et al., 2015, 2016; Leite et al., 2017; Ribeiro et al., 2018a, 2019b).
The coefficient of kurtosis (k) value less than 3 (k<3) is an indicative that all analyzed variables had a platykurtic distribution, expected for a normal distribution. This behavior shows that the frequency distribution function of the variables is more flattened than the normal distribution (Ribeiro et al., 2020). This distance from a normal distribution observed in all variables (L, W, L.W, L.L, W.W, and LA) occurred due to deviations in the coefficients of asymmetry and kurtosis. This behavior was also observed in previous studies with other plant species (Cargnelutti Filho et al., 2015; Carvalho et al., 2017a; Ribeiro et al., 2019a; Toebe et al., 2019).
Most leaves from this forest species are small in size. In other species from the Erythroxylaceae family, Ribeiro et al. (2018a, 2019a) reported similar results.
The determination coefficients (R²) were greater than 0.84, indicating that at least 84% variation in leaf area of E. pauferrense can be explained by the proposed equations. Also, the equations adjusted using the product of length by width (L.W) met the assumptions for estimating leaf area, thus best fitting the regression models (Carvalho et al., 2017b; Pezzini et al., 2018; Guimarães et al., 2019; Oliveira et al., 2019b), except for the exponential model, where best indexes were obtained using the product of length by length (L.L).
This same regression model was recommended to estimate the leaf area of other forest species, such as Combretum leprosum (LA=0.7103*L.W; Candido et al., 2013), Crotalaria juncea L. (LA=0.7390*L.W; Carvalho et al., 2017a), Tectona grandis L. f. (LA=0.4449*L.W; Braga et al., 2018), and Ceiba glaziovii (Kuntze) K. Schum. (LA=0.4549*L.W; Ribeiro et al., 2020).
According to the proposed equation for estimating the leaf area, data showed low dispersion from the regression line in the scatterplot, indicating that variation was constant, and residuals were normally distributed. The equation proposed here may contribute to ecological studies on growth, development, and propagation of E. pauferrense, acting in the preservation of this endangered species in forest remnants.
Leaf area of E. pauferrense can be precisely estimated through a non-destructive method using linear dimensions of its leaf blades. Equations that use the product of length by width (L.W) can meaningfully estimate the leaf area of E. pauferrense. The equation ŷ=0.6740*LW from the linear model without intercept significantly estimates the leaf area of E. pauferrense in a quick and practical way.

