


Serviços Personalizados
Journal
Artigo
 texto em
  Inglês (pdf)
 Artigo em XML
 Referências do artigo
 Enviar este artigo por email
Indicadores
-
 Citado por SciELO
 -
 Acessos
Links relacionados
-
 Similares em
SciELO
Similares em
SciELO
Compartilhar

 Permalink
Estudios fronterizos
versão On-line ISSN 2395-9134versão impressa ISSN 0187-6961
Estud. front vol.23 Mexicali 2022 Epub 20-Jun-2022
https://doi.org/10.21670/ref.2209093
Articles
Cross-border retail trade between Ciudad Juárez, Chihuahua and El Paso, Texas

a El Colegio de la Frontera Norte A. C., Departamento de Estudios Urbanos y Medio Ambiente, Ciudad Juárez, Mexico, e-mail: cfuentes@colef.mx
The objective of the article is to analyze the impact of cross-border retail trade by estimating spending by sector on both sides of the Ciudad Juárez-El Paso cross-border conurbation. The expenditure estimation was done with the information provided by the cross-border survey of international bridge users, during the period October-December 2019. The results show that expenditures made by residents in Mexico who crossed into the United States were 177.7 million USD and those in the United States who crossed into Mexico 141.2 million, during the last quarter of 2019. Residents in Mexico indicate that their main reasons for crossing are shopping, work and school and U.S. residents to attend family reunions, medical or dental consultation and purchase medicine. Therefore, it is concluded that integration between the two cities is partial.
Keywords: cross-border retail trade; Ciudad Juárez; El Paso; expenditure
El objetivo del artículo es analizar el impacto del comercio transfronterizo al menudeo, para ello se busca estimar el gasto por sector en ambos lados de la conurbación transfronteriza de Ciudad Juárez-El Paso. La estimación del gasto se realizó con la información proporcionada por la encuesta transfronteriza a usuarios de puentes internacionales, durante el periodo octubre-diciembre de 2019. Los resultados muestran que los gastos que realizaron los residentes en México que cruzaron a Estados Unidos fueron de 177 700 000 de dólares y los de Estados Unidos que cruzaron a México 141 200 000, durante el último trimestre de 2019. Los residentes en México señalan que sus principales motivos de cruce son compras, trabajo y la escuela y los residentes de Estados Unidos para asistir a reuniones familiares, consulta médica o dental y compra de medicinas. Por lo anterior, se concluye que la integración entre ambas ciudades es parcial.
Palabras clave: comercio transfronterizo al menudeo; Ciudad Juárez; El Paso; gasto
Introduction
The economies of Mexico and the United States are highly integrated, which is expressed in processes of different scales and magnitudes. At the cross-border scale relationships linked to retail trade have been established (Guo et al., 2006), which integrates the local economies of cities on both sides of the border (Ghaddar & Brown, 2005). The economic impact on each of these cities is different, varying according to population size (market size), distance to other large cities on both sides of the border (Cañas et al., 2006), and income level, among other factors. In this context, the cross-border conurbation between Ciudad Juárez and El Paso offers an important case study because it accounts for the second largest population and economic activity along the border between Mexico and the United States. Therefore, a large number of cross-border exchanges of very diverse nature take place, one way to approximate the magnitude of the interaction, is by quantifying the number of vehicle and people crossings, which reached 22 200 000 vehicles and 7 200 000 pedestrians in 2018 (U. S. DOT, 2021).
This cross-border economic exchange is driven by economic asymmetries (taxes, product costs, income, currency exchange rate, etc.) between the two countries and the physical distance between them. The bulk of cross-border interactions are carried out by Mexican consumers, who cross with the objective of buying non-durable products such as clothing, shoes, food, gasoline and food (fast food restaurants) (City of El Paso International Bridges Department & El Colegio de la Frontera Norte, 2020; Ghaddar & Brown, 2005). In contrast, residents on the United States side cross into Mexico, as a priority, to acquire medical, dental and veterinary services, purchase medicines, and acquire services related to personal grooming (haircuts) and restaurant (Coronado & Phillips., 2007; City of El Paso International Bridges Department & El Colegio de la Frontera Norte, 2020; Phillips & Coronado, 2005). In this sense, the border allows its residents to choose their purchases based on price, product quality, variety, etc. However, this trade is very sensitive to fluctuations in the exchange rate (Cañas et al., 2006; City of El Paso International Bridges Department & El Colegio de la Frontera Norte, 2020; Fullerton et al., 2013: Fullerton & Solís, 2020; Fullerton & Walke, 2014; Niño et al., 2015), the increase in crossing time on international bridges (Cañas et al., 2006; City of El Paso International Bridges Department & El Colegio de la Frontera Norte, 2020; Fullerton & Walke, 2016), the levels of violence on the Mexican side of the border (City of El Paso International Bridges Department & El Colegio de la Frontera Norte, 2020), U.S. visa availability, and so on.
In this context, the research question guiding the paper is what is the amount of cross-border consumer spending and in which subsectors of the El Paso and Ciudad Juarez economy? Studies on the cross-border impacts between Mexico and the United States related to crossings and the expenses of cross-border residents are scarce because require costly and time-consuming surveys. Existing studies are based on qualitative evidence using a convenience method or intentional sampling that only captures points in time (Baruca & Zolfaharian, 2013; Ghaddar et al., 2004; Guo et al., 2006; Hadjimarcou, 2008; Mendoza, 2012). In addition, these studies tend to focus on only one side of the border and calculate gross measures instead of net transfers between twin border cities (Coronado & Phillips 2007; Peña, 2003; San Diego Association of Governments [Sandag], 2006).
Due to data limitations, few relevant studies have employed rigorous statistical analyses or mixed methods. Some exceptions are studies that followed a stratified survey design to generalize the conclusions and estimates of economic impact (El Colegio de la Frontera Norte, 2007; Pavlakovich-Kochi & Charney, 2008; Sandag, 2006). However, its focus is limited to points in time (Baruca & Zolfagharian, 2013). In this study, the source of information used to estimate expenditures is El Paso-Ciudad Juárez Crossborder Survey, which was conducted in the last quarter of 2019 and the first quarter of 2020. The objective of the study is to estimate the total amount and by sector of the expenditures made by Mexican consumers in the United States and from the United States in Mexico during October-December of 2019.
This article is composed of four sections. The first section presents different theoretical approaches to cross-border integration and their application to retail trade. The second section shows the indicators for the cross-border economic and social relations in the Ciudad Juárez-El Paso binational conurbation. The third section presents the methodology used in the survey and in the estimation of consumer expenditures by sector. The fourth section presents the estimated total and sectoral expenditures on both sides of the border. Finally, the conclusions are presented.
Theoretical approaches to economic integration applied to cross-border trade
The current literature identifies four theoretical approaches to explaining economic integration that apply to cross-border trade. The first approach is the so-called flows approach (Brunet-Jailly, 2005), which focuses on the border crossings of goods and people. This approach takes up concepts from central place theory (Berry & Parr, 1988; Christaller, 1966; Lösch, 1954), such as production cost, distance and threshold. The concepts of economic distance and threshold are important to understand the centrality of a place. Economic distance is the distance that a consumer is willing to travel to acquire a good or service; which will be willing to travel a greater distance when the service is central (Brunet-Jailly, 2005). The threshold is the extent to which the consumption of a good reaches, for some economic activity to emerge and be maintained, the threshold of a central good will be higher than that of a dispersed good or service (Peña, 2003).
A central argument is that physical borders, as a political decision, are artificial barriers, although very effective, to the natural functioning of market exchanges, where the limit is a function of the cost of production and the distance to the central market or the center of production. This prevents the “natural” functioning of market exchanges and rational decision-making by producers and consumers (Peña, 2021). In this approach, integration is a product of the opening of borders to the flows of trade, services and people, which leads to an increase in cross-border interactions and a reduction in the barrier effect (Sohn, 2014). The barrier effect of the border is also increased due to a lack of physical connections between the border cities, that would allow for the fluidity of the flows of people and goods, given the lack of sufficient communication infrastructure. This results in long waiting times, which discourages border crossing and its impact on cross-border trade (Fullerton, 2003).
The second approach is that of convergence, which criticizes the concept of integration from the flows approach, which is only based on the existence of interactions but does not mean the convergence of territorial units on both sides of the border that, which as a result of their integration, reduce their differences (Sohn, 2014). In this sense, two lines of thought were developed. The first line is based on the material dimension of cross-border integration (objective approach), in which the work of Alegría (2009) stands out, which makes a critical analysis of the hypothesis of cross-border metropolises proposed by Herzog (1990). This approach points out that the cities that make up the cross-border metropolis of San Diego-Tijuana are not integrated but are very different in their socio-spatial patterns and in the mechanisms that govern socioeconomic development (Sohn, 2014). The second line, with a cultural approach, focuses on the representations of the sense of belonging necessary for a convergence of social and cultural values, the importance of a common imaginary community, as well as a shared identity necessary for cross-border integration (Sohn, 2014).
The third approach proposes the border as a resource (Sohn, 2014), in which it is pointed out that cross-border integration does not always occur as a result of the opening of the border but rather represents opportunities for local and regional actors. In this sense, there are four ways in which the border represents a resource: 1) positional benefits, 2) transaction benefits, 3) locus of hybridization and 4) the differential benefits. The latter way highlights the benefits of cost differentiation factors (labor, land, foreign exchange, and water) or different tax regimes and regulations, for example, the juxtaposition of different borders coupled with a high border porosity and the presence of phenomena such as residential migration and cross-border retail trade (Sohn, 2014).
A fourth approach, developed by Alegría (1989; Alegría Olazábal, 1992), distinguishes two types of relevant binational relationships: one at the country level, i.e., transnational, and the other at the regional scale, i.e., cross-border. The latter represent relationships between a border city of a country and its contiguous extra-regional counterpart. These processes are possible due to the spatial contiguity of spatial units with structural differences, which leads to the intensification of cross-border links and allows the complementarity of the needs that each structure presents (Alegría, 1989; Alegría Olazábal, 1992). These processes arise as a result of structural differences between countries (prices and regulations) and spatial contiguity, which generate opportunities for the emergence of a series of cross-border processes such as cross-border retail trade, transmigration, the maquiladora industry, tourism, etc. (Alegría, 1989; Alegría Olazábal, 1992). As for cross-border retail trade, its growth is possible due to the spatial contiguity and differences in prices, wages and labor conditions in binational pairs along the border between two countries (Alegría, 1989; Alegría Olazábal, 1992).
In this context, cross-border retail trade is defined as a “commercial exchange resulting from national structural differences (taxes, product costs, income, currency exchange rate, etc.) and facilitated by the spatial contiguity of cities in different countries” (Peña, 2003, p. 5). Cross-border spending is defined as monetary resources destined to the purchase of consumer products or services in a neighboring country. The distance between Mexico and the United States allows their residents to cross the border and purchase products that are not produced in the other country or that are less expensive. This activity generates complementarity between the populations on both sides of the border by creating the possibility of consuming a product that is not produced in their country or is less expensive in the neighboring country. Therefore, consumers will be able to shop where the lowest price, highest quality and greatest variety, for example, electronic products. Similarly, there are restaurant or health services that are lower cost on one side of the border, so consumers will cross the border in their search.
Structural differences between countries (prices, product quality and regulations) and the short distance allow cross-border retail trade. For the purposes of this study, the consumer is defined as the person who made or plans to make an expense during his or her stay in the neighboring city of another country.
The binational conurbation between Ciudad Juárez, Chihuahua-El Paso, Texas: asymmetries and complementarities
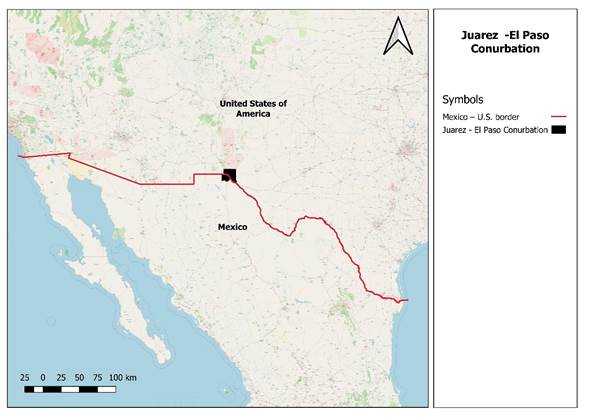
The cross-border conurbation formed between Ciudad Juárez, Chihuahua, and El Paso, Texas, is located in the central part of the U.S.-Mexico border (see Figure 1). It is the second most populated conurbation, with 2 100 000 people (Inegi, 2020; US Census Bureau, 2020). The population size of the conurbation affects the increase in cross-border interactions due to the size of the market it covers. The above is expressed in the number of international crossings, that reached more than 22 200 000 vehicles and 7 200 000 pedestrians in 2018. Therefore, the border crossing between Ciudad Juárez and El Paso accounts for the second largest number of crossings of vehicles and pedestrians along the border between the U.S. and Mexico (U. S. DOT, 2021). Several studies have indicated that the reasons for these crossings are mainly to purchase products and services, work and visit family or friends (Cañas et al., 2006).
Source: the authors
In this context, the maquiladora industry and cross-border retail trade are two relevant examples of cross-border economic integration (Fuentes et al., 2007). The first is expressed through intra-industry trade, and the second is expressed through cross-border retail trade. The latter arises as a result of asymmetries between neighboring countries, which are expressed in differences in prices and the quality of durable consumer goods and in nondurable goods such as clothing and food, etc. (Cañas et al., 2006).
In this sense, the complementarity between the two economies materializes through the fact that Ciudad Juárez consumers positively impact some sectors of the economy of El Paso, but also El Paso consumers benefit some segments of the economy of Ciudad Juárez. For El Paso, the sector with the greatest impact is retail trade, which is manly located near international crossings to provide accessibility to Mexican consumers. The impacts on some sectors of the local economy were made evident by statistics showing that El Paso reported retail sales of 5 800 000 000 billion in 2000, by 2012, this had increased to 8 400 000 000 dollars. A study carried out in 2007 reported that approximately 10% of retail trade in El Paso is allocated to cross-border trade (Coronado & Phillips, 2007). The retail products with the highest sales were gas stations, food and clothing stores and general merchandise stores (Cañas et al., 2006).
The economic impacts of cross-border retail trade are reflected not only in the commerce and services subsectors but also in the tax revenue received by the state of Texas. In this sense, some studies reported that of the total taxable retail commerce sales 14.6% were made by Mexicans, representing 388 000 000 dollars in 1998 (City of El Paso, 2001). In addition, the interaction is not only economic but also social since 81% of the population of El Paso is of Hispanic origin, mostly Mexican, and a significant percentage has relatives in Ciudad Juárez (US Census Bureau, 2020). This is also reflected in the number of border crossings; whose main purpose is to visit relatives in both directions.
Retail trade is very sensitive to macroeconomic variables such as the devaluation or undervaluation of the exchange rate. Several studies have shown the economic integration between the two cities by evaluating the effects of a reduction in money spent by Mexican consumers in El Paso as a result of devaluation (Patrick & Renforth, 1996). In contrast, in some sectors on the Mexican side, purchases made by U. S. residents are increasing due to the greater purchasing power of their currency. Likewise, there are also other factors that negatively affect the cross-border relationship and its impact on retail trade, such as waiting times at international crossings, as a result of increased border security and, with it, the exhaustive reviews carried out by migration agents, especially since September 11, 2001. In addition, another issue that has impacted cross-border retail trade in recent years is public safety in Ciudad Juárez, which has contributed to the reduction in crossings by U. S. residents to Mexico.
Methodology
To estimate the expenses incurred by cross-border consumers, the El Paso-Ciudad Juárez Cross-Border Survey (ECCBS) was applied1 during the period from October to December 2019.2 This section summarizes the methodology3 used for the survey and for estimating the total expenditure and expenditures by sector.
The survey’s methodological design has as its conceptual and methodological antecedent the measurement of migration flows carried out in the Survey on Migration in the Northern Border (Emif Norte) and Southern Border (Emif Sur), which was developed by El Colegio de la Frontera Norte (El Colef). However, the ECCBS methodology presents important adjustments that will be described below.
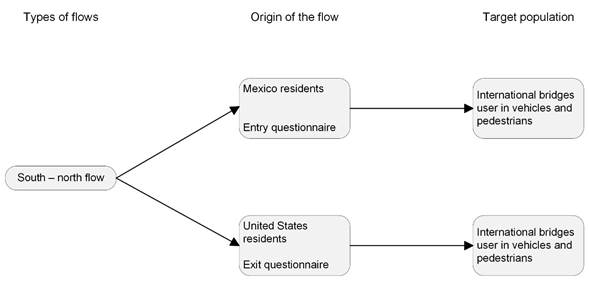
The target population were users of international bridges over 15 years of age living in Mexico and the U. S. who travel by vehicle and on foot, seeking to cross into the United States through three international bridges between Ciudad Juárez and El Paso. Their main purpose is shopping, visiting relatives, tourism, work, attending school etc. (see Figure 2). The target population was captured in the south-north flow at the Paso del Norte-Santa Fe, Córdova-Americas and Zaragoza-Ysleta international crossings.4 In the survey, there are four flows: south-north, i.e., residents of Mexico who are crossing in vehicles or on foot, and south-north, i.e., residents of the United States who are crossing in vehicles or on foot. Within the flows captured in the ECCBS, target populations are defined as a function of the final destination (see Figure 3).
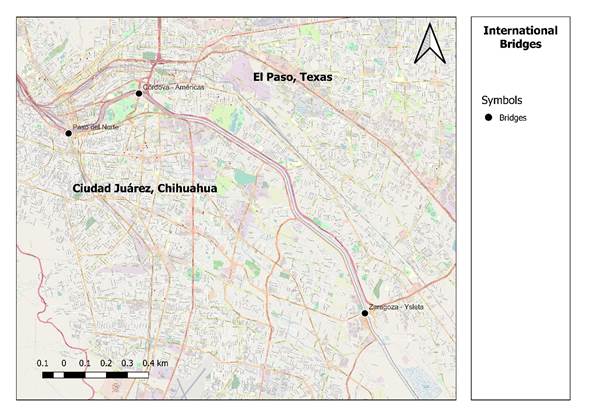
Source: the authors
Figure 3 Diagram of the target population for the application of the survey of users of international bridges between Ciudad Juárez and El Paso
Sample design
To define the sampling frame for the first quarter, the number of pedestrians and vehicles events crossing through the observation points for the October to December 2018 period, was available with information provided by U.S. Customs and Border Protection Agency.
The strategy to define the sampling frame and identify the primary sampling units (PSU) was constructed using a combination of time and space dimensions. Regarding the time component, the numbers of persons and their distribution during 24-hour of the day were analyzed with previous form October to December 2018. In addition, only two shifts were defined: from 7:00 am to 3:00 pm and 3:00 pm to 11:00 pm. From the combination of the spatial and temporal components, the PSU were constructed; that is, each PSU is defined by the time of the day, day of the quarter and physical space of observation. A total of 195 PSU were identified. For pedestrian crossings, there are two levels of selection: days and people. Crossings by cars involve three levels of selection: days, vehicles (secondary sampling units [SSU]) and people inside the vehicle (tertiary sampling units [TSU]) (see Table 1).
Sample selection
For the selection of the sample, stratified sampling was chosen in the first sampling stage, and the strata were constructed by combining the time of the day and border crossing locations. A total, 14 strata were obtained, all with the same number of PSU. To select these units, a sample size was first assigned based on the distribution of the flow between strata that was calculated using data from October to December 2018 provided by U.S. Customs and Border Protection Agency. Once the sample size was assigned for each stratum, simple random selection without replacement was conducted.
Calculation of sample weight
For the calculation of weights, the probability of selection in each of the sampling stages was obtained as indicated below. The following previously obtained data were available for the calculations:
Number of people per day and time and place of border crossing;
Number of cars or vehicles per day and time and place of border crossing; and
Proportion of the population aged 15 years or older (estimates obtained using the same survey).
First stage of sampling (selection of the PSU)
Given that the selection is based on simple random sampling, the probability of selection is
where
The weight of the first selection stage (
Second sampling stage
In the second stage, the number of people who crossed the border and observation points time were considered with respect to the total PSU in the stratum. The total number of crossings in each PSU was obtained from administrative records that report the total population, and a proportion was applied to estimate the number of people aged 15 years or older using data from the survey itself.
Notably, the administrative records include the total population, but in the survey, only people aged 15 years or older are considered the target population. Therefore, for each stratum, the proportion of the population who is 15 years or older must be estimated, a process for which the survey data were used.
where
For car crossings, the following formula was used to calculate the weight:
where
Methodology for estimating total expenditure and expenditures by sector
The estimates for total expenditure and expenditure by sector were derived using three steps.
1) Data were obtained from the survey conducted from October to December 2019. The descriptive statistics of each variable, such as the number of cases, maximum and minimum values, arithmetic mean and standard deviation, were obtained.
2) The above information and the information provided by the U.S. Customs and Border Protection regarding the number of vehicles and people who crossed the ports of entry in the October-December 2019 period were transformed into events, and with this, weighting was obtained.
3) The weighted sample (N) for each expenditure category was multiplied by the average expenditure (g1, g2, g3…. gn) reported by the people surveyed to estimate the total expenditure and expenditures by sector.
The calculation is as follows:
Total expenditure g 1 = N1 * (average expenditure in g1)
where N1 is the estimated total for expenditure category g1.
Estimation of retail spending in the Ciudad Juárez-El Paso cross-border conurbation
Economic integration is partly explained by the cross-border relationship established through retail trade between Ciudad Juárez and El Paso. This trade is defined by the asymmetry between the economies of the neighboring countries, population size (market size), and the distance between the two cities, among other factors. In terms of economic asymmetry, a strong indicator is gross domestic product per capita; in 2018, it was $63 064 in the United States and $9 687 in Mexico (World Bank, 2020). This leads some sectors of the population living on the Mexican side of the border to seek to maximize their income by crossing the border to purchase products that are less expensive or of higher quality.
In this context, border crossing is an activity carried out mainly by Mexican border residents. The survey results show that the primary place of residence of cross-border consumers is Mexico (60%) and specifically the municipality of Juárez (59%), followed by El Paso County (37%). That is, 96.2% of the individual crossings are linked to a primary residence in the Paso del Norte region, comprising the municipality of Juárez, Chihuahua, and the counties of El Paso, Texas, and Doña Ana, New Mexico (City of El Paso International Bridges Department & El Colegio de la Frontera Norte, 2020). This finding indicates that the economic distance and the threshold of the cross-border retail trade are small because the majority of cross-border consumers are residents of both sides of the border.
The intensity of border crossings decreases as the distance increases, as proposed by the flow approach of cross-border integration. Therefore, only 3.8% of the users of international bridges live among other populations of Chihuahua, Texas and New Mexico. At the municipal level, outside the municipality of Juárez, these individuals originate from the municipalities of Chihuahua, Torreón, Ahumada, Delicias, Durango and Guadalajara (City of El Paso International Bridges Department & El Colegio de la Frontera Norte, 2020). At the county level, international bridge users who do not live in El Paso County reside in nearby counties such as Ector (Odessa), Hidalgo, Dallas and Harris in Texas. Regarding New Mexico, those who do not live in Doña Ana County reside in relatively close counties such as Bernalillo, Otero, Eddy, etc. A similar finding was observed for residents of the states of Colorado, Arizona and California (City of El Paso International Bridges Department & El Colegio de la Frontera Norte, 2020). Most of the aforementioned counties and municipalities are within the threshold of the area of economic influence of the Ciudad Juárez-El Paso cross-border conurbation. This influence decreases as the distance a consumer is willing to travel to buy a good or service increases (Peña, 2003).
The reasons for border crossings vary and include shopping, working, visiting relatives, tourism, attend school, etc. This is consistent with the theoretical approach that indicates that an important part of cross-border relationships is constructed from the consumption of products as a result of asymmetries between the two sides of a border, expressed in differences in prices, variety and quality (Cañas et al., 2006). In addition to family and work ties on both sides of the border, cross-border spending is an important driver of some sectors of local economies. In this sense, residents in Mexico were asked if they planned to spend money during their visit to the United States, and residents in the United States were asked if they had spent money during their visit to Mexico. The responses were as follows. Of Mexican residents, 62.8% answered affirmatively, only 29.5% answered no, and 4.3% responded that they did not know if they would spend money. In comparison, 71.3% of U. S. residents indicated that they spent money in Mexico during their visit, 26.4% responded that they did not incur any expenses, and 0.4% responded that they did not know if they had spent money (City of El Paso International Bridges Department & El Colegio de la Frontera Norte, 2020).
Mexican residents who responded that they planned to spend money during their stay in the United States were asked on what goods or services they intended to do so. Resident of the United States were asked in which sectors they had spent during their visit to Mexico. The results indicate that for Mexican residents, shopping (42.0%) is the main reason for crossing the border, followed by visiting relatives (16.3%), working (15.5%) and attending school (4.1. %) (City of El Paso International Bridges Department & El Colegio de la Frontera Norte, 2020). Available income, exchange rate and sales taxes are factors that influence their decision to cross to El Paso to make purchases. In fact, Mexican buyers seek to take advantage of discount sales days, such as Black Friday or tax-free weekends. In the southern direction, the difference in the exchange rate makes it less expensive for residents of the United States to carry out different activities in Ciudad Juárez, such as shopping (13.0%), eating/drinking (5.8%), and acquiring medical services (7.4%) and other services (see Table 2); other reasons account for a smaller percentage (City of El Paso International Bridges Department & El Colegio de la Frontera Norte, 2020).
Table 2 Main reasons for crossing the international bridges between El Paso and Ciudad Juárez, by country of residence (October-December 2019) (Percentage)
| Reason for crossing | Residence | Reason for crossing | Residence | ||
|---|---|---|---|---|---|
| Mexico | USA | Mexico | USA | ||
| Purchases | 42 | 13 | Work/employment | 15.5 | 6 |
| Eating/drinking | 1.3 | 5.8 | Business | 2.9 | 2.1 |
| Health-related activities | 1 | 7.4 | Attending school | 4.1 | 1.1 |
| Social/family activities | 16.3 | 41.9 | Drop off/pick up people | 1.6 | 0.8 |
| Social/friends activities | 2.3 | 3.5 | Vacations | 0.9 | 0.9 |
| Social/other activities | 1.7 | 3 | Other | 3 | 2.6 |
| Going home | 4.8 | 7.7 | |||
Source: El Paso-Ciudad Juárez Cross-Border Survey, 2020. https://pdnuno.com/data/ibcs
The results of the survey also give empirical support to the theoretical strong family and work ties between the two cities. The findings of the survey show that U.S. visitors who cross to Ciudad Juárez, to a large extent, do so for social activities (41.4%) and to a lesser extent for work (6.0%). In comparison, social and labor reasons for crossings by residents of Mexico account for 16.3% and 15.5%, respectively (City of El Paso International Bridges Department & El Colegio de la Frontera Norte, 2020). For Juarenses, family ties are clearly important reasons for crossing the border, and the high percentage work reflects the importance of receiving a higher income in El Paso by earning dollars and spending pesos. In addition, there is a flow of El Paso residents to Ciudad Juárez to work in management positions in the maquiladora industry and other economic activities.
Table 3 provides a breakdown of the “other” category. The top responses in “other” option for residents in Mexico were visiting U. S. Customs offices to request or collect information regarding a permit or documents related to a trip (39.3%), getting gasoline (20%) and going to the bank (10.9%). For residents of the United States crossing into Mexico, “other” included visiting Ciudad Juárez to care service their vehicles or appliances (31.6%), followed by personal care services (22.1%), such as haircuts, and dentist, ophthalmologist and veterinarian visits (11.0%) (City of El Paso International Bridges Department & El Colegio de la Frontera Norte, 2020).
Table 3 Breakdown of the “other” response by users of the international bridges between El Paso and Ciudad Juárez by country of residence (October-December 2019). (Percentage)
| Reason for crossing | Residence | |
|---|---|---|
| Mexico | USA | |
| Permit/visa/consulate | 39.3 | 5.2 |
| Mechanic/repairs | 4.5 | 31.6 |
| Getting gasoline | 20.2 | - |
| Personal care | 0.5 | 22.1 |
| Dentist/ophthalmologist | 0.5 | 11.9 |
| Donate plasma | 1.3 | - |
| Take/collect something | 17 | 10.1 |
| Bank/make payment | 10.9 | 8.4 |
| Other matters | 5.9 | 10.8 |
Source: El Paso-Ciudad Juárez Cross-Border Survey, 2020. https://pdnuno.com/data/ibcs
The above indicates that the reasons for crossing reflect economic and social exchange between the two sides of the border. On the one hand, Mexican residents cross the border to make purchases, while U.S. residents do so for social-family activities and for doctor or dentist visits. Table 4 provides the figures for the type of expenditure. The total amount of spending in Texas, United States, during the fourth quarter of 2019 by Mexican residents who crossed the border between El Paso and Ciudad Juárez was 177 700 000 dollars.5 For residents of the United States who crossed into Mexico, the expenditure was 141 200 000 dollars (see Table 4). This confirms the importance of cross-border retail trade in some sectors of the local economy (Phillips & Coronado, 2005).
Table 4 Expenditures by type of consumption or service associated with crossing international bridges between El Paso-Ciudad Juárez (October-December 2019) (Dollars)
| Type of expenditure | Residence | Total | |
|---|---|---|---|
| Mexico | USA | ||
| Casino | 0 | 168 695 | 168 695 |
| Concert or musical event | 0 | 87 073 | 87 073 |
| Other | 76 358 458 | 68 577 537 | 144 935 995 |
| Purchase of clothing or footwear | 59 930 279 | 1 739 980 | 61 670 259 |
| Food or drinks (groceries) | 15 999 215 | 25 750 329 | 41 749 544 |
| Purchase of electronics or appliances | 7 252 123 | 12 114 | 7 264 237 |
| Restaurant (not fast food) | 6 602 499 | 30 873 018 | 37 475 517 |
| Getting gasoline | 4 650 214 | 782 081 | 5 432 295 |
| Purchase of car accessories | 2 759 471 | 203 801 | 2 963 272 |
| Purchase of furniture | 1 722 300 | 351 745 | 2 074 045 |
| Purchase of sporting goods | 1 055 033 | 1 206 306 | 2 261 339 |
| Health or care items | 895 287 | 119 601 | 1 014 888 |
| Request medical service | 265 451 | 9 557 686 | 9 823 137 |
| Fast food restaurant | 172 684 | 537 058 | 709 742 |
| Bar | 37 762 | 1 276 146 | 1 313 908 |
| Accommodation (hotel or motel) | 7 612 | 0 | 7 612 |
| Total | 177 708 490 | 141 243 170 | 318 951 660 |
Source: El Paso-Ciudad Juárez Cross-Border Survey, 2020. https://pdnuno.com/data/ibcs
The largest amounts of spending in dollars by Mexican residents in El Paso were concentrated in the purchase of clothes or footwear (59 900 000 dollars), food or beverages (“groceries”, 15 900 000 dollars), and the purchase of household appliances (7 200 000 dollars) and gasoline (4 600 000). For their part, United States resident spent money in Ciudad Juárez mainly on food and beverages (groceries, 25 700 000 dollars), restaurants (30 800 000), medical and dental services (9 500 000 dollars); and the purchase of sports gear, music or books (1 200 000 dollars).
Conclusions
Economic integration between Mexico and the United States is explained by several processes that have different scales and magnitudes. At the cross-border scale, the cross-border retail trade between consumers in Ciudad Juárez and El Paso indicates partial cross-border economic integration, because this activity is associated with only a few sectors of the local economy, mainly concentrated in the retail trade subsector. The branches of the economy impacted by this type of commerce are concentrated in those dedicated to the sale of nondurable goods such as clothing, food, shoes, gasoline, etc., and in a few cases durable goods such as electronic devices, furniture and white goods. This result is consistent with the findings of a previous study, i.e., only 10% of retail trade in El Paso is allocated to cross-border trade (Coronado & Phillips, 2007). Consumption by residents of the United States is focused on the services sector, such as restaurants, personal care and health care.
The economic distance and the threshold of cross-border retail trade is limited because the residents of both cities carry out this trade. The results indicate that of the Mexicans who cross into the United States, 60% live in the municipality of Juárez, and 37% live in El Paso. That is, 96.2% of individual crossings involve a resident of the region. Similarly, the retail trade carried out by consumers residing in Mexico is limited by budget because the amounts spent are low and are concentrated in the purchase of lower-cost products such as clothing, shoes, “groceries”, and gasoline, with an average expenditure of $70, even though the sales volume is not negligible. For consumers who reside in the United States, border crossing is very important, especially for low-income consumers who do not have health insurance, because these individuals visit doctors and dentists and buy medicine (Rivera et al., 2009). Health services provided to people who reside in the United States represents an important part of the income received by health professionals located near a border crossing. The estimate for the last quarter of 2019 indicated that residents of Mexico spent 25% more in El Paso than residents of the United States did in Ciudad Juárez.
Notably, not all cross-border relationships are based on cross-border retail trade. There is a strong social and family bond because a significant number of people living in El Paso have relatives in Ciudad Juárez. The above also impacts some sectors of both economies because border crossings occur for the celebration of family events, thus impacting sectors such as bars and restaurants.
In general, cross-border retail trade depends on asymmetries in the prices, quality and variety of products between neighboring countries and the distance between binational pairs, as proposed by the different theoretical approaches to economic integration. This trade is also limited by forces that operate against it, such as long waiting times to cross the border, the parity of the exchange rate, the reduced number of people with a visa to cross into the United States, and security in Ciudad Juárez, among other factors.
REFERENCES
Alegría, T. (1989). La ciudad y los procesos transfronterizos entre México y Estados Unidos. Frontera Norte, 1(2), 53-90. https://fronteranorte.colef.mx/index.php/fronteranorte/article/view/1654 [ Links ]
______ (2009). Metrópolis transfronteriza: revisión de la hipótesis y evidencias de Tijuana, México, y San Diego, Estados Unidos. El Colegio de la Frontera Norte. [ Links ]
Alegría Olazábal, T. (1992). Desarrollo urbano en la frontera México-Estados Unidos: una interpretación y algunos resultados. Consejo Nacional para la Cultura y las Artes. [ Links ]
Baruca, A. & Zolfagharian, M. A. (2013). Cross-border shopping: Mexican shoppers in the US and American shoppers in Mexico. International Journal of Consumer Studies, 37(4), 360-366. https://doi.org/10.1111/j.1470-6431.2012.01097.x [ Links ]
Berry, J. L. & Parr, J. B. (1988). Market centers and retail location: theory and applications. Prentice Hall. [ Links ]
Brunet-Jailly, E. (2005). Theorizing borders: an interdisciplinary perspective, Geopolitics, 10(4), 633-649. https://doi.org/10.1080/14650040500318449 [ Links ]
Cañas, J., Coronado, R. & Phillips, K. R. (2006). Border benefits from Mexican shoppers. Southwest Economy, (3). https://www.dallasfed.org/~/media/documents/research/swe/2006/swe0603c.pdf [ Links ]
City of El Paso. (2001). El Paso profile and economic summary 2000-2001. Department of Economic Development. [ Links ]
City of El Paso International Bridges Department & El Colegio de la Frontera Norte. (2020). International Bridges Crossborder Survey El Paso-Ciudad Juárez. Social and Expenditure Profile. Technical Report No. IBD-2020-01. https://bridges-production.s3.amazonaws.com/documents/files/000/000/042/original/IBCS_IBD-2020-01_09.10.20_final.pdf?1599838621 [ Links ]
Christaller, W. (1966). Central places in Southern Germany. Prentice Hall. [ Links ]
Coronado, R. A. & Phillips, K. R. (2007). Exported retail sales along the Texas-Mexico border. Journal of Borderlands Studies, 22(1), 19-38. https://doi.org/10.1080/08865655.2007.9695667 [ Links ]
El Colegio de la Frontera Norte. (2007). Estudio de puertos de entrada México-Estados Unidos: análisis de capacidades y recomendaciones para incrementar su eficiencia. https://www.colef.mx/wp-content/uploads/2013/03/ResumenEjecutivo.pdf [ Links ]
Fuentes, C. M., Cervera, L. & Peña, S. (2007). La integración económica entre México-Estados Unidos y su impacto en el sistema urbano espacial de una región transfronteriza: Ciudad Juárez-El Paso. Noésis. Revista de Ciencias Sociales y Humanidades, 16(31), 206-232. https://www.redalyc.org/articulo.oa?id=85903108 [ Links ]
Fullerton, T. M. (2003). Recent trends in border economics. Social Science Journal, 40(4), 583-592. https://doi.org/10.1016/S0362-3319(03)00070-3 [ Links ]
Fullerton, T. M., Molina, A. L. & Walke, A. G. (2013). Tolls, exchange rates, and northbound international bridge traffic from Mexico. Regional Science Policy & Practice, 5(3), 305-322. https://doi.org/10.1111/rsp3.12011 [ Links ]
Fullerton, T. M. & Solis, O. (2020). Borderplex bridge wait time headache reactions. Journal of Transport Economics & Policy, 54(1), 58-78. https://www.ingentaconnect.com/content/lse/jtep/2020/00000054/00000001/art00005 [ Links ]
Fullerton, T. M. & Walke, A. G. (2014). Homicides, exchange rates, and northern border retail activity in Mexico. Annals of Regional Science, 53(3), 631-647. http://hdl.handle.net/10.1007/s00168-014-0636-y [ Links ]
______ (2016). Economic impacts of border congestion alleviation (BRMP Policy Brief 16-1). Department of Economics and Finance-University of Texas at El Paso. [ Links ]
Ghaddar, S., Richardson, C. & Brown, C. J. (2004). The economic impact of Mexican visitors to the Lower Rio Grande Valley 2003. Center for Border Economic Studies-University of Texas Pan American. [ Links ]
Ghaddar, S. & Brown, C. J. (2005). The economic impact of Mexican visitors along the U.S.-Mexico Border: a research synthesis. Center for Border Economic Studies-University of Texas Pan American. [ Links ]
Guo, C., Vasquez-Parraga, A. Z. & Wang, Y. (2006). An exploratory study of motives for Mexican nationals to shop in the US: more than meets eye. Journal of Retailing and Consumer Services, 13(5), 351-362. https://doi.org/10.1016/j.jretconser.2005.11.002 [ Links ]
Hadjimarcou, J. (2008). Cross-border retailing study. Department of Marketing and Management-University of Texas at El Paso. [ Links ]
Herzog, L. A. (1990). Where north meets south: cities, space, and politics on the United States-Mexico border. University of Texas Press. [ Links ]
Instituto Nacional de Estadística e Informática (Inegi). (2020). XIV Censo de Población y Vivienda. Inegi. https://www.inegi.org.mx/programas/ccpv/2020/ [ Links ]
Lösch, A. (1954). The economics of location. Yale University Press. http://www.economia.unam.mx/cedrus/descargas/economicsoflocat00ls.pdf [ Links ]
Mendoza, N. (2012). Cross border consumer statistics. https://www.slideshare.net/namendoza/cross-border-consumer-statistics [ Links ]
Niño, P., Coronado, R. A., Fullerton, T. M. & Walke, A. G. (2015). Cross-border homicide impacts on economic activity in El Paso. Empirical Economics, 49(4), 1543-1559. https://doi.org/10.1007/s00181-015-0924-0 [ Links ]
Patrick, J. M. & Renforth, W. (1996). The effects of the peso devaluation on cross border retailing. Journal of Borderlands Studies, 11(1), 25-41. https://doi.org/10.1080/08865655.1996.9695481 [ Links ]
Pavlakovich-Kochi, V. & Charney, A. H. (2008). Mexican visitors to Arizona: visitor characteristics and economic impacts, 2007-08. Eller College Management-University of Arizona. https://tourism.az.gov/wp-content/uploads/2019/05/2007-08-Mexican-Visitors-to-Arizona.pdf [ Links ]
Peña, S. (2021). From territoriality to borderscapes: the conceptualisation of space in border studies. Geopolitics. https://doi.org/10.1080/14650045.2021.1973437 [ Links ]
Peña Medina, S. (2003). Comercio transfronterizo y su impacto en la región El Paso-Ciudad Juárez: una propuesta de financiamiento de la planeación binacional. Frontera Norte, 15(29), 185-200. https://doi.org/10.17428/rfn.v15i29.1340 [ Links ]
Phillips, K. R. & Coronado, R. (2005). Texas border benefits from retail sales to Mexican nationals. Federal Reserve Bank of Dallas. https://www.researchgate.net/publication/5030253_Texas_border_benefits_from_retail_sales_to_Mexican_nationals [ Links ]
Rivera, J., Ortiz, M. & Cardenas, V. (2009). Cross-border purchase of medications and health care in a sample of residents of El Paso, Texas, and Ciudad Juarez, Mexico. Journal of National Medical Association, 101(2), 167-173. https://doi.org/10.1016/S0027-9684(15)30831-2 [ Links ]
San Diego Association of Governments (Sandag). (2006). Economic impacts of wait times at the San Diego-Baja California border. Final report. https://www.sandag.org/programs/borders/binational/projects/2006_border_wait_impacts_report.pdf [ Links ]
Sohn, Ch. (2014). Modelling cross-border integration: the role of borders as a resource. Geopolitics, 19(3), 587-608. https://doi.org/10.1080/14650045.2014.913029 [ Links ]
US Census Bureau. (2020). County Population Totals: 2010-2019. https://www.census.gov/data/datasets/time-series/demo/popest/2010s-counties-total.html [ Links ]
U. S. Department of Transportation (U.S. DOT). (2021). Bureau of Transportation Statistics, Border Crossing Entry Data. https://explore.dot.gov/views/BorderCrossingData/Annual?%3Aembed=y&%3AisGuestRedirectFromVizportal=y [ Links ]
World Bank. (2020). GNI per capita, PPP (current international $). https://data.worldbank.org/indicator/ny.gnp.pcap.pp.cd [ Links ]
1 This survey was conducted by El Colegio de la Frontera Norte in Ciudad Juárez and was funded by the City of El Paso, Texas, International Bridges Department (IBD). The main results can be obtained at https://pdnuno.com/data/ibcs.
2 The October-December period is when more purchases are made by border residents due to the proximity of the holidays. The survey was scheduled to be conducted for a year, with the aim of capturing the entire shopping cycle, but because of the SARS-CoV-2 pandemic, the study had to be suspended in March 2020.
4 The San Jerónimo-Santa Teresa and Guadalupe-Tornillo international crossings were omitted from the survey due to their remoteness from the conurbation and due to security reasons.
Received: November 30, 2021; Accepted: April 06, 2022
 Este es un artículo publicado en acceso abierto bajo una licencia Creative Commons
