


Services on Demand
Journal
Article
 text in
  English (pdf)
 Article in xml format
 Article references
 Send this article by e-mail
Indicators
-
 Cited by SciELO
 -
 Access statistics
Related links
-
 Similars in
SciELO
Similars in
SciELO
Share

 Permalink
Estudios fronterizos
On-line version ISSN 2395-9134Print version ISSN 0187-6961
Estud. front vol.19 Mexicali 2018 Epub Jan 01, 2018
https://doi.org/10.21670/ref.1801001
Articles
The multidimensional measure of poverty at the intraurban level in Ciudad Juarez, Chihuahua (2012)

a El Colegio de la Frontera Norte, Departamento de Estudios Urbanos y del Medio Ambiente in Ciudad Juárez, Chihuahua, Mexico, e-mails: cfuentes@colef.mx, spena@colef.mx
b Universidad Autónoma de Ciudad Juárez, Departamento de Arquitectura, Chihuahua, Mexico, e-mail: vladimir.hernandez@uacj.mx
The aim of this article is to measure multidimensional poverty at the intra-urban level in Ciudad Juárez, Chihuahua, in 2012. The methodology used was the same as that developed by Coneval in 2010 for its multidimensional measurement of poverty at the national, state and municipal levels. Territorial units of analysis (TUAs) were developed using a multivariate analysis technique to apply the methodology created by Coneval at the intra-urban level. The results make it possible to identify the TUAs in the city with greater incidence, intensity and depth of poverty. This method represents a powerful tool to design targeted public policies in the territory. Western and southeastern parts of the city exhibit greater social need. One of the main limitations of the study was the financial impossibility of expanding the survey implementation to improve the quality of the estimates.
Keywords: multidimensional poverty; Coneval; Ciudad Juárez
El objetivo del artículo es realizar la medición multidimensional de la pobreza a nivel intraurbano en Ciudad Juárez, Chihuahua en el año 2012. La metodología que aplicó fue la misma que desarrolló Coneval en 2010 para su medición multidimensional de la pobreza a nivel nacional, estatal y municipal. Para poder aplicar la metodología de Coneval a nivel intraurbano se propuso como alternativa la construcción de las unidades de análisis territorial (UTA) mediante una técnica de análisis multivariado. Los resultados permiten identificar las UTA de la ciudad en donde la pobreza se padece con una mayor incidencia, intensidad y profundidad, lo cual es una poderosa herramienta para el diseño de políticas públicas focalizadas en el territorio. Las áreas de la ciudad que se localizan en el poniente y suroriente presentan los mayores rezagos sociales. Una de las principales limitaciones del estudio fue la imposibilidad financiera de ampliar el levantamiento de la encuesta con el objetivo de mejorar la calidad de la estimación.
Palabras clave: pobreza multidimensional; Coneval; Ciudad Juárez
Introduction
In Mexico, since 2008, poverty has been measured from a multidimensional approach as required by the General Law of Social Development (Ley General de Desarrollo Social-LGDS). To do so, the National Institute of Statistics, Geography and Informatics (Instituto Nacional de Estadística, Geografía e Informática-Inegi) and the National Council on the Evaluation of the Social Development Policy (Consejo Nacional de Evaluación de la Política de Desarrollo Social-Coneval) have included the Socio-economic Conditions Module (Módulo de Condiciones Socioeconómicas-MCS) as a supplement to the National Survey of Household Income and Expenditures (Encuesta Nacional de Ingresos y Gastos de los Hogares-Enigh) to gather statistical information and measure multidimensional poverty (Garza-Rodríguez, 2016). However, due to the statistical representativeness of the survey, measurements are estimated only at the national, state and municipal levels, not at the intra-urban level. This hinders territorial targeting of social programs on an urban scale. Consequently, in Mexico, recently, some local governments, including those of Mexico City and Ciudad Juárez, have undertaken significant efforts to generate their own databases to measure multidimensional poverty at the intra-urban level. These efforts have been aimed at targeting, evaluating and, eventually, replicating social programs in specific territories (Sanchez, Boltivinik, Ruiz & Figueroa, 2011).
In the case of Ciudad Juárez, the high social costs of homicidal violence and the loss of thousands of jobs as a result of the global economic recession between 2008 and 2010 caused an increase in the number of people living in poverty (Coneval, 2010). This resulted in increased numbers of people seeking in-kind support from the various social programs offered by the municipal government to fight poverty. However, in the absence of sufficient resources to meet these needs, additional economic support was requested from other government levels.
Justifying the increase in the requested resources entailed applying a new poverty measurement that would be compatible with the “official” methodology. This is due to the fact that in Mexico, the results of the "official” poverty measurement represent one of the criteria used to assign federal government resources for social programs. In addition, to use the scarce resources more efficiently, the decision was made to measure multidimensional poverty at the intra-urban level and improve the targeting of social programs.
In this context, the aim of this article is to measure the incidence, intensity and depth of multidimensional poverty at the intra-urban level in Ciudad Juárez, Chihuahua in 2012.
The structure of the article fully corresponds with the objective set. The first section presents the different measures of poverty applied in Mexico, as well as a review of the literature reporting measurements of poverty at the regional or urban level. The second section shows the methodology used to estimate multidimensional poverty at the intra-urban level. The third section describes the performance of poverty indicators in the cities of the northern border and in the specific case of Ciudad Juárez, as well as poverty measurement at the municipal level. The fourth part reports on the results of the incidence, intensity and depth of multidimensional poverty at the intra-urban level in Ciudad Juárez, Chihuahua. Finally, the conclusions are presented.
Poverty Measurement Methods and its Measurement at the Regional and Intra-Urban Levels
Methods of Poverty Measurement in Latin America
Poverty has various definitions depending on the socio-economic, demographic or cultural environment in which it is used. For example, the World Bank (Banco Mundial, 1990, p. 26) defines it as “a minimal standard of living”. Barneche et al. (2010, p. 31) consider poverty in general terms: “poverty is understood as a situation of deprivation which forces those who suffer it to live outside socially established standards”. Poverty and social exclusion are closely related concepts. The former, in its contemporary sense, relates to the latter as a cumulative and dynamic process that detaches people from the resources necessary to access the material conditions of existence typical of a historically determined society. Recently, the most widely used definition in Latin America to identify poverty focuses on “the meanings relating to needs, living standards, or insufficient resources. Thus, the most commonly used indicators refer to the satisfaction of certain needs, consumption of goods or disposable income” (Barneche et al., 2010, p. 31).
The concept of poverty must meet two criteria to be measured: 1) identification and 2) aggregation. The first entails registering a group of individuals within the poor category and the second “allows gathering the poor in a global picture of poverty” (Caloca & Ortiz, 2016, p. 102).
In this sense, specialized literature on poverty includes several identification methods. Boltvinik (2003) proposed a typology to classify indirect, non-normative and one-dimensional methods, including poverty lines (PL), in a first group. He included indirect,1 semi-normative and normative, and one-dimensional2 methods, such as the normative food basket (NFB), the generalized normative basket (N) and subjective poverty lines in a second group. The third group includes direct, normative and multidimensional methods, such as unsatisfied basic needs (UBN), the index of deprivation and the enforced lack of socially perceived necessities (ELSPN). Finally, the fourth group comprises combined, semi-normative and normative,3 and multidimensional methods such as the objective poverty line, the integrated poverty measurement method (IPMM) and measurement using Coneval’s methodology.
This work does not intend to present a comprehensive review of all methods of measuring poverty; it focuses only on those that have been used in Latin America. In Mexico, until 2006, official poverty measurements stemmed from a one-dimensional perspective in which income represented a variable approximating the economic wellbeing of the population. In this measurement, a threshold or poverty line (which represents the minimum income required to purchase a basket of goods considered essential) is usually defined and compared with household incomes to identify the population that cannot access the conditions to meet their needs, insofar as these can be attained through markets for goods and services.
Indirect Methods
The poverty line (PL) method uses household income or consumption expenditure as a measure of wellbeing to establish the per capita value of a minimum consumption basket necessary for survival. “The extreme poverty line corresponds to the per capita value of the basket containing food items only. The total poverty line includes per capita values for food and non-food items” (Barneche et al., 2010, pp. 32-33). According to this method, those whose income or per capita expenditures are below the value of the minimum food basket are considered extremely poor. In the same way,
those whose income or per capita expenditure is above the extreme poverty line, but below the total poverty line are considered not extremely poor. Finally, non-poor are those whose income or expenditure per capita is above the poverty line (Barneche et al., 2010, pp. 32-33).
Direct Normative Methods
Unsatisfied basic needs method (UBN). This direct method has been used to identify and measure poverty in Latin America since the beginning of the 1980s (Feres & Mancero, 2000). It takes into account a “set of indicators related to basic structural needs (housing, education, health, public infrastructure, and others) required to assess individual wellbeing” (Barneche et al., 2010, p. 33).
Despite the fact that each country has its own characteristics regarding the phenomenon of poverty, there are some fixed, common (universal) shortcomings when implementing the method. Overcrowding, inadequate housing conditions (living conditions), inadequate water supply, lack or inadequacy of health services and the disposal of excreta, as well as absence of school-age children at primary schools are indirect indicators of economic capacity.
In Mexico, the main criticisms of one-dimensional methods such as the PL and the UBN focus on the need to expand the sources of wellbeing (Boltvinik, 1990a; 1990b; 1992). The first case includes only income, as if the satisfaction of needs depends exclusively on the current private consumption of a household. In the second case, the measure focuses on satisfier indicators that depend on the ownership of consumption assets (housing) or rights to access public services (water, drainage, education) and do not consider other sources of wellbeing (Boltvinik, 1992). For this reason, developing other measurements that take into account the multidimensionality of the phenomenon of poverty has become necessary.
Combined Semi-Normative Methods
Several methods have been used in Mexico to measure multidimensional poverty. One of them is the integrated poverty measurement method (IPMM), used since the beginning of the 1990s and proposed by Boltvinik (1992), although originally developed by Beccaria and Minujin (1987). More recently, the official measurement of multidimensional poverty conducted by Coneval (Coneval, 2009) has been used.
The IPMM was developed by Boltvinik (1992) with the purpose of overcoming the limitations of the PL and UBN. Boltvinik (1992) considers poverty a multidimensional phenomenon in which household welfare depends on five sources in addition to current income, on which the indirect approach is based: a) non-basic assets and the “capacity” of a household to borrow money; b) family patrimony; c) access to free goods and services (social rights); d) free and available time for domestic work, education and rest; and e) education level, related to people’s knowledge. For Boltvinik (1992), approaching the phenomenon of poverty is possible only if all these dimensions are taken into account.
Multidimensional poverty measurement (Coneval). The methodology to measure poverty adopted by Coneval4 is based on the use of households’ monetary resources as indirect indicators of wellbeing (Comité Técnico para la Medición de la Pobreza [Technical Committee for Poverty Measurement] CTMP, 2002). It gathers methodological proposals that combine income poverty measures with unsatisfied basic needs (Beccaria & Minujin, 1987; Feres & Mancero, 2000; Gordon, 2006). Additionally, the methodology adopted by the Coneval establishes a number of criteria to comply with the principles of transparency, technical rigor and impartiality and serves as a useful tool in the public policy arena for social development (Coneval, 2011).
Coneval seeks to ensure that the measurement methodology complies with the requirements of social development laws and regulations, with the aim of identifying the population living in poverty (Coneval, 2011).
The identification of the population living in poverty results from the diagnosis of their economic situation and the social deprivations they suffer. Social deprivation can occur as a result of one or more of the following: 1) educational gap, 2) lack of access to health services, 3) lack of access to social security, 4) inadequate housing quality or insufficient space, 5) lack of basic housing services, and 6) lack of access to food.
Thus, the multidimensional poor are those who have at least one social deprivation and whose income is below the line of economic wellbeing (LEW). The line of economic wellbeing specifies the income necessary to purchase the food and non-food baskets of goods and services. Within the group of people living in multidimensional poverty, those living in extreme poverty and in moderate poverty are identified. The first are those whose total income is insufficient even to buy the basket that can meet their food needs and who, in addition, suffer three or more social deprivations. People living in moderate poverty are those whose income is below the line of economic wellbeing and who suffer one or two social deprivations (Coneval, 2011).
Studies on Poverty Measurement at the Regional or Intra-Urban Level in Mexico: A Review
In Mexico, studies reporting on poverty measures at the regional and intra-urban levels are scarce. Damián (2009) estimated poverty in the delegations of the Federal District, grouped by poverty strata (high, medium, medium-low and low). Subsequently, he details the deprivation situation for the three main dimensions of the IPMM (income, time and UBN) and the different components of the UBN method, both in Mexico City as a whole and in the delegations grouped by stratum. The study was developed on the basis of the Enigh sample, which was implemented by Inegi with funding from the local government in 2004 to gather information representative of the entity.
Limas (2010) built the Foster, Greer and Thorbecke index (FGT) to diagnose male and female poverty in Ciudad Juárez, Chihuahua. Information by colony from Scince 2000 was used to create the FGT index, which included the final results of the 12th General Census of Population and Housing 2000 (XII Censo General de Población y Vivienda 2000) and information from the National Population Council (Consejo Nacional de Población [Conapo]) and the National Minimum Wage Commission (Comisión Nacional de los Salarios Mínimos [Conasami]). Regarding information, it is worth noting that the original database contains data from 728 colonies. The colonies located in the west end of the city have higher percentages of population living in extreme poverty. Women suffer extreme poverty with greater intensity on a daily basis because they remain in their homes, whereas men work in places different from where they live (Inegi, 2000).
Caloca and Ortiz (2016) conducted a study to identify spatial poverty in the Milpa Alta delegation in the City of Mexico. The first level of analysis was at the AGEB level (for its Spanish acronym [basic geostatistical area]) and subsequently at the city block level. In this study, the method called Sectoral Approach to Unsatisfied Basic Needs (SAUBN) (Boltvinik & Hernandez, 1999) was used to select variables, and the principal components technique was used to calculate estimates. The information sources were the 1990 and 2000 Population and Housing Census (Inegi, 1990; 2000), which took into account AGEBs first and city blocks second for its measurements.
Cortés, Benegas, Fernández and Mora (2007) estimated poverty intensity and depth in the state of Chiapas at the municipal level with the methodology developed by the Technical Committee for Poverty Measurement. To do so, they gathered information on poverty at the municipal level. However, given the impossibility of implementing a survey due to costs and considering that the Enigh is representative only at the rural-urban level, the decision was made to use 10% sample that was built at the same time as the 12th Population and Housing Census from 2000. As a result, poverty was measured by municipality, and measures for intensity and depth were obtained.
In general, it can be noted that in Mexico, in addition to the scarcity of studies on poverty measurement at the regional or urban level, most research is based on the information generated by Inegi. A study on the poverty measurement in the Federal District constitutes an exception because Inegi was asked to expand the sample from the Enigh (Inegi, 2000).
Methodology
In the case of Ciudad Juárez, the “official” methodology to measure poverty proposed by Coneval was used for the multidimensional poverty measurement at the intra-urban level. Several steps were followed to adapt it to the intra-urban level, including TUA selection, sample selection, survey implementation, database creation and the application of Coneval's algorithm to process the data through SPSS.
Territorial Units of Analysis
One of the main challenges when applying the methodology used by Coneval to measure poverty at the AGEB level is conducting a large number of questionnaires for the results to be statistically representative, which increases field operation costs. As a result, the construction of TUAs, whose methodological criteria will be detailed later, was proposed as an alternative.
TUAs represent the sampling basis and consist of clusters of housing units with similar characteristics, depending on the stratum to which they belong. The sizes of the TUAs ranged from 1 191 to 9 226 housing units, and the TUAs were created on the basis of AGEBs. The criterion for grouping two or more AGEBs was that they belonged to the same socio-economic stratum.
Stratification
Stratification takes into account the social and demographic characteristics of home dwellers in Ciudad Juárez, referring particularly to income.5 These characteristics are expressed through 13 demographic indicators constructed using multivariate statistical methods, namely grouping or clustering based on the information obtained in the 13th Census of Population and Housing, 2010 at the AGEB level.
Sampling Scheme
The implementation of the survey for Ciudad Juárez was designed following a probabilistic, stratified, two-stage and conglomerate sampling scheme.
Sample Size
The average income for the state of Chihuahua obtained using data from the Enigh 2010 was considered as a reference variable to calculate sample size. The expression used was as follows:
where
n Sample size
z Value recorded in the statistical tables for the standard normal distribution to achieve pre-established 90% confidence
s2 Estimate of the population variance for the variable of interest
DEFF Design effect defined as the quotient of variance in the estimate for the design used between the variance obtained considering a simple random sampling for the same sample size
r Maximum acceptable relative error
tnr Maximum expected non-response rate
PHV Average homes per housing unit
A sample of 6 887 housing units was determined by setting a confidence level of 90%, a design effect of 3.3**, a population variance of 2 032 125**, a maximum acceptable relative error of 3.5%, an average total current income per household of 14 896, a maximum expected non-response rate of 15% and an average of homes per housing unit of 1.02. The sample was 10%6 and was adjusted to 688 homes. After defining each TUA, a minimum of 5 questionnaires were assigned, and 694 questionnaires were left to be filled.
Sample Allocation
A base number of 688 housing units, approximately equally distributed in 65 TUAs, were considered to assign the sample to the urban level analyzed in the study (See Figure 1). The target population was housing units; thus, a proportional number of housing units were assigned to each TUA based on the framework obtained from the geographical coverage of AGEB in 2010. This ensured total coverage of each study area. In addition, a total of 694 housing units were considered to complement the sample universe studied, in case of a non-response of 15%.

Source: Prepared by the authors based on the XIII Census of Population and Housing (Inegi, 2010).
Figure 1: Creation of territorial units of analysis in Ciudad Juárez (2010)
Sample Selection
This section estimates the probability of each house being selected to be surveyed. The selection of the sample is performed independently for each TUA, and the procedure must conform to a random process for each of the areas mentioned above using the following method:
Out of the nt TUA composing the framework of the master sample, all the TUAs will be selected with equal probability.
In each TUA, Xn housing units will be selected with equal probability for the estimated sample.
Therefore, the probability of selecting a home of the i-th TUA, of the h-th stratum in Ciudad Juárez is as follows:
where
ni number of housing units selected, in the i-th TUA
mi number of housing units selected, in the h-th stratum
Ninumber of housing units, in the i-th TUA
Mi Mi number of housing units, in the h-th stratum
Questionnaire
After defining the TUAs, the questionnaire was designed. In this study, the same prompts applied by the Inegi for the MCS of the Enigh were included. The above was done with the aim of comparing results with the global poverty measurement conducted by Coneval for the municipality of Juárez. Survey implementation was carried out between the months of November 2011 and February 2012.
The Context of Poverty in Ciudad Juárez, Chihuahua and its Measurement at the Municipal Level
Several studies noted that northern border states were the most successful in reducing poverty between 1970 and 2000 (Anderson, 2003). In addition, these same states showed a lower percentage of people living in poverty than the national average, especially when considering extreme poverty (Camberos & Bracamontes, 1995). Similarly, Anderson and Gerber (2009) showed that the difference in per capita income between the border counties in the south of the United States and the border municipalities of Mexico was lower compared to other regions of Mexico. The above was explained by the rapid economic growth in the region. This growth is characterized by a high generation of jobs in the maquiladora industry, allowing social groups to use survival strategies such as those based on sharing multiple and different types of income among household members. This survival model was called “Resources of poverty” (González, 1986), and it depends on the existence and availability of a large number of jobs in the local market.
In the case of the state of Chihuahua, in particular the municipality of Ciudad Juárez, the social landscape radically changed starting in 2000. This change was the result of two events: the loss of employment manufacturing dynamics as a result of the downturn in the economy of the United States and a profound insecurity crisis that left thousands of people without an income. One the one hand, the local economy has seen a decrease in the rate of growth of manufacturing employment since 2000, and more than 80 000 jobs have been lost (Fuentes, 2009). In 2005, the local economy grew, but it did not reach the number of jobs it had in 2000. Later, starting in the year 2007, employment fell again as a result of the global economy recession (Fuentes & Peña, 2010).
On the other hand, the insecurity crisis arose as a result of the role of the city as a strategic space for illegal economies, in particular, the flow of drugs into the United States market (Fuentes & Peña, 2017). In that context, a confrontation between rival cartels to control drug trafficking routes and local markets took place and left thousands of people dead and missing. This situation had two effects. One was the closure of hundreds of shops and services in the face of increasing crime rates, including kidnapping and the extortion of businesses, which caused thousands of people to lose their jobs. The other was the social costs of violence; 9 262 homicides were recorded between 2008 and 2012 (Monarrez & Cervera, 2013), most of them young men. For this reason, thousands of homes lost their main economic providers, leaving hundreds of widows, orphans, fathers and brothers helpless. The combination of the two aforementioned factors has exacerbated poverty in the area since 2007.
Similarly, the loss of employment not only means no income but also the loss of social rights, including health care, social security, education and housing. This means that in very short periods of time, the population may suffer from deprivations, and according to the methodology of multidimensional poverty measurement, the bulk of the population will quickly move from vulnerable to poverty to living in moderate poverty and, in some cases, extreme poverty.
In this context, according to Coneval measurements (Coneval, 2010), in the period of 2008-2010, the state of Chihuahua experienced one of the greatest increases in the number of people living in poverty in the country. The reason is related to the fact that their two main urban areas, Ciudad Juárez and Chihuahua, experienced the impacts of the recession in the global economy and of the illicit economy more acutely. In this context, the Directorate of Social Development [Dirección de Desarrollo Social] of the municipal government of Juárez was overwhelmed by the increase in requests for funding or in-kind support in all of their social programs, especially with regard to family food rations. Consequently, the decision was made to apply poverty measurement at the intra-urban level with the following objectives: 1) to create a new poverty measurement, 2) to negotiate with other levels of government and obtain more resources and 3) to target their social programs.
The measurement results show that in 2012, people living in poverty represented 39.8%, which is higher than the estimate calculated by Coneval for the state of Chihuahua (35.3%). The number of people living in extreme poverty was 5.6%, 1.8% higher than that estimated for the state of Chihuahua (3.8%). The vulnerable population with social deprivation by income reached 22% and 15.9%, respectively. Finally, the multidimensional non-poor and non-vulnerable population reached 22.3% (see Table 1).
Table 1: Poverty measurement indicators in the municipality of Ciudad Juárez, Chihuahua, 2012
| Incidence indicators | % |
|---|---|
| Poverty | |
| Population living in poverty | 39.8 |
| Population living in moderate poverty | 34.2 |
| Population living in extreme poverty | 5.6 |
| Vulnerable population due to social deprivation | 22.0 |
| Vulnerable population due to income | 15.9 |
| Population not living in multidimensional poverty and not vulnerable | 22.3 |
| Social deprivation | |
| Population with at least one social deprivation | 64.3 |
| Population with at least three social deprivations | 11.0 |
| Indicators of social deprivation | |
| Educational Lag | 26.3 |
| Lack of access to health services | 31.4 |
| Lack of access to social security | 31.6 |
| Lack of quality housing space | 29.9 |
| Lack of access to basic housing services | 12.7 |
| Lack of access to food | 23.6 |
| Wellbeing | |
| Population whose income is less than the minimum wellbeing line | 15.0 |
| Population whose income is below the wellbeing line | 56.0 |
Source: Fuentes, Peña and Hernández (2012).
With regard to social deprivation, 64.3% of the population experienced at least one social deprivation, and 11.0% experienced at least three social deprivations. In addition, 31.6% (377 314 people) of the population show deprivations due to a lack of access to social security; 31.4% (786 008 people) show deprivation due to a lack of access to health services; 26.3% (317 179 people) exhibit deprivation due to an educational gap; 29.9% (455 605 people) exhibit deprivation due to a lack of housing quality and space; and 23.6% (355 605 people) show deprivation due to a lack of access to food.
With regard to income, 56% of the population has an income below the wellbeing line, and 15% has an income below the minimum wellbeing line. Thus, due to social deprivation, a high percentage of the population could be classified as moderately or extremely poor.
Multidimensional Poverty Measurement at the Intra-Urban Level in Ciudad Juárez, Chihuahua, 2012
The spatial distribution of the different types of poverty shows that the TUAs with the largest populations living in poverty are located in the western and southeastern parts of the city. This is due to the fact that they exhibit the greatest number of deprivations, with an average of 2.5.7 In addition, from the historical center toward the south, there is a cluster of TUAs that are vulnerable due to social deprivation. Finally, the TUAs with non-poor populations are concentrated in the northeast (see Figure 2).
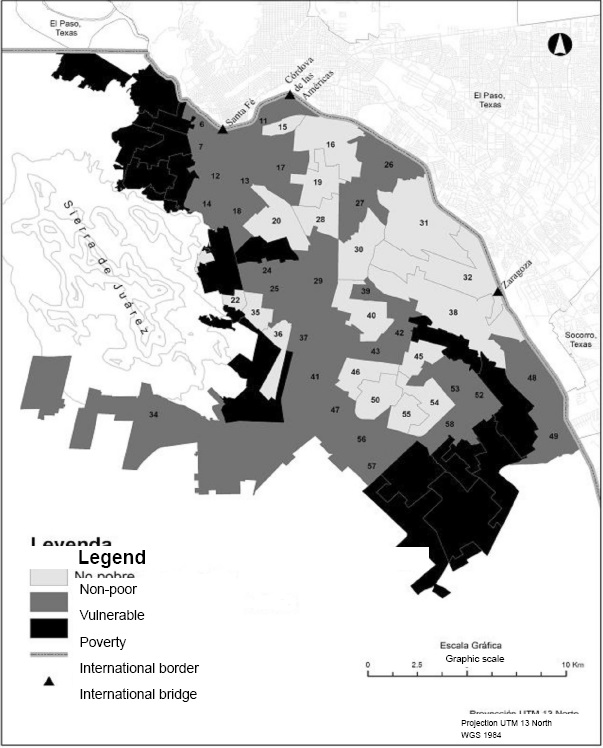
Source: Fuentes et al. (2012).
Figure 2: Location of the population living in poverty in Ciudad Juárez by TUA (2012)
In the city there are three clusters of extreme poverty. The first is located in the extreme northwest region, in an area known as Puerto Anapra, which was created through land encroachment and now exhibits a low coverage of public services. TUA 2 is located in this area, where 50% of the population lives in extreme poverty. TUA 3 presents a similar situation, where 42% of the population lives in extreme poverty. The second cluster of TUAs with populations living in extreme poverty is located to the southwest, on the exit to the highway that connects Ciudad Juárez with the state of Sonora. These settlements are informal growth areas characterized by a significant lack of infrastructure. In this area, 38% of the population lives in extreme poverty, and the remaining 62% lives in moderate poverty. The third cluster is located in the southeast, in areas of formal growth through affordable housing programs. TUA 34 is located in this area, where 38% of the population lives in extreme poverty (see Table 2b).
Table 2a: Percentage of the non-poor population and populations living in moderate poverty and extreme poverty with lack of access to health services and education by TUA (2012)
| TUA | Extreme poverty | Moderate poverty | Non-Poor |
|---|---|---|---|
| 1 | 34.78 | 65.22 | 0.00 |
| 2 | 50.00 | 50.00 | 0.00 |
| 3 | 41.94 | 48.39 | 9.68 |
| 4 | 7.14 | 75.00 | 17.86 |
| 5 | 50.00 | 42.86 | 7.14 |
| 6 | 0.00 | 81.25 | 18.75 |
| 7 | 25.00 | 58.34 | 16.67 |
| 8 | 30.30 | 45.46 | 24.24 |
| 9 | 25.71 | 42.86 | 31.43 |
| 10 | 0.00 | 80.00 | 20.00 |
| 11 | 38.46 | 50.00 | 11.54 |
| 12 | 4.88 | 68.29 | 26.83 |
| 13 | 25.00 | 36.11 | 38.89 |
| 14 | 4.08 | 81.63 | 14.29 |
| 15 | 7.69 | 23.08 | 69.23 |
| 16 | 0.00 | 76.67 | 23.33 |
| 17 | 32.43 | 43.24 | 24.33 |
| 18 | 19.05 | 66.67 | 14.29 |
| 19 | 3.45 | 37.93 | 58.62 |
| 20 | 2.94 | 44.12 | 52.94 |
| 21 | 27.27 | 45.45 | 27.27 |
| 22 | 0.00 | 75.00 | 25.00 |
| 23 | 11.54 | 76.92 | 11.54 |
| 24 | 28.94 | 63.16 | 7.89 |
| 25 | 16.32 | 46.94 | 36.74 |
| 26 | 40.00 | 0.00 | 60.00 |
| 27 | 0.00 | 73.08 | 26.92 |
| 28 | 9.37 | 31.25 | 59.38 |
| 29 | 24.39 | 53.66 | 21.95 |
| 30 | 0.00 | 30.77 | 69.23 |
| 31 | 0.00 | 33.34 | 66.66 |
| 32 | 6.06 | 57.58 | 36.36 |
Source: Fuentes et al. (2012).
Table 2b: Percentage of the non-poor population and populations living in moderate poverty and extreme poverty with lack of access to health services and education by TUA (2012)
| TUA | Extreme poverty | Moderate poverty | Non-Poor |
|---|---|---|---|
| 33 | 11.11 | 77.78 | 11.11 |
| 34 | 38.46 | 42.31 | 19.23 |
| 35 | 0.00 | 57.14 | 42.86 |
| 36 | 0.00 | 54.76 | 45.24 |
| 37 | 16.00 | 76.00 | 8.00 |
| 38 | 6.25 | 50.00 | 43.75 |
| 39 | 23.08 | 46.15 | 30.77 |
| 40 | 9.52 | 45.24 | 45.24 |
| 41 | 0.00 | 81.25 | 18.75 |
| 42 | 16.13 | 61.29 | 22.58 |
| 43 | 13.89 | 47.22 | 38.89 |
| 44 | 18.92 | 45.95 | 35.14 |
| 45 | 0.00 | 69.45 | 30.55 |
| 46 | 0.00 | 33.93 | 66.07 |
| 47 | 7.69 | 69.23 | 23.08 |
| 48 | 16.67 | 77.08 | 6.25 |
| 49 | 40.00 | 48.00 | 12.00 |
| 50 | 4.11 | 34.25 | 61.64 |
| 51 | 11.11 | 68.52 | 20.37 |
| 52 | 8.57 | 60.00 | 31.43 |
| 53 | 19.36 | 38.71 | 41.93 |
| 54 | 2.04 | 36.74 | 61.22 |
| 55 | 2.86 | 37.14 | 60.00 |
| 56 | 9.52 | 61.90 | 28.57 |
| 57 | 28.95 | 39.47 | 31.58 |
| 58 | 26.47 | 50.00 | 23.53 |
| 59 | 5.71 | 68.57 | 25.71 |
| 60 | 12.20 | 60.98 | 26.83 |
| 61 | 8.77 | 63.16 | 28.07 |
| 62 | 23.08 | 65.38 | 11.54 |
| 63 | 8.11 | 45.95 | 45.95 |
| 64 | 9.09 | 63.64 | 27.27 |
Source: Fuentes et al. (2012).
In contrast, the non-poor population is located in the northeast or close to major roadways that connect to the southeast of the city. For example, in TUA 15, 70% of the population is not poor (Table 2a). In TUAs 46 and 50, 66% and 61% of the population are not poor, respectively (see Table 2b).
Lack of access to social security is the indicator that contributes the most in this measure of poverty (see Table 3a). Deprivations due to gaps in social security refer to people who do not have access to benefits such as pensions or retirement. Deprivations in the whole town reached 31.6% of the population. In terms of the spatial distribution, the TUAs with the greatest gaps are grouped in the northwest of the city. For example, in TUAs 2 and 3, 59% and 38.7% of the population exhibit that gap. Similarly, there is another cluster of TUAs located in the neighborhoods surrounding the historic center, such as TUAs 10 and 11, where 53.3% and 61.5% of the residents experience those deprivations. Colonies with high percentages of the population in that situation include San Borja, Franja del Río, Sara Lugo, Ladrillera Juárez, Bosques del Valle, and Cuauhtémoc.
Table 3a: Percentage of social deprivation in Ciudad Juárez, Chihuahua, by TUA (2012)
| TUA | Lack of health services | Lack of educational services | Lack of social security | Lack of housing quality and space |
|---|---|---|---|---|
| 1 | 28.6 | 31.8 | 26.1 | 51.4 |
| 2 | 55.6 | 21.9 | 59.4 | 17.1 |
| 3 | 32 | 46.9 | 38.7 | 40.8 |
| 4 | 10.7 | 39.3 | 10.7 | 10.3 |
| 5 | 33.3 | 57.1 | 35.7 | 44.7 |
| 6 | 33.3 | 31.2 | 43.8 | 0.0 |
| 7 | 38.1 | 20.8 | 29.2 | 25.0 |
| 8 | 29.4 | 25.8 | 39.4 | 22.9 |
| 9 | 38.7 | 28.6 | 42.9 | 22.5 |
| 10 | 25 | 33.3 | 53.3 | 33.3 |
| 11 | 45.5 | 34.6 | 61.5 | 13.8 |
| 12 | 46.2 | 36.6 | 24.4 | 0.0 |
| 13 | 51.4 | 13.9 | 47.2 | 0.0 |
| 14 | 26.5 | 29.2 | 36.7 | 0.0 |
| 15 | 7.7 | 7.7 | 7.7 | 91.7 |
| 16 | 26.9 | 10 | 30.0 | 0.0 |
| 17 | 45.5 | 24.3 | 51.4 | 81.7 |
| 18 | 43.2 | 38.1 | 50.0 | 0.0 |
| 19 | 32.1 | 13.8 | 34.5 | 76.2 |
| 20 | 25 | 38.2 | 26.5 | 75.0 |
| 21 | 31 | 42.4 | 39.4 | 23.7 |
| 22 | 40 | 0 | 35.0 | 24.0 |
| 23 | 20.8 | 34.6 | 23.1 | 0.0 |
| 24 | 30.6 | 63.2 | 42.1 | 0.0 |
| 25 | 30.4 | 32.7 | 22.4 | 0.0 |
| 26 | 40 | 0 | 40.0 | 0.0 |
| 27 | 48 | 11.5 | 53.8 | 0.0 |
| 28 | 31.3 | 15.6 | 31.3 | 0.0 |
| 29 | 52.6 | 26.8 | 46.3 | 15.6 |
| 30 | 19.2 | 0 | 19.2 | 0.0 |
| 31 | 22.2 | 0 | 33.3 | 0.0 |
| 32 | 35.5 | 24.2 | 36.4 | 0.0 |
Source: Fuentes et al. (2012).
Lack of health services remained in second place. The clusters suffering from this deprivation are located to the northwest and around the Historic Center. In the northwest, for example, in TUAs 2 and 3, 55.6% and 32% of the population, respectively, have no health services. However, most people lacking health services are concentrated in the colonies surrounding the Historic Center, where mainly elderly people who no longer have health services live. For example, in TUAs 11, 12 and 13, 46%, 46% and 51% (Table 3a) of the population lacks health services, respectively. Public policies related to public health should target Franja del Río, Ampliación Ladrillera Juárez, Sara Lugo, Ladrillera Juárez, Oscar González, Buendía, Cumbres, and Paseo del Parque.
Lack of housing quality and space is ranked third as a source of poverty. This need is concentrated in the peri-urban areas, especially in the west. For example, 82% of the people living in TUA 64 lacks this service. Therefore, it is important to target programs territorially to improve housing in colonies such as Municipio libre, Periodista, Telegrafistas, Rancho Anapra, Frida Khalo, and Fray García de San Francisco (see Table 3b).
Table 3b: Percentage of social deprivations in Ciudad Juárez, Chihuahua, by TUA (2012)
| TUA | Lack of health services | Lack of educational services | Lack of social security | Lack of housing quality and space |
|---|---|---|---|---|
| 33 | 28 | 25.9 | 29.6 | 78.0 |
| 34 | 42.3 | 34.6 | 46.2 | 40.7 |
| 35 | 9.4 | 37.1 | 14.3 | 0.0 |
| 36 | 21.9 | 16.7 | 19.0 | 14.3 |
| 37 | 47.9 | 16 | 44.0 | 8.0 |
| 38 | 34.4 | 21.9 | 31.3 | 0.0 |
| 39 | 30.8 | 25.6 | 28.2 | 10.7 |
| 40 | 41.5 | 45.2 | 40.5 | 9.8 |
| 41 | 18.8 | 21.9 | 15.6 | 0.0 |
| 42 | 41.9 | 35.5 | 35.5 | 0.0 |
| 43 | 38.9 | 11.1 | 27.8 | 13.3 |
| 44 | 40.5 | 21.6 | 43.2 | 18.6 |
| 45 | 22.2 | 16.7 | 25.0 | 0.0 |
| 46 | 12.5 | 25 | 14.3 | 0.0 |
| 47 | 19.2 | 53.8 | 7.7 | 15.2 |
| 48 | 39.6 | 14.6 | 33.3 | 37.5 |
| 49 | 41.7 | 28 | 32.0 | 41.9 |
| 50 | 11.8 | 16.4 | 15.1 | 0.0 |
| 51 | 40.7 | 14.8 | 38.9 | 20.0 |
| 52 | 28.6 | 17.1 | 28.6 | 32.6 |
| 53 | 29.5 | 19.4 | 29.0 | 22.4 |
| 54 | 25 | 20.4 | 22.4 | 0.0 |
| 55 | 20 | 22.9 | 11.4 | 0.0 |
| 56 | 29.3 | 19 | 21.4 | 16.3 |
| 57 | 18.4 | 23.7 | 26.3 | 29.0 |
| 58 | 25 | 41.2 | 29.4 | 37.8 |
| 59 | 22.9 | 20 | 17.1 | 17.9 |
| 60 | 41.5 | 29.3 | 26.8 | 12.8 |
| 61 | 36.8 | 36.8 | 29.8 | 0.0 |
| 62 | 38.5 | 46.2 | 23.1 | 40.0 |
| 63 | 8.3 | 35.1 | 16.2 | 13.6 |
| 64 | 23.3 | 36.4 | 27.3 | 82.0 |
Source: Fuentes et al. (2012).
The estimation of the educational gap in the whole city is 26.3% of the population, which is ranked fourth as a source of poverty. The TUA groupings with educational gaps are located in the northwest and southeast regions. The northwest exhibits the greatest need, including TUAs 3, 4, 5, 14, 18 and 24, in which the percentage of the population with an educational gap ranges from 26.5% to 63%. Similarly, in the southeast, there is a cluster, smaller in size, where more than 50% of the residents of the TUAs have such social problems. The main colonies with the highest educational gaps are Periodista, San Felipe del Real, Torreón, Luis Olague, Constituyentes, Santa Lucia, Valle de los Cantaros, Valle de los Olivos, and Puente del Bravo, among others.
The two indicators with the lowest percentages of the population were a lack of access to food and a lack of access to basic housing services.
In the economic sphere, the population whose income is below the minimum wellbeing line (MWL) represented 33.6% of the population, with most of it concentrated in the northwest and southeast regions. In TUAs 2, 7 and 8, more than 60% of the population experiences this problem. The colonies whose population has the highest deprivations are San Borja, Miguel Auza, Franja del Río, El Sauzal, Francisco Villa, Lomas del Valle, La Mesita, Ladrillera Juárez, and Sara Lugo.
To continue with the measurement of multidimensional poverty, it is necessary to account for a series of measures that indicate the magnitude and state of poverty, including its incidence, intensity and depth. “The measures of depth8 and intensity9 of poverty are valuable to know how poor people are in terms of both economic and social lacks” (Coneval, 2017, p. 44).
In Table 4, measurements regarding poverty intensity by TUA in Ciudad Juárez are presented. The intensity of poverty is greater in the TUAs in the northwest, such as TUAs 1, 2, 3, and in the southeast, such as TUAs 44, 61, 63 and 64 (see Table 4). In addition, not only is there a higher proportion of poor people in TUAs 1, 2 and 3 but the depth of poverty is also highest in those places, reaching .37, .38 and .35, respectively. This is due to the fact that on average, they present higher numbers of deprivations (2.25, 2.32 and 2.39). In contrast, in TUAs 61, 63 and 64, inhabitants have a lower depth of poverty, .18, .14, and .17, respectively, because they have, on average, the lowest number of deprivations, 1.07, .80 and 1.05.
In the case of incidence, TUAs 1 and 2 have a value of 1.0, which means that 100% of their residents are living in poverty. However, the poverty intensity in TUA 2 is lower than that in TUA 1; therefore, in TUA 2, the population is not as poor.
Table 4: Intensity, depth and incidence of multidimensional poverty by TUA in Ciudad Juárez, Chihuahua (2012)
| TUA | Incidence | Depth | Intensity |
|---|---|---|---|
| 2 | 1.00 | 0.38 | 0.38 |
| 5 | 0.93 | 0.40 | 0.37 |
| 1 | 1.00 | 0.37 | 0.37 |
| 3 | 0.90 | 0.35 | 0.32 |
| 62 | 0.88 | 0.31 | 0.28 |
| 8 | 0.76 | 0.30 | 0.22 |
| 23 | 0.88 | 0.24 | 0.22 |
| 33 | 0.89 | 0.22 | 0.20 |
| 51 | 0.80 | 0.23 | 0.18 |
| 21 | 0.73 | 0.24 | 0.18 |
| 4 | 0.82 | 0.21 | 0.17 |
| 9 | 0.69 | 0.24 | 0.17 |
| 10 | 0.80 | 0.20 | 0.16 |
| 60 | 0.73 | 0.22 | 0.16 |
| 44 | 0.65 | 0.20 | 0.13 |
| 59 | 0.74 | 0.18 | 0.13 |
| 61 | 0.72 | 0.18 | 0.13 |
| 64 | 0.73 | 0.17 | 0.13 |
| 63 | 0.54 | 0.14 | 0.08 |
Source: Fuentes et al. (2012).
Conclusions
The progress made in Mexico in compliance with the law of social development has allowed Mexican society to conduct a multidimensional poverty measurement at the national, state and municipal levels (every two years in the first two cases and every five years in the third case). This has made it possible to design a series of public policies that help reduce social deprivation for the population. However, it had been impossible to measure at the intra-urban level due to the statistical representativeness of the information sources, which made targeting social programs at the urban scale difficult.
In this context, the local government of Ciudad Juárez made efforts to measure poverty using the same methodology as Coneval to generate reliable information at the intra-urban level, with the aim of targeting, evaluating and, eventually, replicating social programs. In addition, the objective was to use this information as a negotiation tool with the state and federal governments regarding education, health, housing, etc., to implement programs in the areas with the highest social deprivation.
This information is relevant during profound insecurity crises, as in the case of Ciudad Juárez, where thousands of people have been left without a provider. Sons, fathers, husbands and brothers have been murdered, leaving families without an economic livelihood and social rights. At the same time, due to the global economic recession and the situation of insecurity, thousands of jobs have been lost, which in turn has resulted in no income or medical services, among other effects, contributing to the increase in the indicators of poverty in the city.
In addition, the municipal government of Juárez sought to justify the increase in public resources to address the social crisis and decided to perform a new poverty measurement through the implementation of the “official” methodology because in Mexico, the result of the “official” poverty measurement is one of the criteria required for the allocation of federal government resources for social programs.
The intra-urban level methodology makes it possible to identify people living in poverty and the social deprivation that contributes the most to poverty in each TUA. This makes it possible to implement differentiated public policy actions for each case. Similarly, the measures of intensity, depth and incidence of poverty make it possible to assess both the economic dimension and social deprivations with the objective of targeting public policy programs in the territory.
Finally, it is important to recognize the challenges and limitations of the intra-urban level measurement in Ciudad Juárez. The main challenge is the lack of funds to carry out a survey of thousands of questionnaires with the aim of improving the quality of the estimate. The greatest difficulty was capturing reliable information in the survey regarding income in a context of extreme violence in which people are not willing to provide such information for reasons of safety.
Acknowledgments
The authors are grateful for the financial support provided by the Mixed Fund Conacyt-Municipal Government of Juárez (Fondo Mixto Conacyt-Gobierno Municipal de Juárez) to complete this work. We give special thanks to the anonymous reviewers for their valuable suggestions to improve the article.
REFERENCES
Anderson, J. (2003). The US-Mexico Border: A Half Century of Change. The Social Science Journal, 40(4), 535-554. [ Links ]
Anderson, J. y Gerber, J. (2009). Fifty Years of Change on the US-Mexico Border: Growth, Development, and Quality of Life. Estados Unidos: University of Texas Press. [ Links ]
Banco Mundial. (1990). The World Development Report 1990: Poverty. Nueva York, Estados Unidos de América: Oxford University Press. [ Links ]
Barneche, P., Bugallo, A., Ferrea, H., Ilarregui, M., Monterde, C., Pérez, V., Santa María, T., Serrano, S. y Angeletti, K. (2010). Métodos de medición de la pobreza: conceptos y aplicaciones en América Latina. Entrelíneas de la Política Económica, 26(4), 31-41. [ Links ]
Beccaria, L. y Minujin, A. (1987). Métodos alternativos para medir la evolución del tamaño de la pobreza (Documento de trabajo, núm.6). Buenos Aires, Argentina: Documentos del Instituto Nacional de Estadística y Censos (INDEC). [ Links ]
Boltvinik, J. (1990a). Hacia una estrategia para la superación de la pobreza. En J. Boltvinik, Necesidades Básicas y Desarrollo (pp.25-50). La Paz, Bolivia: ILPES, ILDIS, Instituto de Estudios Sociales de La Haya. [ Links ]
______ (1990b). Pobreza y necesidades básicas. Conceptos y métodos de medición. Caracas, Venezuela: PNUD. [ Links ]
______ (1992). El método de medición integrada de la pobreza. Una propuesta de su desarrollo. Comercio Exterior, 42(4), 354-365. [ Links ]
______ (2003). Tipología de los métodos de medición de la pobreza. Los métodos combinados. Comercio Exterior, 53(5), 453-465. [ Links ]
Boltvinik, J. y Hernández, E. (1999). Pobreza y distribución del ingreso en México. México: Siglo XXI editores. [ Links ]
Caloca, O.R. y Ortiz, E.O. (2016). Situación espacial de la pobreza en el Distrito Federal, Milpa Alta 1990-2010. Análisis Económico, XXXI(76), 95-122. [ Links ]
Camberos, M. y Bracamontes, J. (1995). Análisis comparativo de la pobreza en la frontera norte de México. México: Centro de Investigación en Alimentación y Desarrollo. [ Links ]
Comité Técnico para la Medición de la Pobreza (CTMP). (2002). Medición de la pobreza: variantes metodológicas y estimación preliminar (Documentos de Investigación, Vol.1). México: Sedesol. [ Links ]
Consejo Nacional para la Evaluación de la Política Social (Coneval). (2009). Informe de pobreza multidimensional 2008. México: Coneval. [ Links ]
______ (2010). Metodología para la medición multidimensional de la pobreza en México. México: Coneval. [ Links ]
______ (2011). Pobreza en México y las entidades federativas 2008-2010. México: Coneval. [ Links ]
______ (2017). Informe de la evolución de la pobreza 2010-2016. México: Coneval. [ Links ]
Cortés, F., Benegas, I., Fernández, T. y Mora, M. (2007). Perfiles de la pobreza en Chiapas. Sociológica, 22(63), 19-50. [ Links ]
Damián, A. (2009). La pobreza, los hogares y la ocupación en el DF en 2004, El Colegio de México y el Consejo de Evaluación del Desarrollo Social en el Distrito Federal. (Informe de Investigación). México: Consejo de Evaluación del Desarrollo Social del DF, El Colegio de México. [ Links ]
Feres, J. y Mancero, X. (2000). El método de las necesidades básicas insatisfechas (NBI) y sus aplicaciones en América Latina. En Taller 5: La medición de la pobreza: métodos y aplicaciones. Programa para el mejoramiento de las encuestas y la medición de las condiciones de vida en América Latina y el Caribe (Mecovi). CEPAL. [ Links ]
Fuentes, C.M. (2009). La estructura espacial urbana y accesibilidad diferenciada a centros de empleo en Ciudad Juárez, Chihuahua. Región y Sociedad, XX(44), 117-144. [ Links ]
Fuentes, C.M. y Peña, S. (2010). Globalization and its Effects on the Urban Socio-Spatial Structure of a Transfrontier Metropolis: El Paso, Tx.-Ciudad Juárez, Chih.-Sunland Park, NM. En K. Staudt, C. Fuentes y J. Monárrez (Eds.), Cities and Citizenship at the U.S.-Mexico Border: The Paso del Norte Metropolitan Region (pp.93-117). Nueva York, Estados Unidos de América: Palgrave Macmillan. [ Links ]
______ (2017). Las fronteras de México: Nodos del sistema global de las drogas prohibidas. México: Flacso, IDRC, CRDI, El Colef. [ Links ]
Fuentes, C.M., Peña, S. y Hernández, V. (2012). La geografía de la pobreza urbana en Ciudad Juárez, Chihuahua: Dinámica y evolución. México: El Colef, Conacyt, Fomix, Gobierno Municipal de Juárez. [ Links ]
Garza-Rodríguez, J. (2016). Los determinantes de la pobreza en los estados mexicanos en la frontera con Estados Unidos. Estudios Fronterizos, 17(33), 1-19. [ Links ]
González, M. (1986). Los recursos de la pobreza. Familias de bajos ingresos en Guadalajara. México: El Colegio de Jalisco, CIESAS. [ Links ]
Gordon, D. (2006). The Concept and Measurement of Poverty. En C. Pantazis, D. Gordon y R. Levitas (Eds.), Poverty and Social Exclusion in Britain (pp.28-69). Gran Bretaña, Reino Unido: The Millennium Survey, Bristol, The Policy Press. [ Links ]
Instituto Nacional de Estadística, Geografía e Informática (Inegi). (1990). Censo de Población y Vivienda. México: Inegi. [ Links ]
______ (2000). XII Censo de Población y Vivienda. México: Inegi. [ Links ]
______ (2010). XIII Censo de Población y Vivienda. México: Inegi. [ Links ]
______ (2011). Metodología para la medición multidimensional de la pobreza en México. Revista Internacional de Estadística y Geografía, 2(1), 33-48. [ Links ]
Limas, M. (2010). Geografía de la pobreza en Ciudad Juárez: una perspectiva de género. México: Universidad Autónoma de Ciudad Juárez. [ Links ]
Monárrez, J. y Cervera, L. (2013). Spatial and temporal behavior of three paradigmatic cases of violence in Ciudad Juarez, Chihuahua Mexico: Feminicide, homicide and involuntary disappearances of girls and women (1993-2013). México: El Colegio de la Frontera Norte. [ Links ]
Sánchez, A., Boltvinik, J., Ruiz, F. y Figueroa, H. (2011). Índice de desarrollo social de las unidades territoriales del Distrito Federal delegación, colonia y manzana. México: Evalúa DF, Consejo de Evaluación del Desarrollo Social del Distrito Federal. [ Links ]
1 Indirect measurement examines whether household resources (usually reduced to current income) are sufficient to meet people’s needs, regardless of whether this happens. Another way to distinguish direct from indirect measurement is to call the former factual and the latter potential (Boltvinik, 2003).
2 One-dimensional methods refer to a single dimension and multidimensional methods to various dimensions of wellbeing (Boltvinik, 2003).
3 Normative methods define the threshold separating the poor from the non-poor based on a notion of a minimum level of acceptable life or basic needs to be fulfilled and the specifics required for this condition to be met (Boltvinik, 2003).
4 This section does not present a detailed review of the methodology applied by Coneval. For a comprehensive review see Inegi (2011).
5 Because there are no income estimates for each AGEB, “proxy” indicators were used to help form the strata.
6 The sample size justification is based on the fact that by selecting 10%, the error remains acceptable and the benefit of increasing the sample to minimize the error is very marginal.
7 The multidimensional poverty measurement uses two criteria for its measurements: income below the wellbeing line and lack of access to rights regarding health, education, social security, etc. (deprivations). Thus, it is possible to determine the average number of deprivations in each TUA.
8 The depth measurement regarding economic wellbeing makes it possible to understand the gap or average distance between those whose income is at the wellbeing line (WL) and those whose income is below that line. With regards to social rights, the depth measure helps us to identify the average and the average proportion of social lacking suffered by a group of people and identify which deprivations will have to be overcome (Coneval, 2017).
9 The measure of intensity quantifies the total number of deprivations suffered by those who live in extreme and moderate poverty in relation to the maximum number of deprivations that the population may experience (Coneval, 2017).
Received: September 21, 2016; Accepted: September 20, 2017
 Este es un artículo publicado en acceso abierto bajo una licencia Creative Commons
