


Servicios Personalizados
Revista
Articulo
 texto en
  Inglés (pdf)
 Artículo en XML
 Referencias del artículo
 Enviar artículo por email
Indicadores
-
 Citado por SciELO
 -
 Accesos
Links relacionados
-
 Similares en
SciELO
Similares en
SciELO
Compartir

 Permalink
Estudios fronterizos
versión On-line ISSN 2395-9134versión impresa ISSN 0187-6961
Estud. front vol.18 no.35 Mexicali ene./abr. 2017
https://doi.org/10.21670/ref.2017.35.a03
Articles
Vegetation conservation to reduce hidrometeorological risks on a border metropoli

a El Colegio de la Frontera Norte, Departamento de Estudios Ambientales y de Medio Ambiente, Tijuana, Baja California, México, correos electrónicos: yochoa@colef.mx, lojeda@colef.mx
Land cover change affects landscape dynamics, especially in big cities, which leads to increased risks when extreme meteorological events occurs and reduces resilience capacity. The Tijuana-Tecate-Rosarito metropolitan area, characterized by a rough topography, lack of green space, high biodiversity and endemism, is prone to landslide and floods risks. To solve these problems, this study proposes a green infrastructure plan (interconnected green spaces). Based on the construction of a land use-cover map using satellite images, the plan includes the conservation of risk areas of steep slopes, water courses and unique biodiversity areas and analyzes different scenarios and their legal feasibility. Results show that by enforcing legislation and not constructing on risk areas, a great part of the natural vegetation with good connectedness can be conserved. If special ecological areas are introduced, conservation areas and their connectedness increase. That said, existing regulations are insufficient, dispersed or not enforced.
Keywords: green infrastructure; ecosystem services; risks; metropolitan area; Tijuana
El cambio de uso del suelo afecta la dinámica del paisaje especialmente en las ciudades, lo que incrementa el riesgo ante eventos meteorológicos extremos y reduce la capacidad de resiliencia. La Zona Metropolitana de Tijuana-Tecate-Rosarito, con topografía accidentada, pocas áreas verdes, alta biodiversidad y endemismos, presenta riesgos de deslaves e inundaciones. Se propone crear infraestructura verde (red de áreas verdes) sobre pendientes pronunciadas, cursos de agua y áreas con biodiversidad especial. Con estas variables e imágenes de satélite se construyeron mapas de usos del suelo y vegetación y escenarios de conservación, se analizó su conectividad y su factibilidad legal. Gran parte de la vegetación con alta conectividad se conserva solo cumpliendo la legislación de no construir en áreas de riesgo. Al sumar las áreas con biodiversidad especial, aumenta la superficie a conservar y su conectividad. Sin embargo, la legislación existente no es suficiente, está dispersa o no se aplica.
Palabras clave: infraestructura verde; servicios ecosistémicos; riesgos; zona metropolitana; Tijuana
Introduction
Landscapes are an organizational level of ecosystems and the perceptible expression of the system of ecological processes in a determined physical-spatial context (Forman, 1995). They are comprised of three structural elements: patches, habitat corridors, and a matrix, which is the most extensive and connected habitat of a landscape. The connectivity or degree of spatial distribution between these elements create mosaics of morphological and functional units, where the function is determined by the flow of energy, and materials (vegetation, animals, energy, minerals, water and other elements) through the landscape. The connectivity or degree of spatial connection between the elements of the landscape has ecological effects on these flows (Forman, 1995). Moreover, there are processes of disturbances, uncertainty and risk that cause the ecosystems to continually change within certain ranges that vary with time, magnitude and scale. An event that significantly changes the variation pattern of the structure and function of a system is considered a disturbance (Wolch, 1996).
Human beings have modified the Earth's surface with agriculture, livestock farming and urban areas. Approximately 33% has been turned into farming and grazing areas (Defries, Foley & Asner, 2004). Although urban areas only represent 1-3% of the changes, it is there that more than 50% of the world population can be found and therefore that of the consumption of resources and contamination, with great implications at a local, regional, and possibly global scale (Schneider, Friedl & Potere, 2009).
Urban settlements modify the landscape establishing an artificial and dynamic system that alters the geoclimatic, hydrological and ecological cycles, affecting the surrounding ecosystems and themselves (Puente, 1996). These cycles not only transport and distribute matter and energy; rather, they are also self-regulating mechanisms that stabilize the spatial conditions for all life-forms, including human beings (Flores, Picket, Wayne, Pouyat & Pirani, 1998). With the modification of the landscape, the scale of the natural disturbances changes in magnitude, frequency and intensity; and new disturbances, biogeographic barriers and degrees of connectivity are introduced (Alberti & Marzluff, 2004).
Cities are the main emitters of greenhouse gases, which are key issues in climate change (Wilby & Perry, 2006). They produce an increase in temperature (urban-heat-island effect) (Wilby & Perry, 2006) and runoffs due to impervious surfaces (Whitford, Ennos & Handley, 2001), which affect the quality of the air and water (McKinney, 2002) and produce a loss of habitat and biodiversity (Wu, 2008).
These actions have unbalanced the ecosystems, decreasing the quantity and quality of the services they provide (Defries et al., 2004). The ecosystem services are the benefits that society obtains from nature. They can be for provisioning, such as food and wood; regulating, such as the modulation of climate and erosion; cultural, whether material or immaterial, that depend on human perceptions; and supporting, those ecological processes that are essential for the ecosystems to function, such as cleaning the air, among others (Balvanera & Cotler, 2011).
Therefore, urban areas depend especially on their degree of adequacy to the natural conditions where they reside and on the dynamic of the natural phenomena to which they are subjected, and thus they are highly dependent and vulnerable to the stability of nature’s cycles (Puente, 1996).
Resilience is the capability of the interconnected ecosystems to persist in the landscape in the face of disturbances and to continue with their structure and functions (Holling & Gunderson, 2002). Spatially, it is related with the connections of a fragment with its surroundings and internal factors (Nyström & Folke, 2001). In cities, the capability of resilience depends on the urban form, of the land use patterns and on the local and spatial ecological processes (Colding, 2007; Pickett, Cadenasso & Grove, 2004). When resilience is lost, the ecosystem becomes more vulnerable to disturbances which could have previously been absorbed (Holling & Gunderson, 2002).
If urban areas are conceived as dynamic self-regulating systems, their resilience capability could be built, even though the magnitude, frequency or extent of the disturbances cannot be predicted, they can offer long-term ecosystem services in a context of urban dynamics and disturbances (Ahern, 2013). Therefore, there is the need to establish planning strategies that could address the management of resilience in the urban-territorial framework (Moreno, 2013).
It is known that green space in cities provide multiple benefits: they help reduce the urban-heat-island effect and improve hydrology by avoiding superficial runoff, while replenishing underground water. They can also act as buffers in the face of extreme events such as floods, and as rainwater sinks, reducing the risk of disasters and providing adaptation (Benedict & McMahon, 2006; Tzoulas et al., 2007).
The principles of landscape ecology, under the model of patch-corridor-matrix, provide a green space taxonomy (Forman, 2008) that helps create more sustainable spatial arrangements of the landscape (Ndubisi, 2002). These principles are considered in the green infrastructure (GI) concept, designed as an interconnected network of green space─urban, peri-urban and rural─that preserve and contribute multiple functions to the ecosystems and environmental services for the human population (Benedict & McMahon, 2006). The concept implicitly includes connectivity, which contributes to the functioning of the landscape (Momm-Schult et al., 2013), to the provision of ecosystem services and to build resilience capability (Moreno, 2013).
Within this framework, this article presents the scopes of the planning and design of the GI landscape focused on the mitigation of risks due to floods, mudslides and landslides, and the preservation of biodiversity, in the context of the metropolitan area of Tijuana-Tecate-Rosario (ZMTTR) in Baja California, Mexico. The objective is to find adequate zones in not yet developed areas in order to establish GI, measure its degree of connectedness and determine its degree of feasibility in the current legislative framework.
Study area
Recognized in 2004 as a geographic, economic and social unit, to jointly plan and regulate the development (Gobierno del Estado de Baja California, 2004, p. 16), the ZMTTR is located to the northwest of Baja California, Mexico. It shares borders to the north with the United States (USA), it adjoins to the West with the Pacific Ocean, and covers 139 864.44 ha (1.68% of the state) (Venegas & Rojas, 2009). It is comprised by three municipalities: Tijuana, Tecate and Playas de Rosarito (Rosarito) (Figure 1).

The prevailing climate is Mediterranean in type, with cold winters and rain in winter, temperate with a warm summer, and temperatures between 10º and 22ºC (García, 2004). The annual precipitation varies with elevation, between 273 and 500 mm yearly. In the municipalities of Tijuana and Tecate, the Tijuana River is formed from the junction of an intermittent and dense hydrological network shared with the USA, that in winter could be torrential, but which disappears the rest of the year. The river crosses through the city of Tijuana and deposits its waters through an estuary into the Pacific Ocean, which is a protected area of the USA. In the Municipality of Rosarito, the existing streams drain to the Pacific (Instituto Nacional de Estadística Geografía e Informática [Inegi], 1995). With scare precipitation and limited bodies of surface water, the area suffers a lack of water (Gobierno del Estado de Baja California, 2013).
A great part of the area has a rugged topography (Ojeda-Revah, 1999), with easily eroded soils, with high permeability but low water retention, and thus quickly saturated, unstable and easy to flood. By removing the vegetation, water filtration problems present themselves, favoring superficial water runoff and erosion (Food and Agriculture Organization of the United Nations [FAO], 2001; Inegi, 2004; Secretaría de Medio Ambiente y Recursos Naturales [Semarnat], 2012). Moreover, the area is subject to earthquakes, due to its location in the North American and Pacific Tectonic plates junction (Mendoza, Acosta & Vázquez, 2009), which aggravates the landslide problems.
The area is found within the California Floristic Province, rich in endemism and species diversity (Riemann & Ezcurra, 2007), recognized as one of the world’s 25 biodiversity hotspots, threatened by the rapid urban growth (Myers, Mittermeier, Mittermeier, Fonseca & Kent, 2000). The main types of vegetation that grow in the area are: oak forests, riparian vegetation, coastal sage scrub and chaparral (Oberbauer, 1999). It is worth mentioning that chaparral and coastal sage scrub are ecosystems adapted to a natural fires regime, and some of their species require them for their survival (Lippitt, Stow, O’Leary & Franklin, 2013).
Due to the scattered urban growth, these ecosystems have been reduced and fragmented in order to give way to the urban and to induced grasslands (Farley, Ojeda-Revah, Atkinson & Eaton-González, 2012), threatening the regional biodiversity (Riemann & Ezcurra, 2007).
Although the growth rates of Tijuana, Tecate and Rosarito decreased from 2000-2010 (2.56, 2.65 and 2.63, respectively) with regard to the period of 1990-2000 (4.94, 4.19 and without information, respectively1), these are still greater to the average in the country (1.4%) (Inegi, 2013). By 2010 the population of the ZMTTR reached 1 751 430 habitants (55% of the state), distributed in 8.9, 5.8 and 5.2%, respectively (Inegi, 2010).
Due to its location at the border with the USA, Tijuana in particular grew quickly, encouraged by a high flow of immigration, as a center of commerce and services and a site of industrialization to supply foreign markets (Sánchez-Rodríguez, 2011). Its population grew from 240 000 in 1970 to 1 519 452 in 2010 (Inegi, 2010) and its area increased an average of 1.74 ha per day between 1972 and 2000, a figure that reached 5.24 ha between 1984 and 1994 (Bringas & Sánchez, 2006).
With an accelerated growth, limited planning and a lag in its capacity to meet the demands of the population (Sánchez-Rodríguez, 2011), a large part of the city had an irregular origin (almost 57%) (Alegría & Ordoñez, 2005). With this, the number and area of human settlements increased progressively on high risks places (steep slopes and natural water courses) (Bringas & Sánchez, 2006). The modifications in the landscape on large areas with incomplete urbanization, inefficient networks of storm drainage and changes in the stability of slopes due to urbanization, caused the reduction in rainwater filtration and accelerated water runoff, while increasing floods risks and creating slope stability problems during the rainy seasons (Sánchez-Rodríguez, 2011). In fact, in 1993, Tijuana suffered the consequences of a greater than usual rainfall, causing landslides, floods and material and economic damages, a situation that did not occur in the near rural localities, nor in the slopes covered in vegetation (Bocco, Sánchez & Riemann, 1993), which in turn would allow water infiltration in the subsoil and thus decrease surface runoff (American Planning Association [APA], 2013).
As in the case of Tijuana, Tecate shows floods, collapses and landslides (Ganster, 2002), and these latter two could be intensified by the activity of San Andrés Fault (Ayuntamiento de Tecate, 2011) and Playas de Rosarito is affected by erosion, floods and embankment instability (Mendoza et al., 2009).
In this scenario, green space (parks) have been sidelined. In Tijuana they cover less than 1% of the city’s area, and offer 1 m2 of parks per habitant, although only 35% of the population have access to them (400m), in addition to the fact that most of them are rather small, poorly maintained and deprived of vegetation (Huizar & Ojeda-Revah, 2014). Tecate only has 3 public and 2 private parks (Sierra, 2002) and according to the City Council of Playas de Rosarito (2014, p. 140), it has “16.5 m2 of green space per habitant in 40 residential developments, even though the figure reaches 5.5 m2 in the beach area”.
Methods and techniques
With the objective of knowing the current state of the ZMTTR, we built a map of land use and vegetation covers using ArcGis 10.2 and SPOT satellite images (December 31, 2012, and January 21, 2013), at a scale of 1:50 000 with a 30 m resolution. The study area was established based on Venegas and Rojas (2009). The land use and vegetation covers were interpreted visually and digitalized on screen, corroborating with Google Earth, with the 2005 map of the Cuenca del Río Tijuana elaborated by Farley et al. (2012) and with field work, verifying the assignation of 20% of the total of identified polygons. The classification of soil uses and vegetation covers of Ojeda-Revah (1999) was used and adapted to the region (oak forest, chaparral, coastal scrub, riparian vegetation, seasonal and irrigation agriculture, urban and dams).
In order to determine the potential of green infrastructure, three scenarios were built using the following criteria:
Risk areas (slopes >35% and natural water courses with buffer areas and riparian vegetation).
Risk areas and outstanding ecological places.
Risk areas, outstanding ecological places and natural vegetation belt surrounding cities.
In the first scenario, the risk areas were chosen based on federal legislation, the slopes greater than 30% were chosen due to not being apt for construction due to the probability of collapse and thus considered for preservation, the recharge of area aquifers and in order to avoid contamination (Secretaría de Desarrollo Social [Sedesol], 1993/2014). The pronounced slopes were obtained from the Digital Elevation Models (DEM) of the Inegi, at a scale of 1:50 000 (2014).
The natural water flows were also considered, where the Law of National Waters, due to the risk of floods, restricts construction and establishes a buffer area of 10 meters (Secretaría de Agricultura y Recursos Hidráulicos [SAHR], 1992/2014). In order to create the map, the direction of the drainage flow was determined, the accumulated flow (hydrologic network) was calculated establishing drainage orders (Strahler, 1957) and the buffer zones were demarcated in those of greater affluence. In the areas where the riparian vegetation was more extensive, the buffer areas were broadened, as they reflect greater probability of flooding (APA, 2013).
For the second scenario, the outstanding ecological places were obtained with the overlap of the distribution of special vegetation populations described by Oberbauer (1999) and the only fragment of oak forest of the ZMTTR, identified in the field and the Biodiversity Priority Land Region Santa María-El Descanso (Biodiversity Priority Region) designated by the National Commission for the Knowledge and Use of Biodiversity due to its high floristic endemism (Comisión Nacional para Conocimiento y Uso de la Biodiversidad [Canabio], 2012).
In the third scenario, and with the idea of containing the fragmented urban growth and increase the connectivity of the proposed green infrastructure, a green belt was drawn around the three cities. Given that there are no established values to determine their width, we took as base the 2 km calculated for the corridors of large mammals in the south of California (Beier, Penrod, Luke, Spencer & Cabañero, 2006). By being designed as a green belt and not a corridor, this value was reduced averaging it with the 0.30480 km, the width for short corridors established by the San Diego Environmental Mitigation Program Working Group (2011, p. 4) that is part of the San Diego Agency of Regional Planning (SANDAG). The resulting value was rounded to a width of 1 km.
The structure of the landscape and its connectivity was determined with composition and configuration indexes (Table 1), using the FRAGSTATS 4 program. The first refers to the diversity and abundance of the patch covers within the landscape, not considering their spatial location, whereas the latter does consider their location and how they are distributed among themselves (McGarigal, 2006).
Table 1: Landscape indexes
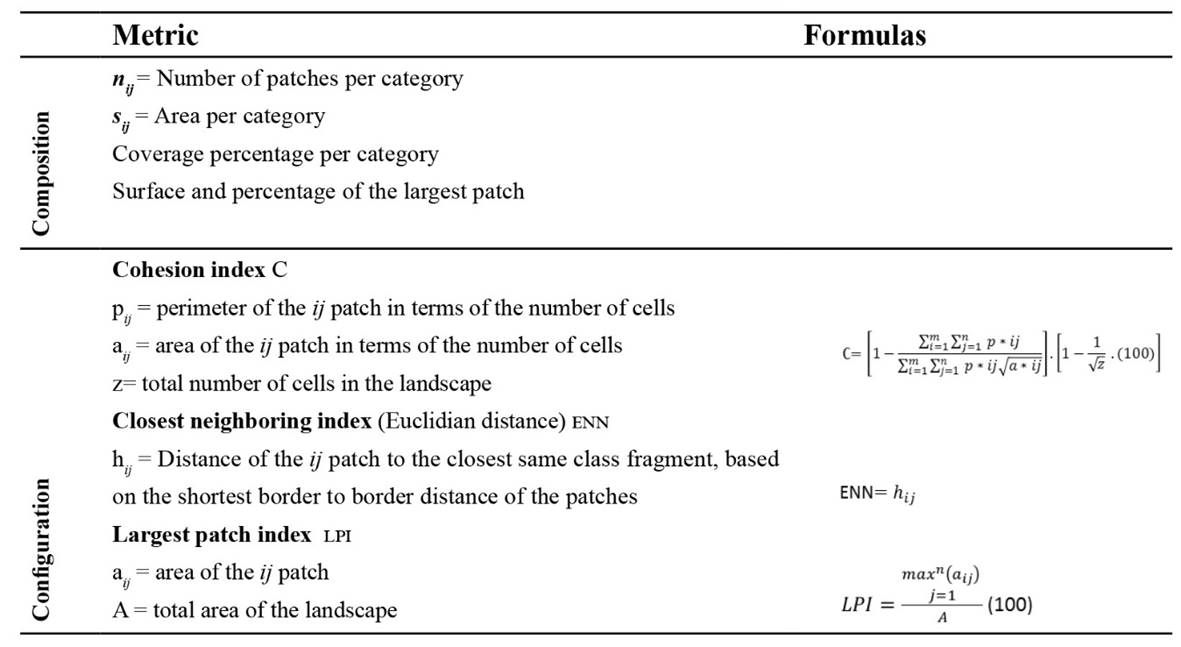
Source: McGarigal, Cushman & Ene (2012) and Pauchard, Aguayo & Alaback (2006).
We analyzed the degree of connectedness of the natural vegetation reclassified into a single category in its current state and in the built scenarios, using the indexes of the largest fragment, of cohesion and of the closest neighbor. The first is the percentage of the landscape comprised by the largest fragment at the class level; the other two analyze the distribution of the patches in the landscape and the distance between them (McGarigal et al., 2012). The second measures the physical connectivity (connectedness), calculating how close the patches are. The greater the cohesion value reflects greater connectedness between patches. The higher the value, the greater the number of aggregated patches, which in turn allows for the flow of matter and information through the landscape and increases connectivity (Pauchard et al., 2006). The third measures the distance from the center of the polygon to the border of its closest neighbor of the same time. As the value reaches zero, the distance to the closest neighbor decreases, i.e., the patches are closer to one another (McGarigal et al., 2012), the average was taken from this index.
Finally, in order to be able to establish the feasibility of the GI proposals, an analysis of the legislative framework was carried out regarding risks, preservation of natural ecosystems and green urban space.
Results
The ZMTTR still maintains almost half of its area with natural vegetation at different degrees of preservation in spite of having a third part covered in urban areas. The most extensive ecosystems are the coastal scrub, followed by the chaparral and riparian vegetation and a small fragment of oak forest to the southwest. However, the natural ecosystems (mainly coastal scrub and chaparral) are fragmented by three cities and by the presence of many small patches of human induced grassland around the urban zones. The cities of Tijuana and Rosarito are integrated in a single patch, linked to Tecate and to the Valle de las Palmas by many small urban patches connected by roads (Table 2, Figure 2).
Table 2: Areas, percentages and number of patches of land use and vegetation covers of the metropolitan area of Tijuana-Tecate-Rosarito in 2012
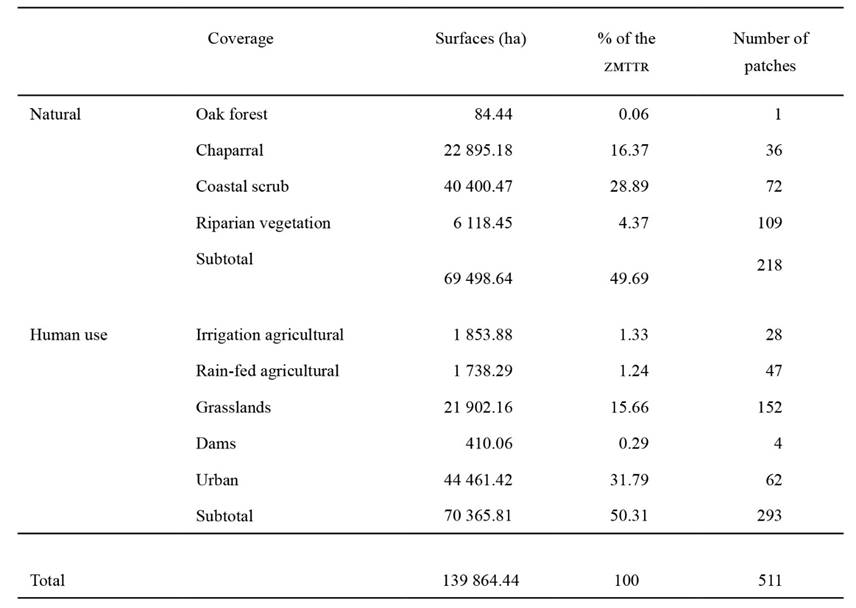
Source: Own elaboration.
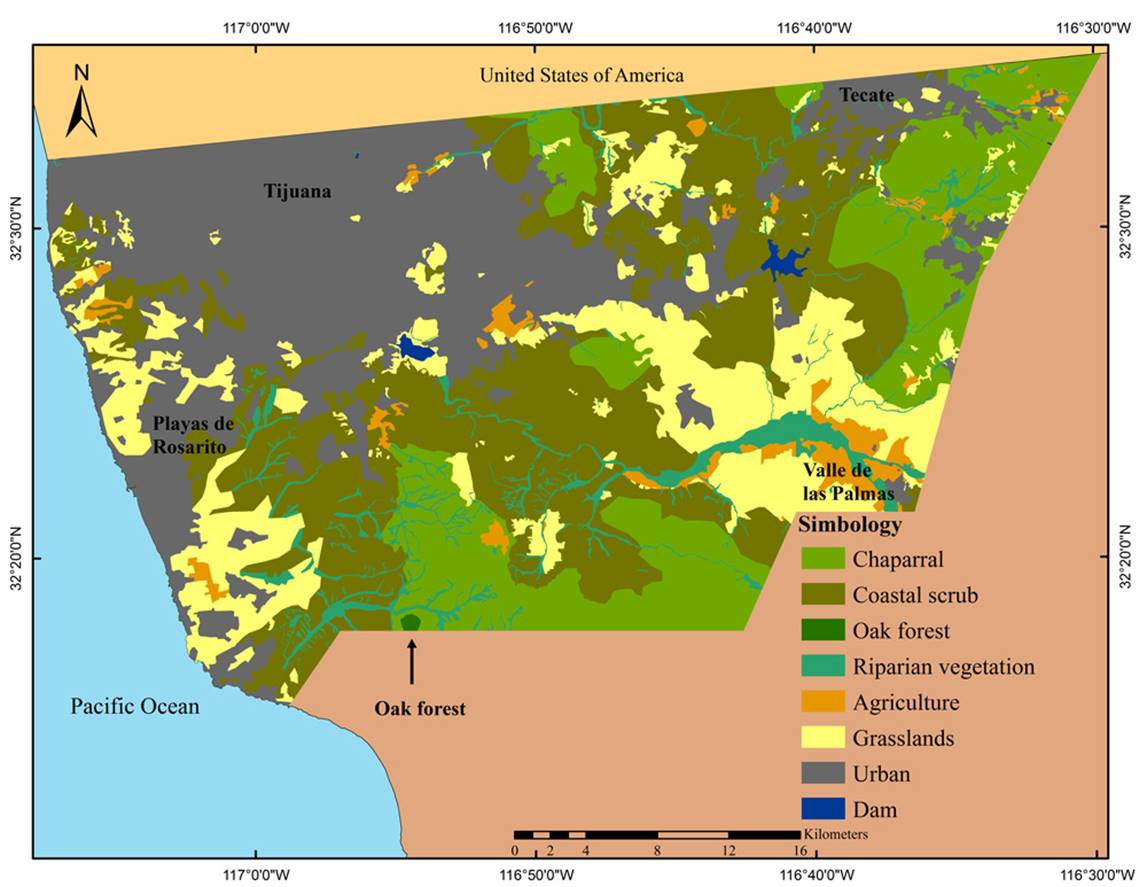
Source: Own elaboration based on the interpretation of SPOT images (Estación de Recepción México [ERMEX], 2012, 2013).
Figure 2: Land use and vegetation covers in the metropolitan area of Tijuana-Tecate-Rosarito (2012)
The natural vegetation is comprised of 73 patches, of which the largest concentrates 96% of its total area, connected by riparian ecosystems from the southeast of Rosarito towards the east of Tecate. Another relatively large patch is found isolated between Tijuana and Tecate (862 ha), the rest are smaller than 500 ha, and 63 are in fact smaller than 50 ha. The connectedness indexes (cohesion 99.6 and closest neighbor 361.9), reflect that a large part of the natural vegetation is aggregated, but there are many rather small isolated patches and at a considerable distance from one another (Table 3, see Figure 2).
Table 3: Preservation scenarios: area, percentage of the vegetation covers, measurements of composition and connectedness per scenario
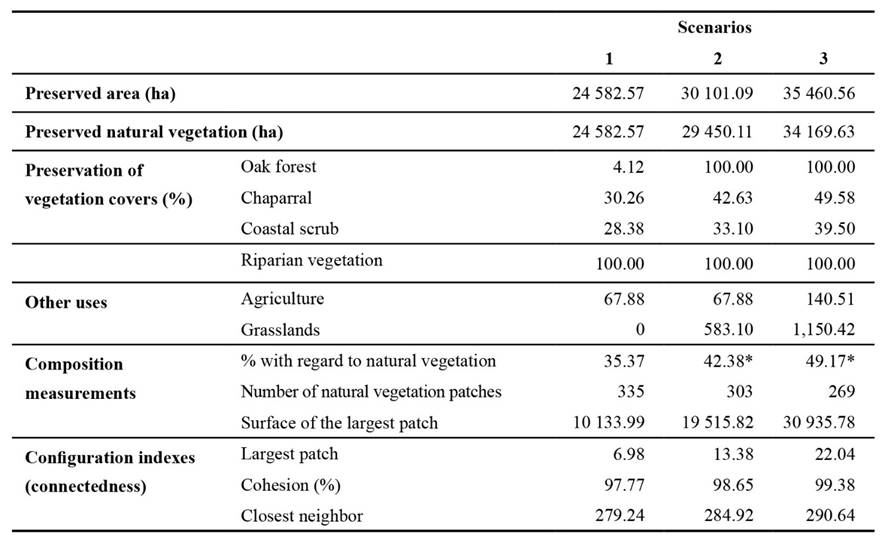
*These percentages do not include agriculture and induced grasslands.
Scenario 1. Risk areas (slows >35% and water flows with buffer zones and riparian vegetation).
Scenario 2. Risk areas and outstanding ecological places.
Scenario 3. Risk areas, outstanding ecological places and natural water drainage with riparian vegetation.
Source: Own elaboration.
Scenarios
In the first scenario the risk areas cover almost 17.6% of the total area, distributed in 335 patches mainly between Tijuana and Tecate and to the southeast. With them, 35.4% of the natural vegetation would be preserved (a third part of the coastal scrub and chaparral and all the riparian vegetation), within which we find the zones with special biodiversity described by Oberbauer (1999) (Figure 3a) and only a small fraction of the only patch of oak forest. The largest patch comprised by the main tributary of the Tijuana River and its surrounding vegetation including the Valle de las Palmas, exceeds 10 000 ha. Other large patches are between Tijuana and Tecate (approximately 4 000 ha) and to the south of Rosarito (exceeds 1 000 ha). The rest of the patches are smaller than 1 000 ha and 91% are even smaller than 50 ha (Table 3).
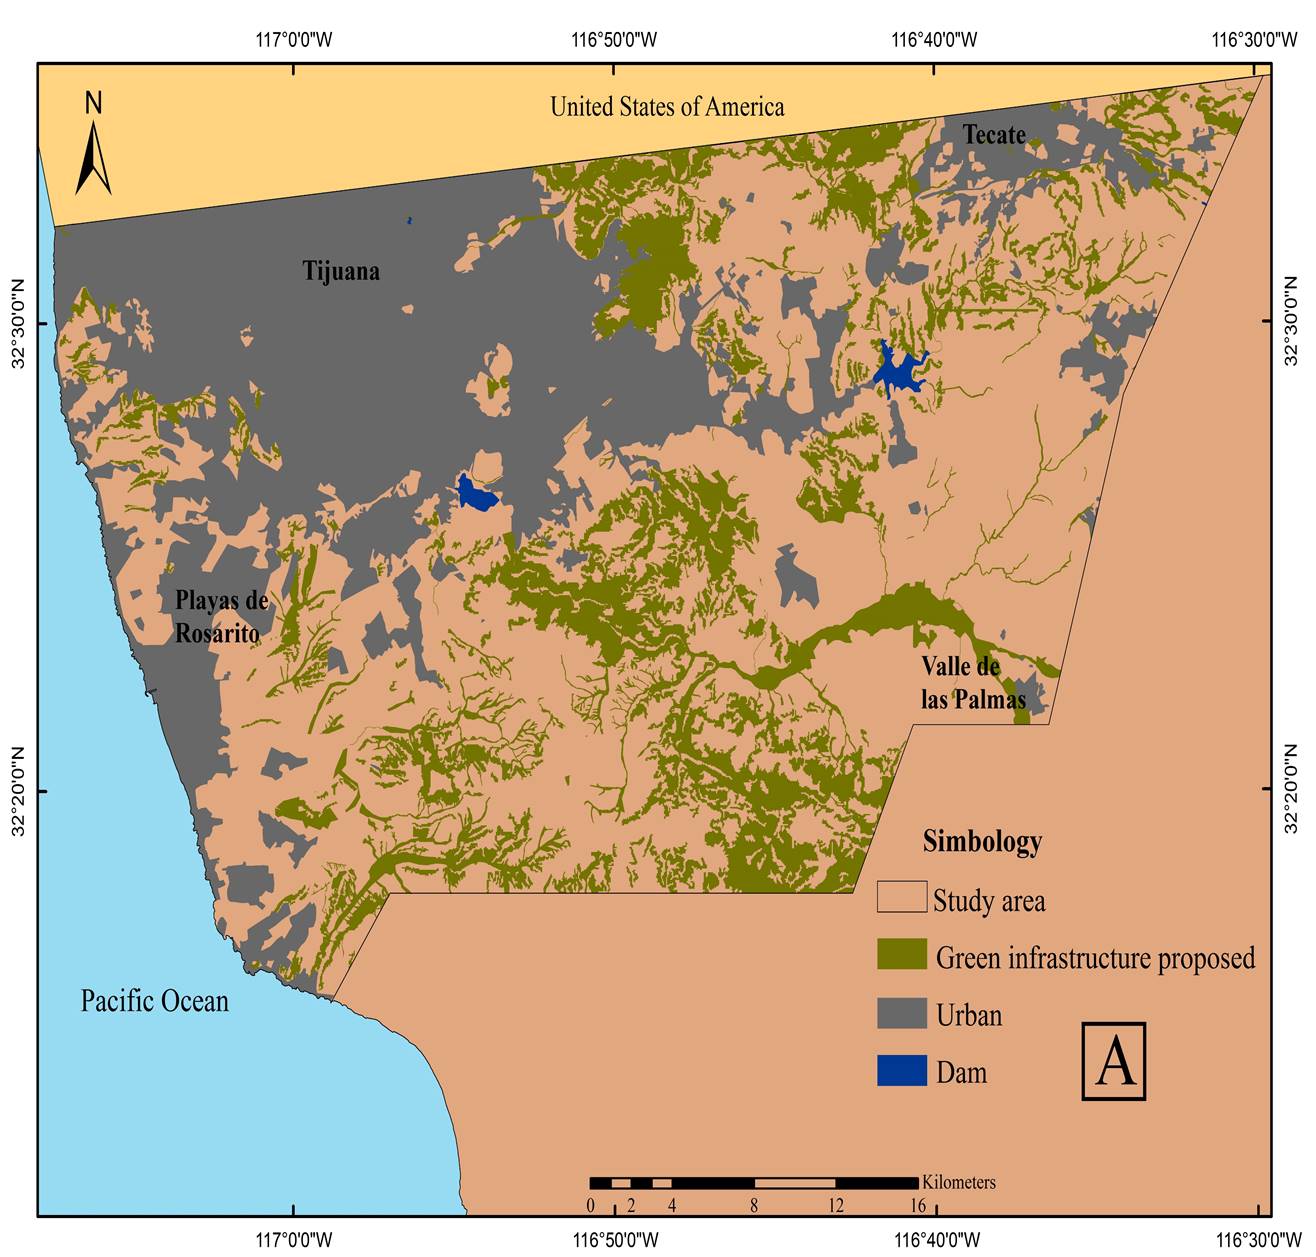
Source: Own elaboration.
Figure 3a: Preservation scenarios for the metropolitan area of Tijuana-Tecate-Rosarito. Scenario 1 risk areas (slopes >35% and natural water drainage)
By adding the outstanding ecological places (second scenario), the area to be preserved would increase to 21.5% of the ZMTTR and 42.4% of the natural vegetation (a little more than a third of the coastal scrub and chaparral and all of the oak forest and riparian vegetation) and the number of patches is reduced by almost 10%. The most connected area extends to the southern limit, with the largest patch of the Biodiversity Priority Region (Conabio, 2012) (Figure 3b), that by fusing with a patch of the Valle de las Palmas doubles its area. The rest of the patches are smaller than 1 000 ha, but close to 93% of these are smaller than 50 ha. It is worth mentioning that this scenario includes agriculture and human induced grasslands, which comprise 2.2% of the area to be preserved (considered in the connectedness analysis because they can be restored and 105.8 ha of an urban zone (not included in the connectedness analysis) originally contained in the biodiversity priority area (see Table 3).
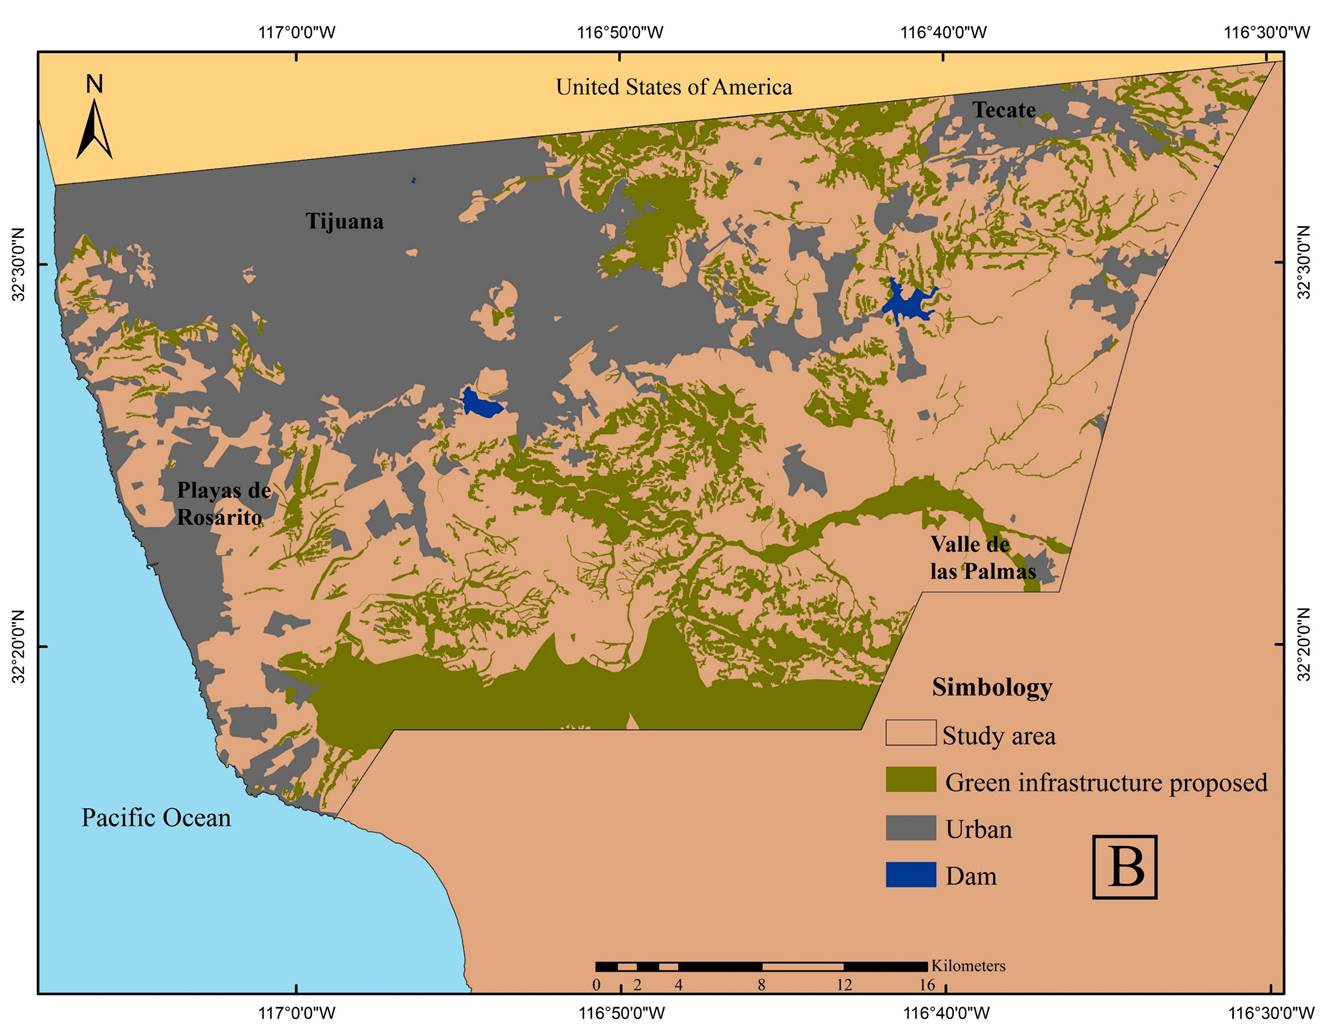
Source: Own elaboration.
Figure 3b: Scenario 2, risk areas (slopes >35% and natural water drainage) and outstanding ecological places
In the third scenario, by drawing a green belt around the urban areas, the area to be preserved would reach a fourth of the study area, which would represent 49.2% of the original vegetation (almost half of the chaparral, 40% of the coastal scrub and all of the oak forest and riparian vegetation), scattered in 255 patches. By broadening the connectedness, the largest patch increased a little over 10 000 ha. The rest of the patches are smaller than 500 ha and almost 95% of these are, in fact, smaller than 50 ha (Figure 3c). The agricultural and human induced grasslands area increases to 3.8% of the area to be preserved included in the connectedness analysis because they can be restored (Table 3).
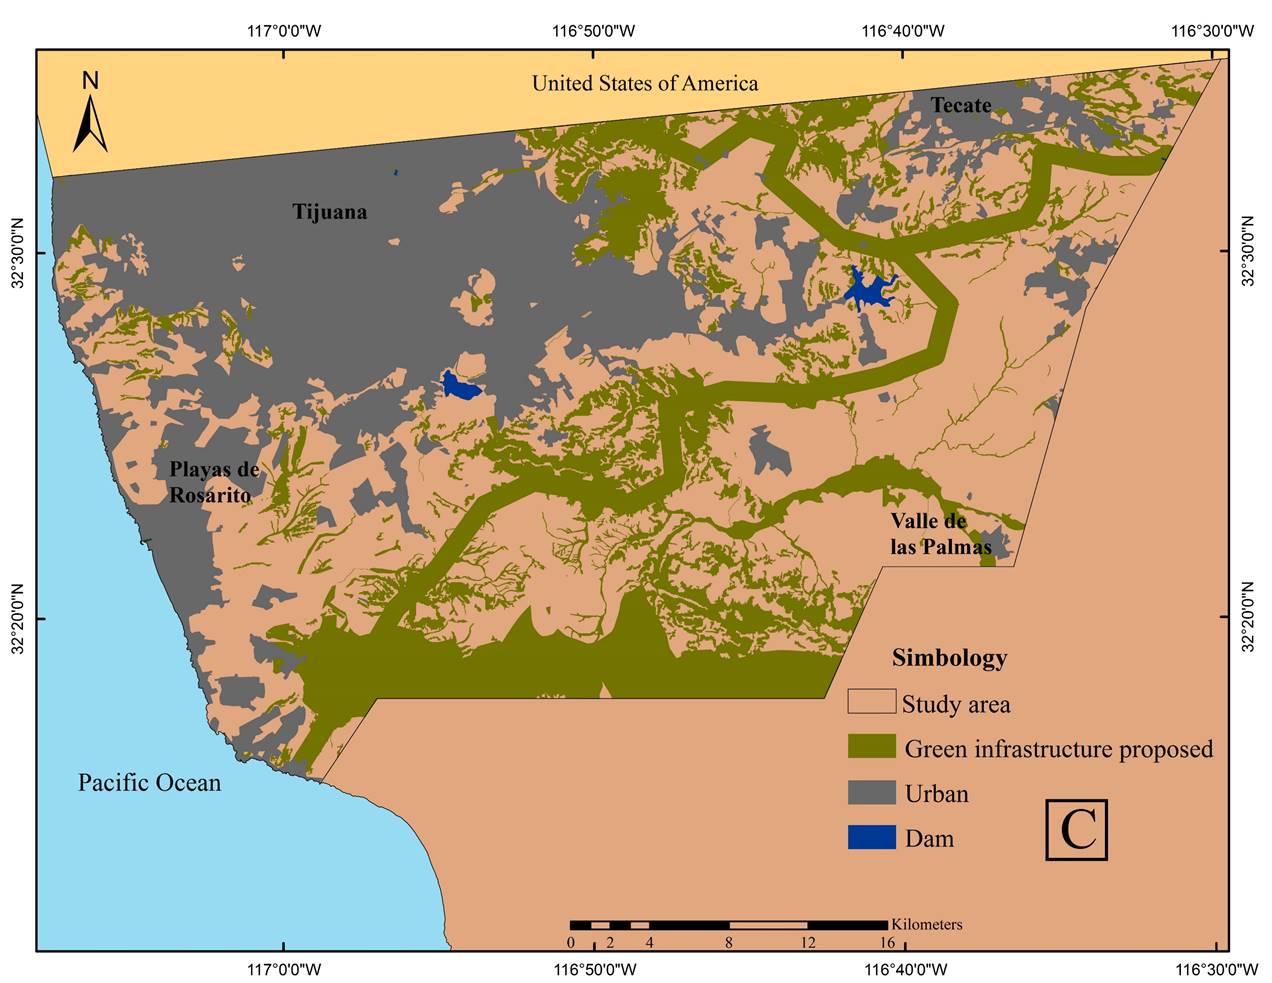
Source: Own elaboration.
Figure 3c: Scenario 3, risk areas (slopes >35% and natural water drainage), outstanding ecological places and natural vegetation corridors
Regarding the connectedness of the preservation scenarios proposed (see the definition of indexes in the Methods and Techniques section), the index of the largest patch that in its original state would have covered 96.4% of the natural vegetation, is reduced up to 7.5% in the first scenario, but almost doubles in the second and triples in the third scenario managing to preserve almost half of the existing natural vegetation. With this, the number of patches, though high from the first scenario, decreases gradually. Nevertheless, in all the scenarios there are many patches smaller than 50 ha. The closest neighbor index increases gradually, showing a decrease in the dispersal, whereas the cohesion increases as the patches unite, increasing connectivity (Table 3).
Legislation
The result of the analysis of the legislative framework in which this proposal is inserted is summarized in Table 4. Regarding the risks, the Law of National Waters (SARH, 1992/2014) prohibits construction on natural water courses and it specifies buffer areas. Likewise, though the federal laws and those of the state of Baja California regarding human settlements (Gobierno del Estado de Baja California, 1994/2013; Sedesol, 1993) mention that there ought to be no construction on risk areas with pronounced slopes, these are not specified. At the regional and municipal level, almost all urban development regulations, plans and programs prohibit construction in places with risks, in areas with pronounced slopes (>35%, or >30% in Rosarito) and in natural streams, but the measurements are not detailed. Regarding the creation of protected natural areas (PNA), the state and the municipalities have the power to create them (Secretaría de Medio Ambiente y Recursos Naturales y Pesca [Semarnap], 1998). Nevertheless, none have been created in the study area to this date.
Table 4: Legal framework of the metropolitan area of Tijuana-Tecate-Rosarito regarding risks (slopes and natural water drainage), protected natural areas, and urban parks
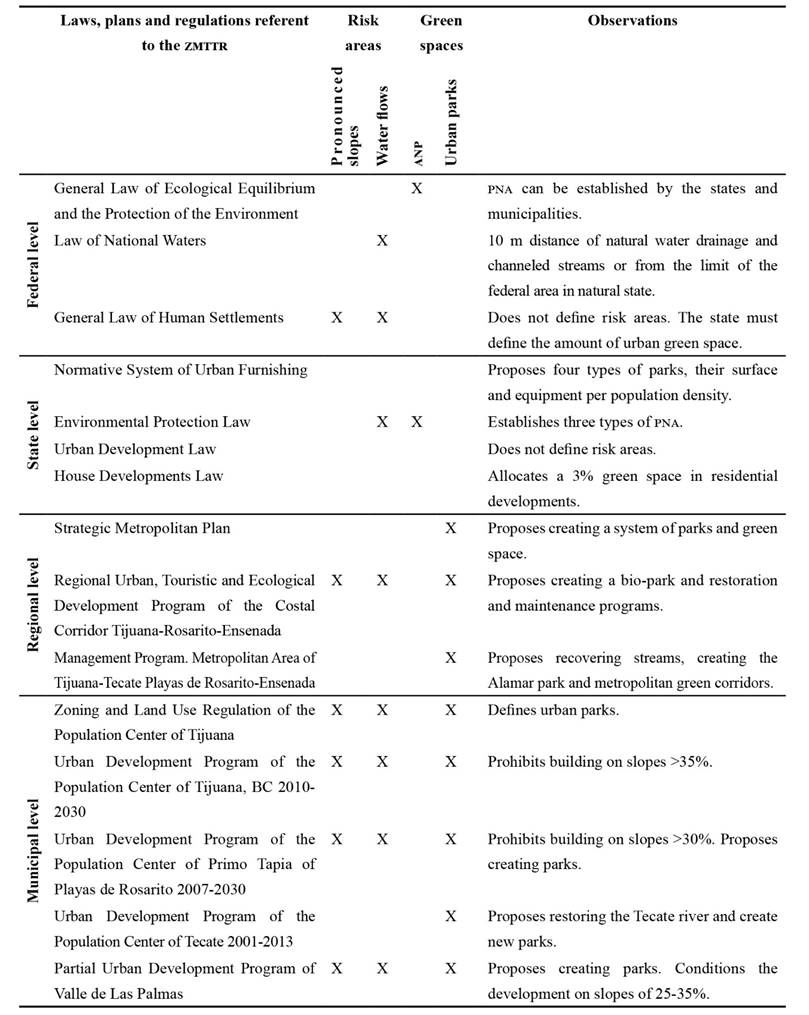
Source: Own elaboration based on Ayuntamiento de Playas de Rosarito (2010); Ayuntamiento de Tecate (2003); Ayuntamiento de Tijuana (2008, 2010a, 2010b); Gobierno del Estado de Baja California (1971, 1994/2013, 2001a, 2001b, 2012); Implan (2012); Sedesol (1993/2014, 1999); Semarnap (1988).
The subject of urban green space presents a great obstacle in legal matters. At the federal level, Sedesol (1999) 2 only makes area recommendations depending on the number of inhabitants; at the state level, the Residential Developments Law (Gobierno del Estado de Baja California, 1971) obliges creating a percentage of green space, but does not consider the population density; and at the municipal level, there is nothing that obliges green space creation. There are even some areas intended for parks, which have been used by the municipality for some other purpose (home construction, urban furnishing), under the protection of the Regulation of Goods and Services of the Municipality of Tijuana (Ayuntamiento de Tijuana, 2002).
Nevertheless, almost all the plans and programs at the regional and municipal level recognize the number and area, and some even associate their location with the risk areas of pronounced slopes and on natural water drainage, and propose preservation areas with special ecological characteristics.
Discussion
According to the patch-corridor-matrix model of Forman and Gordon (1986) and the percolation theory, the landscapes that have lost 60% of their natural vegetation have serious problems regarding fragmentation and a decrease in connectivity (O’Neill, Gardner & Turner, 1992). In the ZMTTR, the natural coverage extends over 51% of the area; therefore the planning of green space is essential before they are lost due to urbanization.
The areas considered in the scenarios are spaces of opportunity that could be taken advantage of in order to plan green space physically connected, that allow the landscape to maintain a degree of connectedness and increase its resilience capability and provide multiple functions in the face of natural and human disturbances (Ahern, 2007).
In the first scenario, by preserving the natural vegetation in risk areas, we would achieve maintaining more than a third of the actual vegetation and all of the natural corridors of the natural water course with riparian vegetation, which are essential for the hydrological aspects, especially due to the scarcity of water in the area. With this the functioning of the landscape would improve given that the vegetation functions as a buffer to regulate the natural flows, which could decrease the risks by stabilizing the soils, reducing the quantity and velocity of pluvial runoff, avoid floods and landslides and increase the seeping of water (Ahern, 2002; APA, 2013). This is particularly important for the ZMTTR, which has suffered this type of problems (Bocco et al., 1993). It also regulates the excess of nutrients or contaminants in the water, which avoids damage to other components of the landscape (Ahern, 2002), which could cause a decline in the oxygen levels of the water and cause the death of river and wetland organisms and the proliferation of anaerobic bacteria or of harmful algae (Chislock, 2013). For example, the natural drainage and diversions of Tijuana disgorge in a USA reserve, the Tijuana River National Estuary (Pezzoli et al., 2014), so its preservation could avoid possible conflicts with the neighboring country.
By including the special biodiversity areas in the second scenario, the biodiversity is better preserved, due to the increase in the surface of the largest patch and of the connectedness. These features increase in the third scenario with the addition of the green belt which, although given its design limitations, could represent a planning guide. Regarding patch sizes, it is recognized that the more extensive they are, greater is their capability to sustain larger and more diverse animal and plant populations (Bennett & Saunders, 2010; Forma, 1995; Vila, Varga, Llausàs & Ribas, 2006). Starting with the first scenario, there is a natural vegetation patch larger than 10 000 ha. Areas with similar dimensions and vegetation similar to the study area, to the south of California, USA, were identified by Crooks (2002) as having a high probability of accommodating lynx or puma, respectively. The presence of large predators in an area is an indicator of the quality of the place (Escolástico, Abildo, R. Laramunt & T. Laramunt, 2013). One of these areas is the part of the Biodiversity Priority Region (Conabio, 2012), and the large patch between Tijuana and Tecate, that due to its extensiveness and biodiversity could be a PNA at a state level.
In all the scenarios there are many small patches of natural vegetation that could be used by species that need resources from different types of ecosystems (Bennett and Saunders, 2010) and to travel through the landscape. These areas could be used as stepping stones (Forma, 2008) or small neighborhood parks (Sedesol, 1999), that help connect larger areas functionally (connectivity), for example, the small areas located to the west between Tijuana and Rosarito, to the south of this latter or to the east of Tecate.
Particularly, it would be advantageous to protect and restore the areas with natural vegetation that surround dams, as they are directly related to the quality and quantity of the water in the dams, a relevant aspect due to the scarcity of this resource in the region (Gobierno del Estado de Baja California, 2013).
In terms of management, due to the fact that the vegetation of the study area is adapted to a natural fire regime (Lippitt et al., 2013), it would be beneficial to apply techniques such as controlled burnings and the clearing of flammable vegetation, which combined with information to the inhabitants could help reduce this type of risk (Hurteau, Brayford, Fulé, Taylor & Martin, 2014). The San Diego County (San Diego County, n.d.), in addition to offering indications regarding these techniques, recommends the types of native species that must be promoted and those that must be further away from constructions.
It is worth noting that no recommendations are made in the management of grasslands, as in the study area this type of soil use has been identified as a precursor of urbanization (Farley et al., 2012), and not of the development of agricultural activities.
From a legal point of view, part of the problem in implementing GI lies in that the urban and environmental policies in Mexico are not linked. In the land planning there is a disassociating between the urban and the rural. The Ordenamientos Ecológico Territoriales (OET) (Ecological Land Management) are only implemented outside the population centers, whereas these latter are regulated through the urban development plans (UDP), but extended to the rural area. In this manner, the urban-environmental dichotomy creates distortions in the land management (Díaz & Ojeda-Revah, 2013). In the study area, in spite of having the power, none of the municipalities have developed an OET, leaving the UDPs to delimit the preservation areas. Likewise, there are no obligatory mechanisms of coordination between plans, because in practice the plans are not implemented, due to a lack of ability, or the absence of institutional mechanisms or to interests created by the real property markets (Momm-Schult et al., 2013).
The risk areas in spite of being mentioned by laws, plans and programs, are for the most part not specified or respected, in part because in the case of Tijuana, more than half of the urban area has an irregular origin (Alegría & Ordoñez, 2005), but also because the municipalities, in search of quick solutions, build close to flood zones, change the topography, canalize streams and destroy natural patches, which has consequences in the natural drainage, obstruction rivers and streams and causing floods (Momm-Schult et al., 2013).
Despite the fact that the state and the municipalities can create PNA, in the study area there are none. It would be beneficial to declare the priority zone a PNA and the areas with special biodiversity and the oak forest as biodiversity protected areas (Oberbauer, 1999), integrated as part of the GI.
With regard to the urban green space, the federal level only makes area recommendations per population size and they are only visualized as recreation and sporting areas (Sedesol, 1999). At a state level, it is determined that 3% of the area saleable is for the creation of green space only for residential developments and without considering the population density (Gobierno del Estado de Baja California, 1971). At a municipal level, despite being mentioned by almost all the programs as a mechanism to reduce risks and preserve biodiversity, to date there have been none created with these purposes. Moreover, there is no regulation that obligates the municipalities to establish a green area minimum per capita or urban percentage, that consider its equitable accessibility or that establishes guidelines for its development and improvement, and their change to other uses is allowed. The ZMTTR has access to the Metropolitan Fund, a resource which derives from the federation and that is assigned to programs, projects, infrastructure works or actions in economic and social benefit to the metropolitan areas (Secretaría de Hacienda y Crédito Público [SHCP], 2011). With this apparent fund since 2011, the government of the State pushes three metropolitan projects: The Metropolitan Ecological Reserve of Tijuana (20 ha), the Great Metropolitan Park of Playas de Rosarito, and the River Park of Tecate (Ayuntamiento de Playas de Rosarito, 2014, p. 142). However, to date no official advancements have been reported regarding this subject.
Conclusions
The natural vegetation landscape components of the ZMTTR are being fragmented and isolated, which reduces their connectivity and therefore their resilience capacity against disturbances. Nevertheless, there are spaces of opportunity in the ZMTTR that could help preserve the natural vegetation and maintain its physical connectivity. By just maintaining the broadened risk areas to the distribution of riparian vegetation, a good part of the natural vegetation with great biodiversity and endemism could be preserved in an interconnected network, simultaneously providing multiple functions and ecosystem services, such as increasing its resilience threshold, reducing risks, increasing the green space per inhabitant and including the preservation of biodiversity.
All the GI scenarios proposed for the ZMTTR are within the existing legislation, however, the degree of feasibility that each one has is different. The first scenario would be possible by just reinforcing the compliance with the already existing law; whereas in order to fulfill the second scenario, political willingness is also required, since the declaration of a PNA is not obligatory for any level of government. Lastly, the third scenario is much less feasible; if we consider that there is a lot of competition for developable land.
In the limited existing legal framework regarding urban green space, there are problems of green space design and spatial distribution and government sectors fragmentation. Spatially, though contemplated by the legislative framework, there is no effective coordination between municipalities that allows the spatial continuity of its design, aggravated by the legal separation of urban and rural planning within each municipality. Therefore, despite the fact that the majority of the local and regional UDP and OET consider them important and mention the exiting obstacles in their creation, few relate them with problems of risk; and none visualize them as a connected system that takes the maximum advantage of the ecosystem services at the landscape scale. In government and planning sectors terms, their design does not integrate with social, health, culture, sport, or urban image programs, etc., in order to take advantage of their multifunctional capability and reduce the maintenance costs. The law even safeguards green space land use change for other purposes that together with the lack of law enforcement; and of specialist capabilities, lead to an outcome of poor green space maintenance and rather poor conditions.
Thus, to create an integrated legal framework becomes of central importance; one that broadens the scope of the urban green space and transforms it into one that includes natural vegetation, and other urban green spaces integrated in an interconnected system of GI that increases the resilience capability of the landscape in which the cities are inserted. Socially, this new vision comprises the explicit establishment of a minimum of green space per inhabitant, with an equitable distribution for the entire population.
Future investigations on GI in the ZMTTR could look further into the distribution of the endemic or threatened biodiversity, and in the functional connectivity of some key species in order to determine biological corridors more adequately. Socially, the inclusion of the population participation in the design and maintenance of green space is a fundamental subject that must be explored.
REFERENCES
Ahern, J. (2002). Greenways as strategic landscape planning: Theory and application. Estados Unidos: Wageningen Universiteit. [ Links ]
______(2007). Green infrastructure for cities : The spatial dimension. En V. Novotny y P. Brown (Eds.), Cities of the future: towards integrated sustainable water and landscape management (pp. 267-283). Londres, Inglaterra: IWA Publishing. [ Links ]
______(2013). Urban landscape sustainability and resilience: the promise and challenges of integrating ecology with urban planning and design. Landscape Ecology, 28(6), 1203-1212. [ Links ]
Alberti, M. y Marzluff, J. (2004). Ecological resilience in urban ecosystems: Linking urban patterns to human and ecological functions. Urban Ecosystems, 7(3), 241-265. [ Links ]
Alegría O. y Ordoñez, G. (2005). Legalizando la ciudad: asentamientos informales y procesos de regularización Tijuana. México: El Colegio de la Frontera Norte. [ Links ]
American Planning Association (APA). (2013). Análisis de características naturales. En Fundamentos de planificación de sitios (pp. 9-36). Estados Unidos: Autor. [ Links ]
Ayuntamiento de Playas de Rosarito. (26 de noviembre de 2010). Programa de desarrollo urbano del centro de población de Primo Tapia, Playas de Rosarito, Baja California. Periódico Oficial del Estado de Baja California, (tomo CXVIII, núm. 51). Recuperado de http://www.rosarito.gob.mx/rosaritov/transparencia/pdf/ProgramaDesarrolloUrbanoPrimoTapia.pdf [ Links ]
______(9 de mayo de 2014). Plan Municipal de Desarrollo de Playas de Rosarito, Baja California 2014-2016. Periódico Oficial del Estado de Baja California (tomo CXXI, núm. 25). Recuperado de http://www.rosarito.gob.mx/VI/WP-CONTENT/UPLOADS/2014/04/PLAN-MUNICIPAL-DE-DESARROLLO-DE-PLAYAS-DE-ROSARITO-BC-2014-2016.PDF [ Links ]
Ayuntamiento de Tecate. (24 de octubre de 2003). Programa de desarrollo urbano del centro de población de Tecate, Baja California. Periódico Oficial del Estado de Baja California, (tomo CX, núm. 48), pp. 2-122. [ Links ]
______(2011). Plan Municipal de Desarrollo de Tecate 2011-2013. México: Autor. [ Links ]
Ayuntamiento de Tijuana. (8 de marzo de 2002). Reglamento de Bienes y Servicios del Municipio de Tijuana. Periódico Oficial del Estado de Baja California, (tomo CIX, núm. 10). Recuperado de http://www.tijuana.gob.mx/Reglamentos/pdf/REGLAMENTO%20DE%20BIENES%20Y%20SERVICIOS%20DEL%20MUNICIPIO%20DE%20TIJUANA%20B.pdf [ Links ]
______(28 de noviembre de 2008). Programa parcial de desarrollo urbano del Valle de las Palmas. Periódico Oficial del Estado de Baja California, (tomo CXV, núm. 59, sección I), pp. 2-16. [ Links ]
______(3 de septiembre de 2010a). Programa de desarrollo urbano del centro de población de Tijuana, Baja California 2008-2030. Periódico Oficial del Estado de Baja California, (tomo CXVII, núm. 38, sección II), pp. 2-416. [ Links ]
______(3 de septiembre de 2010b). Reglamento de zonificación y usos del suelo del centro de población de Tijuana, Baja California. Periódico Oficial del Estado de Baja California, (tomo CXVII, núm. 38). Recuperado de http://www.bajacalifornia.gob.mx/portal/gobierno/legislacion/periodico/2010/SECC-I-03-09-2010.pdf [ Links ]
Balvanera, P. y Cotler, H. (2011). Los servicios ecosistémicos. Biodiversitas, (94), 7-11. [ Links ]
Beier, P., Penrod, K., Luke, C., Spencer, W. y Cabañero, C. (2006). South coast missing linkages: Restoring connectivity to wildlands in the largest metropolitan area in the United States. En K. Crooksy y M. Sanjayan (Eds.), Connectivity conservation (pp. 555-586). Reino Unido: Cambridge University Press. [ Links ]
Benedict, M. y McMahon, T. (2006). Green infraestructure. Linking landscape and communities. Estados Unidos: Island press. [ Links ]
Bennett, A. y Saunders, D. (2010). Habitat fragmentation and landscape change. En N. S. Sodhi y P. R. Ehrlich (Eds.), Conservation biology for all (pp. 88-106). Estados Unidos: Oxford University. [ Links ]
Bocco, G., Sánchez, R. y Riemann, H. (1993). Evaluación del impacto de las inundaciones en Tijuana (enero de 1993). Uso integrado de percepción remota y sistemas de información geografíca. Frontera Norte, 5(10), 53-83. [ Links ]
Bringas, N. y Sánchez, R. (2006). Social vulnerability and disaster risk in Tijuana: preliminary findings. En J. Clough-Riquelme y N. Bringas (Eds.), Equidity and sustainable development. Reflexions from the U.S.-México border (pp. 149-173). Estados Unidos: University of California. [ Links ]
Chislock, M. (2013). Eutrophication: causes, consequences and controls in aquati ecosystems. Nature Education Knowledge, 4(4), 10. [ Links ]
Colding, J. (2007). Ecological land-use complementation’ for building resilience in urban ecosystems. Landscape and Urban Planning, 81(1-2), 46-55. [ Links ]
Comisión Nacional para Conocimiento y Uso de la Biodiversidad (Conabio). (2012). Portal de Geo-información. Sistema Nacional de Información sobre Biodiversidad. Recuperado de http://www.conabio.gob.mx/informacion/gis/ [ Links ]
Crooks, K. (2002). Relative sensitivities of mammalian carnivores to habitat fragmentation. Conservation Biology, 16(2), 488-502. [ Links ]
Defries, R., Foley, J. y Asner, G. (2004). Land-use choices: balancing human needs and ecosystem function. The Ecological Society of America, 2(5), 249-257. [ Links ]
Díaz, D. y Ojeda-Revah, L. (2013). La reserva de la Biosfera Alto Golfo de California y Delta del Río Colorado: planeación territorial. Región y Sociedad, 25(58), 57-85. [ Links ]
Escolástico, C., Abildo, M., Laramunt, R. y Laramunt, T. (2013). Ecología I. Introducción. Organismos y poblaciones. Madrid, España: Universidad Nacional de Educación a Distancia. [ Links ]
Estación de Recepción México (ERMEX). (31 de diciembre de 2012). México: Secretaría de Agricultura, Ganadería, Desarrollo Rural, Pesca y Alimentación, Servicio de Información Agroalimentaria y Pesquera. [ Links ]
______(31 de enero de 2013). México: Secretaría de Agricultura, Ganadería, Desarrollo Rural, Pesca y Alimentación, Servicio de Información Agroalimentaria y Pesquera. [ Links ]
Farley, K., Ojeda-Revah, L., Atkinson, E. y Eaton-González, B. (2012). Changes in land use, land tenure and landscape fragmentation in the Tijuana River watershed following reform of the ejido sector. Land Use Policy, 29(1), 187-197. [ Links ]
Flores, A., Pickett, T., Wayne, Z., Pouyat, R. y Pirani, R. (1998). Adopting a modern ecological view of the metropolitan landscape: the case of a greenspace system for the New York City region. Landscape and Urban Planning, 39(4), 295-308. [ Links ]
Food and Agriculture Organization of the United Nations (FAO). (2001). Lecture notes on the major soils of the world. Roma, Italia: Autor. [ Links ]
Forman, R. (1995). Land mosaics: The ecology of landscapes and regions. Reino Unido: Cambridge. [ Links ]
______(2008). Urban regions: Ecology and planning beyond the city. Reino Unido: Cambridge University Press . [ Links ]
Forman, R. y Godron, M. (1986). Landscape ecology. Nueva York: John Wiley & Sons. [ Links ]
Ganster, P. (2002). Tecate sus desafíos en el siglo XXI. En P. Ganster, F. Cuamea, J. Castro y A. Villegas (Comps.), Tecate, Baja California: Realidades y desafíos de una comunidad mexicana fronteriza (pp. 251-267). México: San Diego State University Press. [ Links ]
García, E. (2004). Modificaciones al sistema de clasificación climática de Köppen. México: Offset Larios. [ Links ]
Gobierno del Estado de Baja California. (10 de abril de 1971). Reglamento de fraccionamientos del Estado de Baja California. Periódico Oficial del Estado de Baja California, (tomo LXXVIII, núm. 1, sección I), pp. 1-34. [ Links ]
______(24 de junio de 1994). Ley de desarrollo urbano del Estado de Baja California. Periódico Oficial del Estado de Baja California, (tomo CI, núm. 26, sección I). (Última reforma 2 de agosto de 2013). Recuperado de http://www.congresobc.gob.mx/legislacion/Parlamentarias/TomosPDF/Leyes/TOMO_VII/LEYDESUR_02AGO2013.pdf. [ Links ]
______(30 de noviembre de 2001a). Ley de protección al ambiente para el Estado de Baja California, México. Periódico Oficial del Estado de Baja California , (tomo CVIII, núm. 53, sección I), pp. 1-76. [ Links ]
______(16 de noviembre de 2001b). Programa regional de desarrollo turístico y ecológico del Corredor Costero Tijuana-Rosarito Ensenada Cocotren. Periódico Oficial del Estado de Baja California , (tomo CVIII, núm. 50, sección I), pp. 2-160. [ Links ]
______(12 de marzo de 2004). Declaratoria de zona conurbada Tijuana-Tecate-Rosarito. Periódico Oficial del Estado de Baja California , (tomo CXI, núm. 12), pp. 2-4. [ Links ]
______(2012). Programa de ordenamiento Zona Metropolitana Tijuana-Tecate-Playas de Rosarito-Ensenada. Recuperado de http://www.sidue.gob.mx/doctos/2014/ot/ZM_TTPRE.pdf [ Links ]
______(2013). Hidrología: Regiones hidrológicas. Recuperado de http://www.bajacalifornia.gob.mx/portal/nuestro_estado/recursos/hidrologia.jsp [ Links ]
Holling, C. y Gunderson, L. (2002). Resilience and adaptive cycles. En L. Gunderson y C. Holling (Eds.), Panarchy: understanding transformations in human and natural systems (pp. 25 -62). Estados Unidos: Island press . [ Links ]
Huizar, H. y Ojeda-Revah, L. (2014). Los parques de Tijuana: una perspectiva de justicia ambiental. En L. Ojeda-Revah y I. Espejel (Coords.), Cuando las áreas verdes se transforman en paisaje. La visión de Baja California (pp. 87-120). México: Colegio de la Frontera Norte. [ Links ]
Hurteau, M., Bradford, J., Fulé, P., Taylor, A. y Martin, K. (2014). Climate change, fire management, and ecological services in the southwestern US. Forest Ecology and Management, 327, 280-289. [ Links ]
Instituto Municipal de Planeación (Implan). (2012). Plan Estratégico Metropolitano 2012-2034. Recuperado de http://www.cdt.org.mx/portals/2/documentos/pem2034/Revista_PEM.pdf [ Links ]
Instituto Nacional de Estadística Geografía e Informática (Inegi) (1995). Anuario Estadístico. Baja California. México: Autor. [ Links ]
______(2004). Guía para la interpretación de cartografía: Edafología. México: Autor . [ Links ]
______(2010). Cuaderno estadístico del estado de Baja California. México: Autor . [ Links ]
______(2013). Mujeres y hombres en México 2012. México: Autor . [ Links ]
______(2014). Modelos digitales de elevación. Recuperado de http://www3.inegi.org.mx/sistemas/productos/default.aspx?c=265&upc=0&s=est&tg=1007&f=2&cl=0&pf=prod&ef=0&ct=209000000&pg=2 [ Links ]
Lippitt, C., Stow, D., O´Leary, J. y Franklin, J. (2013). Influence of short-interval fire occurrence on post-fire recovery of fire-prone shrublands in California, USA. International Journal of Wildland Fire, 22(2), 184-193. [ Links ]
McGarigal, K. (2006). Landscape pattern. En A. El-Shaarawi y W. Piegorsch (Eds.), Encyclopedia of Envirometrics (pp. 1441-1451). Nueva York: John Wiley & Sons . [ Links ]
McGarigal, K., Cushman, S. y Ene, E. (2012). FRAGSTATS v4: Spatial Pattern Analysis Program for Categorical and Continuous Maps. Recuperado de http://www.umass.edu/landeco/research/fragstats/fragstats.html [ Links ]
McKinney, M. (2002). Urbanization, biodiversity and conservation. Bioscience, 52(10), 883-890. [ Links ]
Mendoza, G., Acosta, G. y Vázquez, S. (2009). Estudio para la identificación de la microzonación sísmica en la colonia “Ampliación ejido plan libertador”. México: Gobierno del Estado de Baja California. [ Links ]
Momm-Schult, S., Piper, J., Denaldi, R., Freitas, S., Fonseca, M. y Oliveira, V. (2013). Integration of urban and environmental policies in the metropolitan area of São Paulo and in Greater London: the value of establishing and protecting green open spaces. International Journal of Urban Sustainable Development, 5(1), 89-104. [ Links ]
Moreno, O. (2013). Paisajes resilientes. Reflexiones en torno a la reconstrucción de territorios desde el manejo y diseño de infraestructuras verdes, en el marco de las estrategias de gestión de riesgo ante desastres. Nadir: Revista Electrónica de Geografía Austral, (1), 1-19. [ Links ]
Myers, N., Mittermeier, R., Mittermeier, C., Fonseca, G. da y Kent, J. (2000). Biodiversity hotspots for conservation priorities. Nature, 403(6772), 853-858. [ Links ]
Ndubisi, F. (2002). Managing change in the landscape: a synthesis of approaches for ecological planning. Landscape Journal, 21(1), 138-155. [ Links ]
Nyström, M. y Folke, C. (2001). Spatial resilience of coral reefs. Ecosystems, 4(5), 406-417. [ Links ]
O’Neill, R., Gardner, R. y Turner, M. (1992). A hierarchical neutral model for landscape analysis. Landscape Ecology, 7(1), 55-61. [ Links ]
Oberbauer, T. (1999). La vegetación del noroeste de Baja California. Fremontia, (edición especial), 16-22. [ Links ]
Ojeda-Revah, L. (1999). Land use and the conservation of natural resources in the Tijuana River basin. En H. Laurence (Ed.), Shared space: rethinking the U.S.-Mexico border environment (pp. 211-232). San Diego, Estados Unidos: University of California . [ Links ]
Pauchard, A., Aguayo, M. y Alaback, P. (2006). Cuantificando la fragmentación del paisaje: las métricas y sus significados ecológicos. En A. Grez, J. Simonetti y R. Bustamante (Eds.), Biodiversidad en ambientes fragmentados de Chile: patrones y procesos a diferentes escalas, Santiago (pp. 41‐66). Chile: Universitaria. [ Links ]
Pezzoli, K., Kozo, J., Ferran, K., Wooten, W., Rangel, G. y Al-Delaimy, W. K. (2014). One bioregion/one health: An integrative narrative for transboundary planning along the US-Mexico border. Global Society, 28(4), 419-440. [ Links ]
Pickett, S., Cadenasso, M. y Grove, J. (2004). Resilient cities: meaning, models and metaphor for integrating the ecological, socio-economic and planning realms. Landscape and Urban Planning, (69), 369-384. [ Links ]
Puente, S. (1996). Vulnerabilidad urbana y desarrollo sustentable. En J. Calva, B. Palomino y J. Navarro (Coords.), Sustentabilidad y desarrollo ambiental (tomo II, pp. 61-70). México: Juan Pablos Editor. [ Links ]
Riemann, H. y Ezcurra, E. (2007). Endemic regions of the vascular flora of the peninsula of Baja California, Mexico. Journal of Vegetation Science, 18(3), 327-336. [ Links ]
San Diego County. (s. f). Fire, defensible space, and you. Recuperado de http://www.sandiegocounty.gov/pds/fire_resistant.html [ Links ]
San Diego Environmental Migration Program Working Group (SANDAG). (2011). APPENDIX 2 Selected corridor, connectivity and linkage references from the MSCP, MHCP and associated documents relevant to the Connectivity Monitoring Strategic Plan. En Connectivity Monitoring Strategic Plan for the San Diego Preserve System. San Diego Management Monitoring Program. Recuperado de http://www.sdmmp.com/Libraries/Strategic_Plans/CMSP_Appendix2_01112011.sflb.ashx [ Links ]
Sánchez-Rodríguez, R. (2011). Urban and social vulnerability to climate variability in Tijuana, Mexico. En R. Kasperson y M. Berberian (Eds.), Integrating science and policy. Vulnerability and resilience in Global Environmental Change (pp. 187-214.). Nueva York: Earthscan. [ Links ]
Schneider, A., Friedl, M. y Potere, D. (2009). A new map of global urban extent from MODIS satellite data. Environmnetal Research Letters, 4(4), 1-11. [ Links ]
Secretaría de Agricultura y Recursos Hidráulicos (SARH). (1 de diciembre de 1992). Ley de Aguas Nacionales. Diario Oficial de la Federación, (tomo CQLXXI, núm. 1). (Última reforma 11 de agosto de 2014). Recuperado de http://www.diputados.gob.mx/LeyesBiblio/ref/lan/LAN_orig_01dic92_ima.pdf [ Links ]
Secretaría de Desarrollo Social (Sedesol) (21 de julio de 1993). Ley General de Asentamientos Humanos. Diario Oficial de la Federación (tomo CDLXXVIII, núm. 15). (Última reforma en 2014). Recuperado de http://www.diputados.gob.mx/LeyesBiblio/pdf/133.pdf [ Links ]
______(1999). Sistema normativo de equipamiento urbano. Tomo V. Recreación y Deporte. Recuperado de http://www.inapam.gob.mx/work/models/SEDESOL/Resource/1592/1/images/recreacion_y_deporte.pdf [ Links ]
Secretaría de Hacienda y Crédito Público (SHCP). (11 de abril de 2011). Acuerdo por el que se emiten las reglas de operación del fondo metropolitano. Diario Oficial de la Federación, (tomo DCXCI, núm. 7, Primera Sección). Recuperado de http://www.hacienda.gob.mx/EGRESOS/PEF/temas_gasto_federalizado/fondo_metropolitano/reglas_operacion_FM_2011.pdf [ Links ]
Secretaría de Medio Ambiente y Recursos Naturales y Pesca (Semarnap). (28 de enero de 1988). Ley General del Equilibrio Ecológico y la Protección al Ambiente. Diario Oficial de la Federación, (tomo CDXII, núm.19). (Última reforma 16 de enero de 2014). Recuperado de http://biblioteca.semarnat.gob.mx/janium/Documentos/Ciga/agenda/DOFsr/148.pdf [ Links ]
Secretaría de Medio Ambiente y Recursos Naturales (Semarnat). (2012). Suelos. Informe de la situación del medio ambiente en México: compendio de estadísticas ambientales, indicadores clave y de desempeño ambiental (pp. 119-148). México: Autor . [ Links ]
Sierra, O. (2002). Cultura, recreación y deporte en Tecate. En P. Ganster, F. Cuamea, J. Castro, y A. Villegas (Comps.), Tecate, Baja California: Realidades y desafíos de una comunidad mexicana fronteriza (pp. 99-105). México: San Diego State University Press. [ Links ]
Strahler, A. (1957). Quantitative analysis of watershed geomorphology. Eos Transactios American Geophysical Union, 38(6), 913920. [ Links ]
Tzoulas, K., Korpela, K., Venn, S., Yli-Pelkonen, V., Kaźmierczak, A., Niemela, J. y James, P. (2007). Promoting ecosystem and human health in urban areas using green infrastructure: A literature review. Landscape and Urban Planning, 81(3), 167-178. [ Links ]
Venegas, F. y Rojas, R. (2009). Teoría y práctica del ordenamiento y manejo sustentable del territorio: Tijuana-Rosarito-Tecate, Baja California, México. Información Tecnológica, 20(3), 73-88. [ Links ]
Vila, J., Varga, D., Llausàs, A. y Ribas, A. (2006). Conceptos y métodos fundamentales en ecología del paisaje (Landscape ecology). Una interpretación de la geografía. Documents d'Anàlisi Geogràfica, (48), 151-166. [ Links ]
Whitford, V., Ennos, A. y Handley, J. (2001). City form and natural process: indicators for the ecological performance of urban areas and their application to Merseyside, UK. Landscape and Urban Planning, 57(2), 91-103. [ Links ]
Wilby, R. y Perry, G. (2006). Climate change, biodiversity and the urban environment: a critical review based on London, UK. Prog. Phys. Geography, 30(1), 73-98. [ Links ]
Wolch, J. (1996). Zoöpolis. Capitalism Nature and Socialism, 7(2), 21-47. [ Links ]
Wu, J. (2008). Making the case for landscape ecology: an effective approach to urban sustainability. Landscape Journal, (27), 41-50. [ Links ]
Received: July 08, 2015; Accepted: January 19, 2016
 Este es un artículo publicado en acceso abierto bajo una licencia Creative Commons
