nueva página del texto (beta)
 Inglés (pdf)
 Artículo en XML
 Referencias del artículo
 Enviar artículo por email
 Citado por SciELO
  Similares en
SciELO
Similares en
SciELO 
 Permalink
1. Introduction
The average solar energy density in Mexico is 5.5 kW h m-2 (Weber et al., 2020). With an approximate area of 1 964 375 km2, the average daily solar energy available is of the order of 1013 kW h, which constitutes two orders of magnitude above the electrical energy consumed in 2021 (~ 2.9 × 10¹¹ kW h) (Expansión/Datosmacro.com, n.d.).
In recent years, the installed capacity of photovoltaic energy has grown with 5630 MW installed in 2020 (IRENA, 2021), ranking third among renewable energy sources, after hydroelectric and wind plants. Due to its extension, Mexico has different climates (see map in Fig. 1) that must be considered to propose the most appropriate type of photovoltaic installations according to the climatic variables of each region.
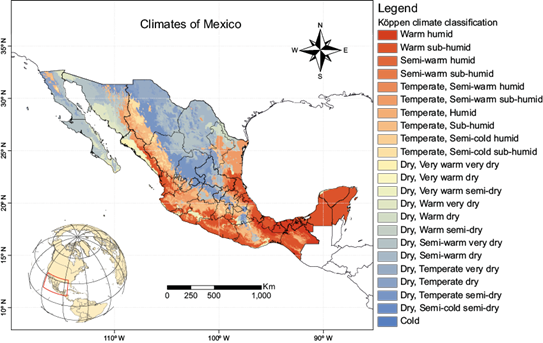
Fig. 1 Köppen climate classification adjusted to Mexico and modified by García. Map made by García and CONABIO (1998) data.
Currently, the photovoltaic solar panel market is primarily led by monocrystalline and polycrystalline silicon solar cell technologies, which account for 80% of the commercial panel market (Paredes-Vázquez et al., 2018). Thin film technologies of cadmium telluride (CdTe), chalcopyrites (CIGS), and amorphous silicon complete the remaining 20% of the market (Lee and Ebong, 2017).
Solar cells with a concentration system of up to 1000 Suns, with parabolic concentrators, are also part of the technological portfolio of solar cells (Coventry, 2005). Other commercially available cells are semi-transparent (Miyazaki et al., 2005) and bifacial (Guerrero-Lemus et al., 2016). The former are used in (building integrated photovoltaics (BIPV) (Jelle and Breivik, 2012), based on the concept of taking advantage of the lateral area of buildings and growing photovoltaic systems in height, and the latter are based on taking advantage of the diffuse radiation in the rear part of the cell that is lost in simple monofacial solar cells. In a bifacial panel, the electrical power delivered can increase by up to 25% compared to a monofacial panel, indicating that this technology is already considered in the development programs of photovoltaic solar energy. In addition, bifacial solar panels better couple the power delivered during daytime when there is more demand for electricity consumption than monofacial solar panels. Hence, photovoltaic solar panels have been designed and commercially produced to address various challenges and meet diverse climatic conditions.
In this context, this work aims to evaluate the specific type of commercial technologies available for existing photovoltaic panels that best adapt to the climatic conditions of each region of the country, considering their electrical parameters and type of structure. The study has been carried out through a rigorous analysis of satellite data obtained through Amazon Web Service (AWS) by the National Oceanic and Atmospheric Administration (NOAA) and processed with Analytical Hierarchical Process (AHP) coupled with Geographical Information Systems (GIS). Previous investigations have exclusively utilized AHP-GIS for generating suitability maps to identify areas suitable for the development of solar photovoltaic (PV) projects (e.g., Noorollahi et al., 2016; Al Garni and Awasthi, 2018; Haddad et al., 2021; Coruhlu et al., 2022, etc.). However, our work introduces a variation in the use of AHP-GIS methodology by generating a suitability map recommending solar panel technologies based on various climatic factors. Moreover, it provides relevant geographic information to enhance the criteria and facilitate decision-making for each region of Mexico. Furthermore, this work allows the development of similar methodologies in other countries or regions of Latin America with irradiance values that justify the utilization of solar resources for photovoltaic energy. Finally, to provide context for the results obtained from satellite data and to align them with the most relevant aspects of state-of-the-art photovoltaic solar technology, a supplementary section related to the subject has been included.
2. Methodology
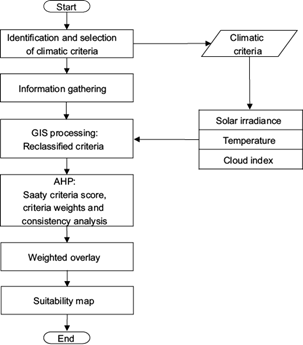
The proposed methodology for the study is detailed in the flowchart exhibited in Figure 2. This methodology is based on three main stages:
Climatic criteria. Literature review and definition of criteria of the study area.
GIS processing. Climatic criteria have different value ranges, so a process must reclassify the values for each criterion. The reclassification process changes input values to a numerical scale. In this study, the scale ranges from 1 to 5. At the same time, this numerical scale corresponds to a type of technology. Furthermore, the reclassification process homogenized the spatial resolution of each criterion to 2 km.
Analytical Hierarchical Process. In this stage, climatic criteria are evaluated by the Saaty criteria score on a pairwise comparison matrix to calculate the relative weights of each criterion. The reclassified climatic criteria are multiplied by the relative weight estimated in the AHP. Those weights are determined as correct if the consistency ratio (CR) is below 0.10 (Saaty, 1987). Finally, sums of each layer’s values produce an integrated output raster layer, which was processed and edited by the ArcGIS 10.8 software using different ArcMap tools to obtain the recommended PV solar energy technology suitability map.
2.1 Climatic criteria
The climatic criteria selected follow the literature review in studies that estimate the potential of photovoltaic solar energy using AHP in conjunction with GIS and the information availability. The criteria selected for this study are temperature (Tahri et al., 2015; Suh and Brownson, 2016; Al Garni and Awasthi, 2018; Ruiz et al., 2020; Sengupta et al., 2021), cloud index (Noorollahi et al., 2016; Zoghi et al., 2017; Sengupta et al., 2021), and solar irradiance (Tahri et al., 2015; Watson and Hudson, 2015; Noorollahi et al., 2016; Suh and Brownson, 2016; Asakereh et al., 2017; Zoghi et al., 2017; Al Garni and Awasthi, 2018; Mohamed, 2020; Haddad et al., 2021; Ríos and Duarte, 2021; Sengupta et al., 2021; Coruhlu et al., 2022).
The quality of the terrestrial observations in Mexico is questionable because the sensors installed in meteorological stations that measure surface solar irradiance (the most important variable in this study) do not receive constant calibration. Therefore, the databases usually have errors, therefore in this situation, the reliability is low when characterizing the spatial distribution patterns of surface solar irradiance (Huang et al., 2019). In this case, satellite information is established as a great alternative source of information in areas where the quality of terrestrial observations is poor.
Daily annual average values derived from the Land Surface Temperature (LST) product were utilized for the temperature criterion. Through Python, the data was downloaded hourly throughout 2020 via AWS by NOAA (NOAA, 2022) and processed.
The cloud index criterion was estimated with radiance values of the Advanced Baseline Imager (ABI) sensor from Geostationary Operational Environmental Satellites, R Series, better known as GOES 16, using Heliosat methodology (Diabaté et al., 1989). The radiance values were downloaded every hour throughout 2020, processed, and then used to calculate the daily annual average cloud index. Subsequently, the cloud index was employed to calculate the atmospheric transmission factor, which in turn was used to estimate global surface solar radiation using the Heliosat methodology. Finally, the daily annual average of solar irradiation was computed. Radiance values were obtained from AWS by NOAA (NOAA, 2022) and processed using Python scripts.
2.2 Geographic Information Systems processing
The characteristics of climatic criteria are shown in Table I. The variables used share practically the same characteristics, therefore their GIS processing steps are almost identical. The GIS data were processed and edited using ArcGIS 10.8 software, employing various tools.
Table I Characteristics of the climatic criteria used in this study.
| Criteria | Unit | Year | Scale | Shapefile format | Spatial reference system |
| Temperature | ºC | 2020 | 2 km | Point | WSG84 |
| Cloud index | DI | 2020 | 2 km | Point | WSG84 |
| Solar irradiance | W m-2 | 2020 | 2 km | Point | WSG84 |
DI: dimensionless.
The first step involved interpolating the data layers using the “Natural neighbor” tool. The resulting layers were classified using the “Natural Jenks” methodology, which maximizes the distinctions between categories. It is important to note that the temperature criterion was an exception and was classified manually. Then the reclassification process changed the input values of the climatic criteria to a numerical scale. In this study, the scale range is from 1 to 5. At the same time, this numerical scale corresponds to a specific type of technology (Table II) to associate the values of each climatic criterion with corresponding technology types based on the electrical characteristics provided in Tables SIV and SV of the supplementary material.
Table II Numerical scale of each technology evaluated.
| Solar panel technology | Numerical scale |
| Monocrystalline silicon | 1 |
| Polycrystalline silicon | 2 |
| Amorphous silicon | 3 |
| CIGS | 4 |
| CdTe | 5 |
The reclassification process (Table III) was determined based on the information provided in Tables II, SIV, and SV. When the average solar irradiance is high, it is advisable to opt for solar panel technologies with lower efficiency, and conversely, when it is low, technologies with higher efficiency are recommended (see Table SIV). For regions with high average temperatures, it is advisable to use solar panels with the lowest negative temperature coefficient (see Table SV). Regarding the reclassification of the cloud index, we considered solar panel technologies capable of utilizing diffuse radiation, such as monocrystalline silicon and polycrystalline silicon. The cloud index is a normalized value that quantifies the atmosphere’s reflective properties concerning the ground’s reflective properties. Values close to or below 0 indicate clear conditions, while values close to 1 suggest cloudy conditions. A high cloudiness index signifies greater diffuse radiation and lower temperatures.
Table III Results of climatic criteria reclassification.
| Climatic criteria (unit) | Criterion value | Reclassification value | Category (technology) | Area (km2) | Percentage (%) |
| Solar irradiance daily annual average (W m-2) | < 421 | 1 | M-silicon | 129 482 | 6.59 |
| 421-448 | 2 | P-silicon | 335 061 | 17.06 | |
| > 448-471 | 4 | CIGS | 638 693 | 32.51 | |
| > 471-497 | 5 | CdTe | 626 380 | 31.81 | |
| > 497 | 3 | a-silicon | 234 760 | 11.95 | |
| Temperature daily annual average (ºC) | < 24 | 1 | M-silicon | 822 883 | 41.89 |
| 24-26 | 2 | P-silicon | 558 673 | 28.44 | |
| > 26-28 | 3 | a-silicon | 403 481 | 20.54 | |
| > 28-30 | 4 | CIGS | 156 151 | 7.95 | |
| > 30 | 5 | CdTe | 23 187 | 1.18 | |
| Cloud index daily annual average (dimensionless) | < -0.246 | 3 | a-silicon | 18 | < 0.01 |
| -0.246-0.126 | 5 | CdTe | 378 583 | 19.27 | |
| > 0.126-0.161 | 4 | CIGS | 1 035 624 | 52.72 | |
| > 0.161-0.201 | 2 | P-silicon | 361 856 | 18.42 | |
| > 0.201 | 1 | M-silicon | 188 294 | 9.59 |
2.3 Analytical Hierarchical Process
AHP has established itself as the most widely used multi-criteria decision-making (MCDM) method when used with GIS for determining specific objectives in regional areas, as demonstrated by the previously cited studies. This study follows Saaty (2001) in the development of AHP methodology.
The first step is to determine the objective and the criteria to use. The objective is to recommend solar panel technologies based on different climatic criteria (solar irradiance, cloud index, and temperature) in Mexico. The second step is to determine priorities among climatic criteria based on a pairwise comparison matrix (Table IV). The priorities were established through a literature review, where the number of authors citing the selected climatic criteria was observed. The total number of articles using each climatic criterion determined its priority in this study (Table V). The values used for each element in these pairwise comparison matrices are used by Saaty (1987).
Table IV Pairwise comparison matrix for climatic criteria.
| Criteria | Solar irradiance | Cloud index | Temperature |
| Solar irradiance | 1 | 3 | 3 |
| Cloud index | 0.33 | 1 | 0.5 |
| Temperature | 0.33 | 2 | 1 |
| Total | 1.66 | 6 | 4.5 |
Table V Prioritization of climatic criteria based on literature review.
| Criteria | References | Use of criteria (total) | |||||||||
| Rios and Duarte, 2021 | Haddad et al., 2021 | Mohamed, 2020 | Coruhlu et al., 2022 | Tahri et al., 2015 | Noorollahi et al., 2016 | Suh and Brownson, 2016 | Ruiz et al., 2020 | Zoghi et al., 2017 | Noorollahi et al., 2022 | ||
| Solar irradiance | × | × | × | × | × | × | × | × | × | × | 10 |
| Temperature | × | × | × | × | × | × | 5 | ||||
| Cloud index | × | × | × | × | × | × | 3 | ||||
The third step is calculating the weight of each climatic criterion. The previous pairwise comparison matrix must be normalized to calculate the weight for each criterion from an average of each row (Table VI). The weight demonstrates the importance of each climatic criterion to achieve the goal. To finish this step, it is necessary to calculate suitability scores using Eq. (1).
where Ss i represents the suitability scores, x i , is the criterion value assigned by Saaty’s criteria score (Saaty, 1987), w i is the weight calculated for each criterion, and n is the number of selected criteria.
Table VI Normalized pairwise comparison matrix.
| Criteria | Solar irradiance | Cloud index | Temperature | Weight (%) | Ss i |
| Solar irradiance | 0.60 | 0.50 | 0.67 | 59 | 1.822 |
| Cloud index | 0.20 | 0.17 | 0.11 | 16 | 0.481 |
| Temperature | 0.20 | 0.33 | 0.22 | 25 | 0.767 |
| Total | 1 | 1 | 1 | 100 |
The last step is the calculated consistency ratio to verify inconsistencies in the pairwise comparison matrices. This step is crucial to ensure a correct valuation. Eqs. (2), (3), and (4) were used to calculate the consistency ratio (Table VII).
where:
CI is the consistency index, m the matrix size, RI the random index value is according to Saaty (1987), CR the consistency ratio, which must be < 0.10 to determine consistency, and λ max the maximum eigenvalue of the pairwise comparison matrix.
Table VII Consistency indices.
| Consistency indices | Values |
| Consistency index (CI) | 0.007 |
| Random index (RI) | 0.580 |
| Consistency ratio (CR) | 0.012 |
To finalize the methodology chapter, the weighted overlay tool in ArcGIS was employed. This tool incorporates the reclassification values (Table III) to homogenize the varying numbering ranges of the climatic criteria, considering the input values of the criteria and the electrical characteristics of solar panel technology types (Tables SIV and SV). The reclassified values are subsequently multiplied by the relative weights obtained through the AHP method for each criterion. Finally, the resulting values are summed together to generate an output raster, which is then used to create the suitability map.
3. Results
3.1 Climatic criteria maps
The technological recommendation for commercial solar panels in each climatic criterion is influenced by several factors. These include the electrical parameters of the solar panel (Tables SIV and SV), the spatiotemporal variation of the climatic criteria (Figs. 4-6), and the chosen data classification method. With these considerations in mind, the following results are obtained:
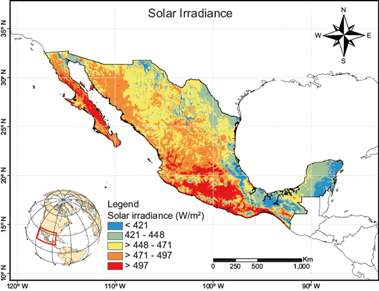
According to the solar irradiance criterion (Table III), CIGS and CdTe emerge as the most recommended commercial solar panel technologies, covering approximately 32.51 and 31.81% of Mexico’s total area, respectively. Areas where CIGS and CdTe are recommended exhibit a daily annual average solar irradiance ranging from 448 to 497 W m-2. The solar irradiance map (Fig. 3) allows us to identify that the states with the highest daily annual average solar irradiance include Morelos (526 W m-2), Guerrero (504 W m-2), and Colima (498 W m-2), and the lowest values are found in Quintana Roo (421 W m-2), Veracruz (430 W m-2), and Yucatán (432 W m-2) (for the rest of the states see the supplementary material).
Based on the temperature criterion (Table III), monocrystalline silicon is the most recommended commercial solar panel technology, covering 41.89% of Mexico’s total area. Monocrystalline silicon is recommended for areas with a daily annual average temperature below 24 ºC. For the remaining areas of the country, solar panels with lower temperature coefficients are advisable. The temperature map (Fig. 4) allows us to identify that the states with the highest daily annual average temperature are Baja California Sur (28 ºC), Sonora (27 ºC), and Sinaloa (27 ºC), and the lowest values are found in Tlaxcala (18 ºC), Mexico City (18 ºC), and Mexico State (18 ºC) (for the rest of the states see the supplementary material).
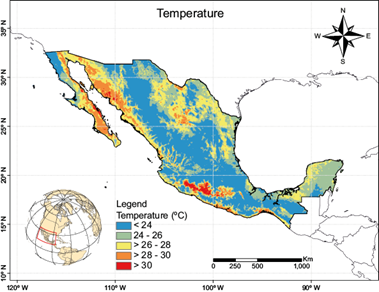
Temperature is the most significant factor affecting the degradation of electrical power delivered by solar panels. The electrical power calculated in a photovoltaic system depends on the series-parallel arrangement of the electrical connections between the panels and their quantity, determined by the required current and voltage output. Losses occurring at the point of maximum power due to temperature increases result in a reduction of this parameter, causing the actual value to decrease in comparison to the calculated one. In states with the highest average temperatures, it is advisable to use solar panels containing solar cells with lower temperature coefficient values to minimize these losses. In this scenario, amorphous silicon and CdTe solar panels are recommended due to their relatively lower temperature coefficient values. Alternatively, oversizing the photovoltaic system by increasing the number of solar panels can also be considered as a solution for other types of technology.
According to the cloud index criterion (Table III), CIGS is the most recommended commercial solar panel technology with 52.72% of Mexico’s total area. CIGS is recommended for areas with a daily annual average cloud index ranging from > 0.126 to 0.161. The cloud index map (Fig. 5) allows us to identify that the states with the highest daily annual average cloud index values are Quintana Roo (0.21), Chiapas (0.20), Veracruz (0.20), and Yucatán (0.20). Conversely, the states with the lowest cloud index values are Baja California (0.11), Morelos (0.11), and Sonora (0.12) (for the rest of the states see the supplementary material).
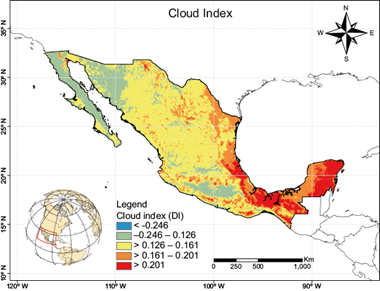
On the other hand, in states with a high cloud index, the use of bifacial solar cells is advisable since they harness the diffuse component of light on their rear face. Bifacial solar cells based on silicon technology have shown the most promising results to date and are considered the leading technology in this field.
3.2 Suitability map
The spatial distribution of recommended solar panel technologies in the suitability map of Mexico reveals a discernible pattern (Fig. 6). Monocrystalline and polycrystalline silicon technologies, which share similar characteristics, are primarily recommended in states around the Gulf of Mexico and northern Chihuahua. These areas are characterized by a high cloud index and low solar radiation values. In contrast, CdTe and CIGS technologies are predominantly recommended in states around the Gulf of Cortés and some areas in central and northern Mexico, which feature high temperatures, low cloud index values, and high-intensity solar radiation. Amorphous silicon exhibits the most versatile distribution pattern in Mexico, making it well-suited for a wide range of climatic conditions. Complementary details on irradiance, cloud index, and temperature results in the 32 States of the Mexican Republic and experimental data of the characterization of solar panels and cells in different parts of the country can be found in the supplementary material.
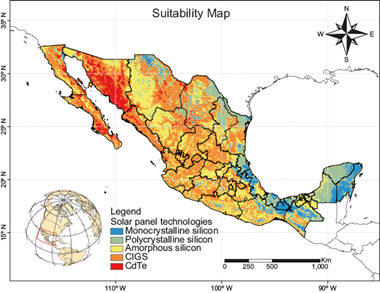
According to Table VIII, CIGS and amorphous silicon are the most suitable solar panel technologies for Mexico. This determination is primarily attributed to how climatic criteria were classified and reclassified within the GIS process, as well as the weights estimated in the AHP methodology. It is worth noting that if an alternative method for data classification had been chosen, the results might have been different. However, given the absence of direct references from similar works in Mexico, this study represents the pioneering effort to recommend the most suitable solar panel technology for the country based on the evaluated climatic criteria.
Table VIII Available areas for the different solar panel technologies in Mexico.
| Solar panel technology | Area (km2) | Percentage (%) |
| Monocrystalline silicon | 120 391 | 6.13 |
| Polycrystalline silicon | 320 110 | 16.30 |
| Amorphous silicon | 598 422 | 30.45 |
| CIGS | 788 436 | 40.14 |
| CdTe | 137 016 | 6.98 |
| Total | 1 964 375 | 100 |
The characteristics of the solar panel technologies analyzed in this study suggest that in areas where monocrystalline silicon is deemed suitable, polycrystalline silicon can also be a viable recommendation, and vice versa. Similarly, this holds true for CIGS and CdTe technologies. Consequently, the choice between technologies may hinge on additional factors such as available investment or market availability.
4. Conclusions
Based on the satellite analysis results in all 32 states of Mexico Republic, the average irradiance and cloud index exceed 421 W m-2 and 0.11, respectively. Regarding average temperature, except for Mexico City, Tlaxcala, and the State of Mexico, the rest of the states record temperatures above 20 ºC (as detailed in Table SI of the supplementary material). The states with highest daily annual average values of irradiance, cloud index, and temperature are shown in Tables IX, X and XI, respectively.
Table IX States with the highest solar irradiance.
| State | W m-2 |
| Morelos | 526 |
| Guerrero | 504 |
| Colima | 498 |
| Baja California Sur | 493 |
| Querétaro | 488 |
| Mexico City | 484 |
Table X States with the highest cloud index.
| State | DI |
| Quintana Roo | 0.21 |
| Chiapas | 0.20 |
| Veracruz | 0.20 |
| Yucatán | 0.20 |
| Campeche | 0.19 |
| Tabasco | 0.19 |
DI: dimensionless.
Table XI States with the highest temperature.
| State | ºC |
| Baja California Sur | 28 |
| Sinaloa | 27 |
| Sonora | 27 |
| Colima | 26 |
| Morelos | 26 |
| Yucatán | 26 |
The outcomes of this study will serve as a valuable resource for guiding the selection of the most suitable solar panel technology based on the specific climatic variables in the location of a photovoltaic solar energy project.
The proper selection of solar panel technology has a direct and immediate impact on the project’s investment. While there is often an inclination to opt for commercial panels with higher efficiency to maximize energy production, this study’s results challenge this notion. The suitability map (Fig. 6) highlights that CIGS and CdTe are the most appropriate commercial solar panel technologies for installation in 47.12% of Mexico’s territory. Amorphous silicon technology is recommended for 30.45%, while monocrystalline and polycrystalline silicon are suitable for the remaining 22.43%.
The present study has established multiple criteria based on satellite data, thus ensuring a higher degree of accuracy and reliability in the results. This approach involved excluding data from meteorological stations due to issues related to sensor calibration and deterioration. As a result, we have confidence in the precision and trustworthiness of the findings presented in this research.
The suitability map generated through the AHP-GIS methodology is directly influenced by the intrinsic characteristics of the satellite data used. In this study, data with a spatial resolution of 2 km were employed, which means that the results are more suitable for regional-scale projects. It is important to note that the suitability map provides a general idea of the type of technology that may be suitable for local projects, which can be complemented with other variables and specific aspects before making final decisions on the technology to be used.
Based on the suitability map of photovoltaic technologies, a site selection study could be conducted for specialized recycling plants that recycle solar panel materials. This would help reduce costs associated with material transportation. For instance, the suitability map shows that the state of Sonora is ideal for the use of CdTe technology, while in the states of the Yucatan Peninsula, monocrystalline and polycrystalline silicon technologies are preferably recommended. This indicates the need for recycling plants with different recycling processes. Such an approach could facilitate the strategic placement of recycling plants, optimizing resources and minimizing environmental impacts associated with long-distance material transportation. However, it is important to note that the feasibility and viability of establishing recycling plants in specific locations will depend on various factors such as infrastructure availability, local regulations, and recycling demand in the region.
Furthermore, it is recommended to update the suitability map of photovoltaic technologies annually to observe if the selection of photovoltaic technology changes due to the accelerating climate change. Additionally, it is preferable to make the study more robust each time by incorporating more climatic variables and considering other factors such as the costs associated with solar panels.