


 nueva página del texto (beta)
 Inglés (pdf)
 Artículo en XML
 Referencias del artículo
 Enviar artículo por email
 Citado por SciELO
  Similares en
SciELO
Similares en
SciELO 
 Permalink
1. Introduction
Long-term global warming targets were established by the 2015 Paris Agreement, which called for keeping the rise in global temperatures well below 2.0 ºC and ideally below 1.5 ºC above preindustrial levels (Sugiyama et al., 2020). Nevertheless, the global community is still struggling to figure out how to accomplish these lofty goals as the impacts of climate change (CC) are still very evident (Ukhurebor et al., 2020, 2021, 2022; Ukhurebor and Aidonojie, 2021). Because the current level of mitigation efforts is deemed insufficient, some experts advocate for more extreme strategies such as climate engineering (CE), which refers to a broad category of direct manipulations in the global climate system to combat global warming (NRC, 2015a, b; UNEP, 2018; Aldy et al., 2021; Dai et al., 2021; Táíwò and Talati, 2021; Schubert, 2022).
One class of climate engineering (climate engineering technology), solar radiation management or modification (SRM), has been suggested as a potential means of temporarily keeping the temperature increase below the 1.5-2 ºC barrier (MacMartin et al., 2018; Sugiyama et al., 2018). SRM refers to a group of as-yet-unrealized technologies that aim to reflect some sunlight back and thus reduce climate impact. In particular, some scientists and policymakers have been paying more attention to stratospheric aerosol injection (SAI), the concept of releasing aerosol particles into the stratosphere by simulating the cooling effect of volcanic eruptions.
It is important to note that SAI is not a replacement for reducing greenhouse gases (GHG) emissions, but it might serve as a temporary strategy to contain warming and serve as a stopgap measure, giving humanity more time to mitigate GHG emissions and adapt to a changing climate. SAI is currently being investigated for its potential to serve as a stopgap measure against CC (NASEM, 2021).
Some of the effects of CC appear to be avoidable with SAI (Irvine et al., 2019). According to climate models, SAI is capable of bringing local, regional, and global temperatures and precipitation levels closer to pre-industrial levels. Its main benefits are quick deployment, quick activation, and the reversibility of its direct climatic impacts. Although still out of reach for individuals, small states, or other non-state actors, SAI appears technically feasible and cheap in terms of direct financial costs; rather, it would be the exclusive domain of powerful national economies or coalitions that include at least one such economy (Smith, 2020).
SAI does not solve ocean acidification because it does not directly lower carbon dioxide levels in the atmosphere. The excessive use of SAI, its inadequate dispersion, or abrupt termination may have detrimental effects on the environment. Since little research has been done, there is potential for other detrimental effects, but uncertainty remains high as well. Several factors make regulating SAI difficult, including the likelihood that few nations could handle it on their own (Parson and Reynolds, 2021; Wagner, 2021).
The Geoengineering Model Intercomparison Project (Geo-MIP) is a climate modeling study that has significantly advanced our scientific knowledge of the possible benefits and dangers of SAI approaches (Kravitz et al., 2013; NRC, 2015b). Regarding the social and environmental hazards that would come along with such extensive, technical interventions, there are still a lot of uncertainties (Sugiyama et al., 2020). It is generally agreed that a thorough societal discussion about the regulation of SRM technologies would be necessary, given the high stakes for humanity and the high level of uncertainty (Carr et al., 2013, 2018).
Actually, some early research initiatives specifically incorporated public involvement activities within their study programs (Corner et al., 2012; Pidgeon et al., 2012, 2013; Bellamy and Lezaun, 2017; Sugiyama et al., 2017; Olanrewaju et al., 2018; Delina, 2021). According to Sugiyama et al. (2020), SAI is a contentious technological idea to purposefully cool the globe in order to address CC challenges. The governance of SAI is viewed as needing an open and worldwide discussion due to significant concerns regarding the global effects of its deployment. However, until now the majority of public perception studies on SAI have only focused on the global North or Western democracies, including academic controversy on CE technologies (Mercer et al., 2011; Collomb, 2020). Such research must also consider the opinions of the global South to overcome any bias since social acceptability is essential for SAI governance. More social science studies examining the public’s perceptions of SAI are needed to encourage public discourse on the subject. Global South countries (e.g., Pakistan [Malik et al., 2012; Waheed et al., 2021], Kenya [M’mboroki et al., 2018; Koech et al., 2020], and Nigeria [Adejuwon, 2013]) are highly vulnerable to CC.
Hence, the present study will explore the attitudes toward SAI as well as the CE deployment in developing countries (Pakistan, Nigeria, and Kenya) by surveying online more than a thousand respondents, dominantly the faculty members and students from universities around the global South. Therefore, the aim of this work is to close this gap in earlier research on SAI perceptions as well as the CE deployment by extending its geographical and socioeconomic focus beyond the global North and earlier studied global South areas.
2. Methodology
2.1 Survey instrument
The survey for this study was based on earlier surveys of public opinions on SAI using the questionnaire format from Sugiyama et al. (2020). Views toward SAI field tests as well as the CE deployment were the main focus. This emphasis on SAI field testing was chosen because the discussion of SRM governance is more concerned at the moment with research, particularly outdoor field tests, than with deployment (NRC, 2015b). Verbal consent from all the intended participants was obtained.
In addition to the previously asked questions about SAI deployment, we added several new questions focusing on the respondents’ opinions about SAI field testing in order to closely align public perception research with the ongoing governance debate in these developing countries (Pakistan, Nigeria, and Kenya).
2.2 Sample
A total of 2900 surveys were disseminated among respondents (800 in Kenya, 1200 in Nigeria, and 900 in Pakistan). Respondents were mostly university graduate and undergraduate students, together with faculty and non-academic staff. A few stakeholders in industry, policymakers, NGOs, and the general public also responded. Respondents from universities were more likely to participate unlike other stakeholders, who were somehow resistant. In this context, 362 respondents filled out the surveys in Kenya, and 353 in Nigeria and Pakistan, respectively, which indicates a response rate of 45% for Kenya, 29% for Nigeria, and 39% for Pakistan. After data cleaning, the overall sample size for each county was 345 for further analysis.
In the context of gender response rate, male respondents in Kenya, Nigeria, and Pakistan were 66, 45, and 65%, respectively. In terms of female respondents, the response rate from Kenya, Nigeria, and Pakistan was 34, 55, and 35%, respectively. Only 1% of transgender individuals from Kenya filled out the questionnaires. Similarly, in the context of professions, the response rate of faculty was 50, 68, and 40% from Kenya, Nigeria, and Pakistan, respectively, while the response rate of students was 43% from Kenya, 30% from Nigeria, and 58% from Pakistan. Similarly, the government policymakers response rate was 7% for Kenya, 1% for Nigeria, and 3% for Pakistan. In Kenya, the specialization of respondents was in natural sciences (64%), social sciences (22%), and humanities (13%). A high proportion of respondents with specialization in natural sciences was also seen in Nigeria (83%) and Pakistan (58%), followed by humanities (10% and 21%, respectively) and social sciences (7% and 20%, respectively).
2.3 Data cleaning and pre-processing
An initial data review was carried out to ensure that questionnaires were filled out properly. In this context, we removed the invalid and not properly filled responses. For example, 17 invalid responses were removed from Kenya’s questionnaires, and eight from Nigeria and Pakistan, respectively. Further, to make an equal sample size for all three countries, the extra filled questionnaires of Kenya were removed as pre-analysis data processing. Furthermore, some respondents mentioned their country’s city name in the basic information section “Your country” of the questionnaire. For homogeneity, we replaced city names with the appropriate country name. For example, in the case of Pakistan, some respondents mentioned Swat and Islamabad as a country. Hence, we replaced those with the word Pakistan.
3. Results and discussion
3.1 Concerns over global warming
Respondents from all three countries (95%) were quite confident that man-made global warming (GW) was occurring (Q1). More than 84% of respondents, i.e., 91% from Kenya, 82% from Pakistan, and 79% from Nigeria, believed that GW is due to anthropogenic activities (Q2). The vast majority of respondents (Kenya: 80%; Pakistan: 77%, and Nigeria: 61%) agreed that “most scientists think GW is happening”, with a minority of respondents (27% in Nigeria, 15% in Kenya, and 12% in Pakistan) agreeing that “there is a lot of disagreement among scientist over whether GW is happening or not” (Q3).
In the context of GW concerns, the response rate for the option “very worried” or “somewhat worried” was selected by 89% in Pakistan, 86% in Kenya, and 69% in Nigeria (Q4). This was a higher response rate than the reverse options (“not very worried” or “not worried at all”), indicating fairly high concerns of respondents about GW. It must be noted that for Nigeria, 27% of respondents were “not very worried” about GW, almost three times higher than in Kenya (11%) and Pakistan (9%). There is also a high degree of awareness of the impacts of GW on Global South countries at the personal level: 49% of Pakistani respondents, 32% of Kenyan respondents, and 21% of Nigerian respondents felt that GW was personally “extremely important” to them, followed by “very important” (33% from Pakistan, 41% from Kenya, and 37% from Nigeria [Q5]). In terms of solutions to GW (Q6), respondents were mostly in favor of large-scale interventions, even if they have important consequences (Kenya: 58% Pakistan: 54%, and Nigeria: 52%), followed by medium-scale interventions, even if they have medium consequences (Kenya: 35%; Pakistan: 30%, and Nigeria: 39%).
Furthermore, 82% of respondents from Nigeria, 79% from Kenya, and 69% from Pakistan “strongly agreed” that GW would pose a thoughtful threat to humanity (Q7S1). When asked if “the seriousness of GW was exaggerated”, 49% of Kenyan respondents “strongly disagreed”, as compared to only 32% of Nigerian respondents and 19% of Pakistani respondents (Q7S2). Pakistani respondents “strongly agreed” or “somewhat agreed” to the above statement 55% of the time, as compared to only 36% of Nigerian respondents, and 22% of Kenyan respondents. The majority of respondents in Pakistan (70%), Kenya (62%), and Nigeria (52%) “strongly agreed” that “GW would have a big impact on their country”, fewer respondents “strongly agreed” and “somewhat agreed” in Nigeria (36%) and Pakistan (55%) (Q7S3). A large portion of Nigerian respondents (32%) “strongly disagreed” that GW would likely have a big impact on their country.
In order to combat CC, the majority of the respondents of all countries “strongly agree” and “somewhat agree” with behavioral changes to reduce GW (Q7S4). The percentage of respondents for the “strongly agree” option was 56% for Kenya, 52% for Nigeria, and 70% for Pakistan, which indicates that Global South countries are cognizant of the impacts of GW on their countries and personal property, and are willing to act to mitigate GW. In addition to this, Global South countries also have a high awareness that GW will probably not be resolved due to individual action (Q7S5): 51% of Pakistani, 48% of Nigerian, and 29% of Kenyan respondents either “strongly agreed” or “somewhat agreed” with this assertion. However, a large proportion (42% from Pakistan, 40% from Nigeria, and 62% from Kenya) also either “strongly disagreed” or “somewhat disagree” with that statement. This indicates that there is a high level of diversity of opinions in the Global South on how best to tackle GW. The results for Q7 are presented in Figure 1.

3.2 Support for climate engineering research
Self-reported knowledge on CE was found to be divisive, with below average replies in Kenyan (36%) and Pakistani (34%) respondents, who reported that they “have heard of and know little about” CE, while only 28% of Nigerian respondents felt the same. Below average (35%) of Nigerian respondents reported having “never heard of nor know about CE at all” (Q8). A minority reported having “heard of and knowing a lot about CE” (Pakistan: 21%; Kenya: 12%, and Nigeria: 10%). In the context of affective feelings about CE (Q9), below average (slightly low) respondents from all countries felt “very positive” and “fairly positive” (Pakistan: 41%; Kenya: 41%, and Nigeria: 33%) felt “very positive” about CE, while respondents of Nigeria (40 %), Pakistan (38%), and Kenya (37%) felt “fairly positive” about CE.
Respondents were asked to rate their level of agreement on various aspects of CE use statements. The majority “strongly agreed” and “somewhat agreed” that CE should be used as soon as possible (81% from Pakistan, 79% from Kenya, and 76% from Nigeria [Q10S1]). When the reverse statement was posed (that “CE should never be used, no matter the situation” [Q10S2]), the majority of respondents from all three countries selected the “Don’t know” option (Nigeria: 59%; Kenya: 53%, and Pakistan: 47%). There was also a high degree of agreement among respondents regarding the “willingness to allow CE, if it averts the worst consequences of GW” and “if it gives more time to reduce GHG emissions (Q10S3 and Q10S4). Kenyan respondents “strongly agreed” with those statements (60 and 61%, respectively), followed by Nigerian respondents (49 and 48%, respectively), and then Pakistani respondents (43 and 44%, respectively). Respondents were also asked about when not to use CE “if it causes harm to the environment” and “if it reduces people’s motivation to reduce CO2 emissions” (Q10S5 and Q10S6). In both situations, below average (slightly low) of the respondents from all countries selected the “Don’t know” option: Kenya (48% for both); Pakistan (38% and 37%, respectively), and Nigeria (36% and 37% respectively). Those who did answer were fairly well captured by the “strongly agree”, “somewhat agree” and “strongly disagree” categories in all three countries. The results for Q10 are presented in Figure 2.

3.3 Consensual demand for climate engineering research governance
As for CE field testing (Q11), the majority of respondents from Kenya (56%), Pakistan (51%), and Nigeria (44%) were “willing to accept” that scientists will conduct field tests of CE, while some respondents were “reluctant, but willing to accept CE needs to combat GW” (Nigeria: 34%; Pakistan: 23%, and Kenya: 21%). Similarly, respondents were in favor of “an international framework” for regulating CE (Kenya: 60%; Pakistan: 54%, and Nigeria: 51%) followed by “national level regulation” (Nigeria: 25%; Pakistan: 23%, and Kenya: 21% [Q12]).
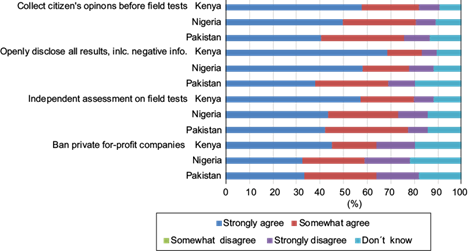
There was a high level of agreement on questions related to CE disclosure among all countries. The vast majority either “strongly agreed” or “somewhat agreed” that “scientists should listen to public opinion prior to conducting CE field tests” (Q13S1), starting with Kenya (82%), followed by Nigeria (81%), and Pakistan (76%). Similar levels of agreement were found for the statement “scientists should openly disclose all results, including negative information” (Q13S2), where Kenya (83%) was followed by Nigeria (78%) and Pakistan (69%). Furthermore, respondents “agreed” that there ought to be “independent assessments on how to conduct CE field tests” (Q13S3) (Kenya: 80%; Pakistan: 77%, and Nigeria: 73%). There was a lower “agreement” that “private-for-profit companies should be banned from CE activities” (Q13S4) (Kenya: 64%; Pakistan: 64%, and Nigeria: 59%). These results indicate that Global South countries are aware of the role regulation must play in managing CE, including roles for disclosure and private companies in the future. The results are presented in Figure 3.
Considering which countries should take the leading role in CE research, including the field test (Q14), below average respondents of all countries revealed that the countries with “high technical capacity” should take initiative (Kenya: 41%; Nigeria: 40%, and Pakistan: 34%), whereas the response that countries with “largest CO2 emissions” should take the initiative was as follows: Kenya: 35%; Pakistan: 33%, and Nigeria: 29%. In the case of government policymakers, some of the respondents selected the option “largest CO2 emissions” (Kenya: 38%; Nigeria: 60%; and Pakistan: 44%), followed by “high technical capacity” countries (Kenya: 38%; Nigeria: 20%, and Pakistan: 22%).
Similarly, below average of the respondents from Kenya (45%), Pakistan (39%), and Nigeria (32%) “strongly supported” the proposal of CE to combat GW (Q15). Importantly, a considerable number of respondents (Nigeria: 45%; Kenya: 39%, and Pakistan: 39%) “tend to oppose” the proposal of CE to combat GW (Q 15). These results indicate that the knowledge and views of CE are a divisive issue in the Global South.
3.4 Views on environment, society, science, and trust in institutions
Additional issues related to views of environment, society, science, and trust in institutions were asked to the respondents. Of the three questions related to science, there was highest agreement among all three countries that science was believed in more often than feelings and religion (Pakistan: 68%; Nigeria: 65%, and Kenya: 64% [Q16S1]), with lower levels of agreement that modern science does more harm than good (Pakistan: 59%; Nigeria: 46%, and Kenya: 38% [Q16S2]). Respondents tended to agree with the statement “modern science will solve our environmental problems with little change to the way of life” (Pakistan: 77%; Nigeria: 67%, and Kenya: 63% [Q16S3]). The linkage between economic growth and environmental protection was also tested, and respondents agreed that “almost everything we do in modern life harms the environment”, with all countries agreeing at rates of 68, 67, and 67% for Nigeria, Pakistan, and Kenya, respectively (Q16S5). Higher agreement was found for the statement “to protect the environment, economic growth is needed” (Nigeria: 82%; Pakistan: 80%, and Kenya: 68% [Q16S7]). When the reverse was asked, “economic growth always harms the environment”, respondents were less agreeable (Pakistan: 50%; Kenya: 42%, and Nigeria: 35% [Q16S8]). The results are shown in Figure 4.

In terms of trust in institutions, government (Q17S1) and private companies (Q17S2) scored lowest for all countries. Pakistan (60%) had higher trust in government, as compared to Kenya (50%), and Nigeria (37%), similar to private companies (Pakistan: 57%; Kenya: 51%, and Nigeria: 50%). Environmental organizations (Q17S3), researchers at universities and institutions (Q17S6) and NGOs/international organizations (Q17S7) received the highest agreement from respondents (Kenya: 84, 88, and 80%, respectively; Pakistan: 79, 79, and 72%, respectively; and Nigeria: 71, 75, and 77%, respectively). The media and friends and family scored similarly. Results are presented in Figure 5.

In order to test the differences between faculty, government policy makers and students of different countries, we performed a Kruskal-Wallis test (non-parametric, one-way analysis of variance [Sugiyama et al., 2020]). The results are displayed in Table I. Several statistically significant differences were apparent regarding feelings towards CE between the faculties of all countries. For Q10S2, Pakistani faculty were more likely to “somewhat agree” that CE should not be used, no matter what, as compared to their Kenyan and Nigerian counterparts. Similarly, Pakistani faculty were also more likely to “disagree” their willingness to accept the use of CE to avert the most adverse effects of CC (Q10S3), while Kenyan and Nigerian faculties “strongly disagreed”. Also, Kenyan faculty were more likely to “strongly agree” to accept the use of CE to delay CO2 emissions mitigation (Q10S4), while Nigerian and Pakistani faculties only “somewhat agreed”.
Table I Results of the Kruskal-Wallis Test (non-parametric one-way ANOVA) for faculty, government policymakers and students of Kenya, Nigeria and Pakistan.
| Faculty | |||||||
| Country | Q10S1 | Q10S2 | Q10S3 | Q10S4 | Q10S5 | Q10S6 | |
| Kenya | 273.85 | 285.48 | 248.57 | 243.84 | 304.03 | 313.80 | |
| Nigeria | 282.07 | 288.86 | 271.71 | 273.72 | 265.47 | 259.84 | |
| Pakistan | 252.41 | 226.25 | 301.75 | 304.20 | 243.22 | 240.68 | |
| H-statistic | 3.58 | 18.84*** | 10.46*** | 13.26*** | 13.46*** | 20.87*** | |
| Q13S1 | Q13S2 | Q13S3 | Q13S4 | ||||
| Kenya | 255.00 | 243.45 | 258.48 | 260.41 | |||
| Nigeria | 268.71 | 262.67 | 283.15 | 288.10 | |||
| Pakistan | 298.87 | 323.63 | 269.75 | 258.85 | |||
| H-statistic | 7.18*** | 26.10*** | 2.85 | 4.74 | |||
| Q17S1 | Q17S2 | Q17S3 | Q17S4 | Q17S5 | Q17S6 | Q17S7 | |
| Kenya | 267.03 | 282.76 | 231.90 | 261.73 | 245.68 | 250.05 | 296.01 |
| Nigeria | 303.10 | 281.83 | 299.43 | 278.20 | 294.45 | 272.85 | 265.63 |
| Pakistan | 224.85 | 241.71 | 274 99 | 274.19 | 266.35 | 297.94 | 252.95 |
| H-statistic | 22.87*** | 7.37*** | 21.05*** | 1.24 | 11.33*** | 8.07*** | 7.09* ** |
| Government | |||||||
| Country | Q10S1 | Q10S2 | Q10S3 | Q10S4 | Q10S5 | Q10S6 | |
| Kenya | 15.75 | 19.71 | 17.54 | 18.40 | 21.13 | 21.25 | |
| Nigeria | 28.80 | 21.00 | 17.70 | 14.5O | 21.80 | 20.00 | |
| Pakistan | 24.33 | 18.11 | 25.72 | 25.22 | 13.89 | 14.56 | |
| H-statistic | 9.86*** | 0.31 | 6.18*** | 6.08*** | 3.33 | 2.69 | |
| Q13S1 | Q13S2 | Q13S3 | Q13S4 | ||||
| Kenya | 18.15 | 17.38 | 19.75 | 17.88 | |||
| Nigeria | 15.60 | 20.70 | 14.00 | 22.30 | |||
| Pakistan | 25.28 | 24.50 | 2189 | 22.28 | |||
| H-statistic | 4.60 | 4.12 | 2.62 | 1.66 | |||
| Q17S1 | Q17S2 | Q17S3 | Q17S4 | Q17S5 | Q17S6 | Q17S7 | |
| Kenya | 18.52 | 20.60 | 16.73 | 17.75 | 17.33 | 16.81 | 19.63 |
| Nigeria | 25.70 | 20.60 | 25.90 | 26.90 | 21.90 | 27.00 | 21.20 |
| Pakistan | 18.67 | 15.94 | 23.33 | 20.06 | 23.94 | 22.50 | 18.22 |
| H-statistic | 2.04 | 1.27 | 5.08 | 3.10 | 3.03 | 5.70 | 0.26 |
| Student | |||||||
| Country | Q10S1 | Q10S2 | Q10S3 | Q10S4 | Q10S5 | Q10S6 | |
| Kenya | 229.53 | 226.02 | 204.28 | 205.85 | 244.98 | 247.51 | |
| Nigeria | 245.10 | 247.37 | 250.02 | 248.50 | 209.78 | 221.49 | |
| Pakistan | 216.68 | 218.13 | 233.12 | 232.74 | 223.68 | 215.59 | |
| H-statistic | 3.76 | 4.05 | 9.60*** | 8.49*** | 5.23 | 5.93 | |
| Q13S1 | Q13S2 | Q13S3 | Q13S4 | ||||
| Kenya | 206.38 | 190.43 | 194.90 | 214.66 | |||
| Nigeria | 225.46 | 219.73 | 241.85 | 226.22 | |||
| Pakistan | 244.49 | 259.54 | 244.50 | 237.85 | |||
| H-statistic | 8.51*** | 29.07*** | 16.06*** | 2.92 | |||
| Q17S1 | Q17S2 | Q17S5 | Q17S4 | Q17S5 | Q17S6 | Q17S7 | |
| Kenya | 233.78 | 239.26 | 206.56 | 228.29 | 216.50 | 215.51 | 245.95 |
| Nigeria | 269.00 | 226.45 | 252.38 | 218.93 | 258.56 | 229.24 | 215.14 |
| Pakistan | 200.87 | 219.19 | 230.16 | 231.43 | 219.40 | 235.62 | 220.11 |
| H-statistic | 20.31* ** | 2.18 | 8.87*** | 0.69 | 8.94*** | 2.29 | 4.96 |
***Statistically significant results.
A statistically significant difference arose when comparing Kenyan faculty against their Nigerian and Pakistani counterparts when asked that CE should not be used due to its harmful impacts on the environment (Q10S5), as well as not using CE due to its moral hazards (Q10S6). Half of the Kenyan faculty as a whole answered “Don’t know”, while only approximately a third of the Nigerian and Pakistani faculties responded the same. In both questions, Pakistani and Nigerian faculties were almost twice as likely to “strongly or somewhat agree” in not using CE, due to its impacts on the environment and its moral hazards implications.
With reference to the role that scientific community can play, the responses of Pakistani faculty were significantly different from Kenyan and Nigerian faculties regarding the role that citizens’ opinions should play into scientific community decisions to engage in CE field tests (Q13S1). The same was found to be true for whether scientists should openly disclose results of field tests, including negative information (Q13S2).
Regarding trust, Pakistani faculty displayed a greater level of trust in their government, as compared to Kenyan and Nigerian faculties (Q17S1). The level of distrust in private companies was higher among Kenyan faculty, in comparison to Nigerian and Pakistani faculties (Q17S2). The level of trust in environmental organization was lowest among Nigerian faculty, in comparison to Kenyan and Pakistani faculties (Q17S3).
Government policymakers had statistically significant differences between countries, with Pakistani officials least likely to suggest the use of CE (Q10S1), and most likely to select “Don’t now” when asked about their willingness to accept the use of CE to avert the most adverse effects of CC (Q10S3). Pakistani government policymakers were also only likely to “somewhat agree” on accepting the use of CE to give more time to cut CO2 emissions, as compared to Kenyan and Nigerian faculty, who “strongly agreed” to do the same.
We performed multinomial logistic regression to analyze and understand what critical factors have influenced the attitudes towards CE and GW. Table II summarizes the results of the regression with the pooled data for Pakistan. Similar tables were obtained for Kenya and Nigeria (not shown). Multinomial logistic models were adopted since the dependent variables (Q9, Q11, and Q 15) are ordinal, and we used the middle response as the base. Thus, for Q9 and Q11, the coefficients indicate changes from indifference to support or opposition.
Table II Results of multinomial logistic regression of the pooled data (Pakistan).
| Q9 (affective feeling) | Q13 (support for field testing) | Q15 (cognitive evaluation) | |||||||||||
| 1 | 2 | 4 | 5 | 1 | 2 | 4 | 5 | 1 | 2 | 4 | 5 | ||
| Intercept | 5.842 | 2.993 | -5.137 | -159.893 | 3.170 | 0.282 | -5.297 | -2.319 | 7.607 | -0.021 | 4.000 | -7.412 | |
| Q.5 | -0.879 | -0.303 | -0.080 | 29.123 | 0.244 | 0.532 | 0.306 | 0.633 | -0.153 | 0.451 | 0.291 | 0.575 | |
| Q7S1 | -0.480 | -0.159 | 1.001 | 15.738 | 0.097 | 0.359 | 0.982 | 0.420 | -0.086 | 0.657 | 0.147 | 0.352 | |
| Q7S2 | -0.294 | -0.210 | 0.397 | -31.169 | -0.252 | -0.268 | -1.734 | -0.025 | -0.005 | -0.071 | -0.066 | -0.155 | |
| Q7S3 | 0.134 | 0.004 | 0.397 | -12.226 | -0.656 | -0.255 | 1.374 | -0.426 | -0.340 | -0.617 | -0.109 | -0.193 | |
| Q7S4 | -0.372 | -0.181 | -0.111 | 16.373 | 0.232 | 0.216 | 0.067 | -0.044 | -0.066 | 0.120 | 0.423 | -0.857 | |
| Q7S5 | -0.093 | -0.078 | -0.484 | -0.675 | 0.343 | 0.275 | -0.436 | 0.212 | -0.118 | 0.239 | 0.001 | -0.846 | |
| Q16S1 | -0.391 | -0.527 | -0.651 | 19.350 | 0.128 | 0.258 | -0.170 | 0.614 | -0.467 | -0.103 | -0.267 | 0.846 | |
| Q16S2 | 0.116 | 0.353 | 0.404 | -26.527 | -0.089 | -0.178 | -0.108 | -0.204 | -0.291 | -0.337 | 0.034 | 0.900 | |
| Q16S3 | -0.230 | 0.453 | 0.271 | 32.292 | -0.097 | -0.047 | -1.565 | -0.020 | -0.324 | -0.348 | -0.168 | 0.256 | |
| Q16S4 | 0.314 | 0.149 | -0.752 | -13.874 | -0.095 | 0.123 | 0.539 | -0.029 | 0.127 | -0.064 | -0.072 | 0.448 | |
| Q16S5 | 0.067 | -0.011 | -0.882 | -11.173 | -0.317 | -0.329 | 0.752 | -0.408 | 0.020 | 0.198 | 0.089 | -0.056 | |
| Q16S6 | -0.141 | -0.025 | 0.921 | -22.710 | 0.302 | 0.185 | -0.594 | 0.291 | -0.304 | 0.080 | -0.033 | 0.081 | |
| Q16S7 | -0.348 | -0.317 | -0.422 | 25.279 | -0.276 | 0.151 | -0.021 | -0.202 | -0.277 | 0.578 | -0.153 | -0.254 | |
| Q16S8 | 0.053 | 0.000 | -0.670 | -25.335 | 0.262 | 0.346 | 0.286 | 0.385 | 0.056 | 0.135 | -0.081 | 0.011 | |
| Q16S9 | 0.120 | 0.078 | 1.128 | 15.116 | -0.229 | -0.283 | 0.581 | 0.026 | -0.297 | -0.354 | -0.241 | -0.207 | |
| Q17S1 | -0.127 | -0.127 | -0.814 | 9.843 | 0.285 | -0.039 | 0.421 | 0.123 | 0.291 | -0.551 | 0.276 | -0.013 | |
| Q17S2 | 0.247 | 0.474 | 0.429 | -8.765 | -0.223 | -0.013 | 0.281 | 0.059 | -0.218 | 0.256 | -0.086 | 0.501 | |
| Q17S3 | -0.128 | -0.152 | 0.654 | -26.748 | 0.264 | 0.174 | 0.721 | 0.285 | -0.525 | 0.294 | -0.389 | -0.074 | |
| Q17S4 | -0.166 | -0.338 | -0.314 | 5.227 | -0.174 | -0.212 | 0.082 | -0.258 | 0.129 | -0.260 | 0.027 | 0.743 | |
| Q17S5 | 0.286 | 0.178 | -0.669 | 6.029 | -0.252 | 0.007 | 0.421 | 0.017 | 0.153 | -0.898 | -0.205 | 0.775 | |
| Q17S6 | -0.452 | -0.279 | 0.198 | 20.614 | -0.518 | -0.523 | 0.140 | -0.112 | -0.468 | 0.461 | -0.471 | -0.650 | |
| Q17S7 | 0.040 | -0.125 | 0.629 | 20.495 | 0.395 | 0.246 | -0.783 | 0.133 | 0.002 | -0.329 | -0.009 | -0.639 | |
| N | 345 | 345 | 345 | ||||||||||
| Pseudo R2 | 0.361 | 0.306 | 0.364 | ||||||||||
In this context, we selected reference category 3 while analyzing the pooled data. The pseudo R2 is not very large, but there are some statistically significant effects, demonstrating that principal components variables related to concern on CC (Q5 and Q7); attitudes towards science, environment, and economic growth (Q16), and trust in institutions as a source of information about environmental concerns (Q17), demonstrate differing attitudes toward GW. Furthermore, the values for principal components related to Q5, and Q15 were negative for all choices from Kenya respondents (Table S1). Additionally, no response was found against choice 2 of Q15 from Kenya and Nigeria’s pooled data. However, more information is required regarding the current technological readiness of CE and the risks or uncertainties of CE.
4. Conclusions
The results of this survey indicate that there is a high degree of knowledge about GW and its concerning factors in the studied Global South countries. The results further confirm previous research which found that Global South countries are likely to accept CE solutions to reduce the impacts of GW and to give more time to cut CO2 emissions. Developing countries, such as the ones sampled, are highly vulnerable to the effects of GW, and need earlier action to diminish CC impacts, including the use of CE if climate mitigation strategies do not ramp up at the level required. To that end, support for field testing of CE was found to be slightly low in all countries, with calls for an international framework of regulations to guide research and governance. Further, the countries surveyed also have a high degree of expectation for disclosures related to field testing, including negative information.
The survey has some limitations that must be acknowledged. It is an online survey, undertaken across university campuses; therefore, it is not a representative sample of developing countries. While it is a continuation of previous research attempts to elucidate opinions on the subject of CE, a nationally representative sample may yield different results. Second, this survey instrument simplified the information regarding CE to a certain extent for ease of the respondent’s understanding, and neglected to include other pertinent information that follow-up surveys may look to incorporate, such as the role of carbon dioxide removal, the concept of a termination shock, and the lack of a response for ocean acidification issues, to name a few.
Thoughtful specific comparisons about SAI in the Global South compared to views prevalent in the Global North requires recognition of diversity in the cultural, social, economic, geopolitical, and historical context, as well as the regional CC experiences within each region. In this context, Shue (2010) discussed commonsense principles of fairness or equity, justice, equitable cooperation and acceptable inequality for poor and rich countries to manage and protect environment-in the context of their economic development-as a global environmental challenge. It was concluded that on principles of fairness and equity whatever needs to be done by rich and industrialized countries or by poor and non-industrialized nations about global ecological problems like ozone depletion and global warming, the cost should primarily be borne by the rich and industrialized countries.
Despite these issues, the results of the survey still provide some novel insights into the role Global South countries have to play in the coming decades regarding CE. Particularly, the distinctions between the three countries surveyed serve to illustrate that opinions regarding CE in the Global South are varied and divisive. For example, Nigeria tended to regard GW as a lower threat as compared to Pakistan and Kenya, for two reasons: Nigeria is far less vulnerable to CC, and it is one of the largest oil producing nations in the world. Although calls for CE governance and research are increasing for the Global South, to date the efforts of the scientific community in this arena remain limited. Focusing on all developing continents, including Central and South America, would also shed greater light on the diversity of opinions present in the Global South.

