


 nueva página del texto (beta)
 Inglés (pdf)
 Artículo en XML
 Referencias del artículo
 Enviar artículo por email
 Citado por SciELO
  Similares en
SciELO
Similares en
SciELO 
 Permalink
1. Introduction
NH3 emissions into the atmosphere affect human health, the climate, and ecosystems, due to the formation of secondary aerosols. Despite many studies on the subject, there is inadequate knowledge of agricultural sources (Liu et al., 2022; Luo, 2022; Viatte et al., 2022; Vira et al., 2022; Wang et al., 2022). The increase in global demand for food has caused an increase in the concentration of NH3 produced by dairy farms. Liu et al. (2022) established that the punctual emissions of NH3 from livestock in 2020 ranged between 16.8 and 126.6 kg N ha-1, with an average emission of 42.0 kg N ha-1, with an increasing trend of 5.8% annually between 2008-2020, mainly in spring and summer. From 2008 to 2018, there have been significant increases in global NH3 emissions in India at 13%, tropical Africa at 33%, and South America at 18% with the intensification of agricultural activity (Luo et al., 2022).
It is essential to determine the concentration and distribution of gas emissions such as NH3, which is of increasing importance due to its effect on the health and productivity of animals and workers (Chmielowiec-Korzeniowska et al., 2018; Qin et al., 2020; Tabase et al., 2020; Zhang et al., 2020, 2022; Kim et al., 2022). NH3 emissions depend on the design and operation of the barn, as well as manure management (Heidarzadeh et al., 2022). Computer models to simulate the generation and dispersion of gases within the stables constitute an effective strategy for contaminant mitigation.
Computational fluid dynamics (CFD) is a versatile technique in those multiple areas of knowledge that have contributed to a comprehensive understanding of the complexity of biological systems and had relevance since the end of the 20th century (Rong et al., 2016; Ben, 2021). CFD became a tool by combining the fundamentals of physics, chemistry, and biology (Ivanov et al., 2022). Currently, it is possible to couple CFD to systems based on artificial intelligence (Bournet and Rojano, 2022; Xin et al., 2022).
CFD simulations investigate and evaluate geometric and seasonal effects on natural ventilation and pollutant transport (Vieira and Soriano, 2020; de Masi et al., 2021; Iqbal et al., 2021; Bovo et al., 2022). The NH3 mass transfer coefficient depends on airflow patterns related to ventilation systems and facility geometry (Rong and Aarnink, 2019; Gautam et al., 2021; He et al., 2022). Further analysis and examination of CFD results could help decrease emissions and increase performance (Ivanov et al., 2022).
Osorio (2016) developed a CFD model to predict the distribution of NH3 concentration and its mass flow within facilities from different inlet directions. Drewry et al. (2018) simulated methane, NH3, and heat generation and transport with a steady-state CFD model. These studies have collaborated in the design of more efficient ventilation systems.
According to Coulombe et al. (2020), Cheng et al. (2021), and Pakari and Ghani (2021), ventilation is improved through careful analysis of the position of structures and their effects on airflow patterns. The best performance of the airflow speed is achieved at levels of 2.5 m s-1 and a maximum temperature of 308º K, maintaining relative humidity (RH) between 60 and 75% and CO2 and NH3 concentrations within the tolerable range inside (Doumbia et al., 2021a; Chen, 2021; Ahmadi et al., 2022).
The air exchange rate is directly related to the rate of gas emission and animal welfare. After running several CFD simulations, Doumbia et al. (2021b) identified the quantitative relationships between the length/width ratio of the barn, the configuration of the lateral opening, the temperature, magnitude, and the incoming direction of the airflow, concluding that temperature is the main parameter of influence.
An indication of the dispersion of atmospheric pollutants is the smell of polluting emissions. Using a CFD model developed by themselves, Yeo et al. (2020) demonstrated that the odor dispersal distance of odor unit (OU) m−3 ranged from 129.7 to 1488.1 m depending on factor changes, being wind speed the most influential. However, this work does not indicate the height that this dispersion reaches.
Currently, artificial intelligence algorithms in CFD models achieve accurate computational predictions. Chung et al. (2022) proposed a CFD model based on machine learning to design dairy farms, using a neural network to reduce the prediction time. Huang et al. (2022) used neural networks to determine the inlet angle. Other artificial intelligence algorithms, such as K2, can help establish relationships between the concentration of NH3 and environmental factors in terms of uncertainty.
NH3 emissions simulated using the Agricultural Nitrogen Flow (ANF) method for livestock manure management, is a source of NH3 to be considered. Cool, humid conditions are not favorable for NH3 volatilization. On the other hand, alkaline environments reduce aerosol uptake and NH3 removal, making dry depositions the dominant removal pathways. The patterns in the concentration of atmospheric NH3 are affected depending on environmental factors (Vira et al., 2022).
According to Vira et al. (2022) and Wang et al. (2022), livestock waste and fertilized soils are the highest sources of NH3 emissions. Temperature and moisture drive NH3 emissions. The differences between simulations occur in regions with sparse data. However, these inventories do not capture the impact of meteorological variability on emissions. Also, AFN simulations cannot couple emissions to biogeochemical cycles and their changes with climatic factors.
Viatte et al. (2022) found that temperature is associated with increased atmospheric NH3 concentrations with a coefficient of determination of 0.8 over agricultural areas. The highest concentrations of NH3 are associated with air masses.
Pollution from the dispersion of NH3 is an issue of growing importance due to its implications for health and food production. There are numerous studies on the dispersion of NH3 through the use of various technological methods, in which public data from freely accessible platforms tend to be used, mainly due to the ease and speed of data acquisition, although such data are not yet available for low-technology regions. This work aimed to evaluate the distribution of the NH3 flow within a barn using CFD modeling and its relationship with environmental conditions through probabilistic analysis using the K2 algorithm.
2. Materials and methods
This work focused on the distribution of atmospheric NH3 in a semi-open barn with natural ventilation, located in the region of La Laguna, Mexico, whose geographical coordinates are 25º 41' 57'' N, 103º 20' 22'' W at 1120 masl, considering the maximum temperatures recorded during the period from June 15 to 22, in a region characterized by warm climatic conditions during the summer, which cause greater environmental pollution.
The stable components were modeled in 3D using Ansys Geometry v. 14.0 (commercially available) to obtain the mesh of the modeled objects. The same software tool made it possible to set boundary conditions. Finally, the Ansys Fluent software (also commercially available) simulated natural ventilation (Table I). The initial conditions (wind speed, maximum temperature, and humidity) were taken from the corresponding records from June 15 to 22 of the years 2018, 2019, and 2020 from the nearest meteorological station, El Cuije, located at a distance of 1033 m from the stable (25º 41’ 24” N, 103º 20’ 22” W).
Table I Boundary conditions and initial values of the CFD model.
| Solution | 3D simulation | Double precision |
| Model type | Steady-state | |
| Mesh type | Automatic patch | Conforming/sweeping |
| Minimum element size | 0.2 m | |
| Number of elements | 1652901 | |
| Viscosity | K-e with buoyancy | |
| Energy equation | Active | |
| Domain entry | ||
| Velocity inlet | 0.15 m s-1 | |
| Turbulent kinetic energy | 1.0 J | |
| Air temperature (315 ºK) | ||
| NH3 concentration | 100% | |
| RH | 100% | |
| Domain exit | Outlet pressure | 1.0 Pa |
| Kinetic energy | 1.0 J | |
| Solar radiation | 900 W m-2 | |
| Diffuse solar radiation | 400 W m-2 | |
| Solar calculator | Active | |
| Material physical properties | Air | Soil |
| Density (kg m3) | 1.22 | 1400 |
| Specific heat of the air (J kg-1 K-1) | 1006.43 | 1738 |
| Thermal conductivity (W m-1 k-1) | 24.2 e-3 | 1.5 |
| Coefficient of thermal expansion (K-1) | 3.389 e-3 | |
| Airborne gases | NH3 | Water steam |
| Thermal conductivity (W m-1 k-1) | 0.0454 | 0.0454 |
| Viscosity (kg m-1 s-1) | 1.72 e-5 | 1.72 e-5 |
| Mass diffusivity (kg m-1 s-1) | 2.88 e-5 | 2.88 e-5 |
| Thermal diffusion coefficient (kg m-1 s-1) | -8e-6 t + 6 e-5 | -2.5 e-3 + 0.13 |
The proposed methodology to develop the CFD comprised three stages:
Continuous flow discretization: field variables consisted of a finite number of values at points called nodes.
Discretization of the equations of motion based on the values of the nodes.
System solution of algebraic equations and obtaining the values of the variables in all nodes.
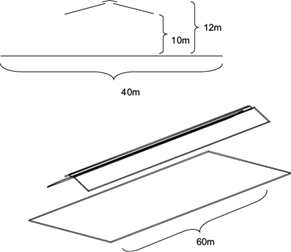
The barn was 60 m long and 40 m wide, and the height was 10.8 m at the eaves and 12 m at the top (Fig. 1). The longitudinal axis of the stable is in an east-west direction, and three sides are completely open, in boundary conditions of 80 m long by 80 m wide and 40 m high.
From the CFD model, a sample of 11 952 records was taken in a vertical plane at a distance of 40 m from the domain entrance (half the length of the barn), with data on temperature, NH3 concentration, RH, and height with which a database was created and discretized in five intervals for each variable (300-315 ºK, 0-100% NH3 and RH, and 0-40 m of height).
The variables were defined in a discrete domain, and the functional relationships described the causal inferences expressed in terms of conditional probabilities (Eq. [1]) using the the K2 algorithm, which is most common machine learning method (de la Torre-Gea et al., 2014).
where πi is a data set of NH3 of node x i ; q i = |φi|; φi is the list of all possible instantiations of the variables of x i in database D, that is, if p 1 , .. , p s are the parents of x i , then φi is the Cartesian product {v p1 1, . . . , v p1 rp1}x . . . x{v ps 1, . . . , v ps rps} of all the possible values of attributes p 1 through p s ; r i = |V i |; V i is the list of all possible values of the attribute x i ; αijk is the number of cases in D in which the attribute x i is instantiated with its k th value, and the variables of x i in πi with the j th instantiation in φi; and N ij = αijk, that is, the number of instances in the database in which the variables of x i in πi is instantiated with the j th instantiation in φi.
3. Results
The highest concentration of NH3 occurs in the center of the barn at 0.1 m height, where the NH3 mass (%) depends on the airflow patterns related to ventilation systems. These results agree with results obtained by Rong and Aarnink (2019), Gautam (2021), and He et al. (2022).
According to studies previously cited by Doumbia et al. (2021a), the highest concentration of NH3 was found at 315º K, being the main influencing factor on the concentration of the gas. The maximum temperature of 308º K improves environmental conditions and significantly reduces the dispersion of NH3, as indicated by Doumbia et al. (2021b), Chen et al. (2021), and Ahmadi et al. (2022).
On the other hand, the highest concentration of NH3 was obtained in conditions of 0 m s-1 air speed due to the stagnation of the pollutant. Therefore, levels of only 0.48 m s-1 decrease the concentration of NH3 by 13%, improving the environmental conditions, as pointed out by the previously cited works (Doumbia et al., 2021a; Chen et al., 2021; Ahmadi Babadi et al., 2022).
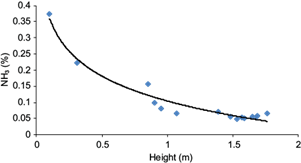
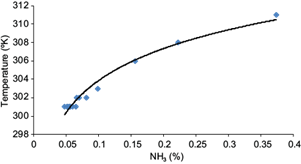
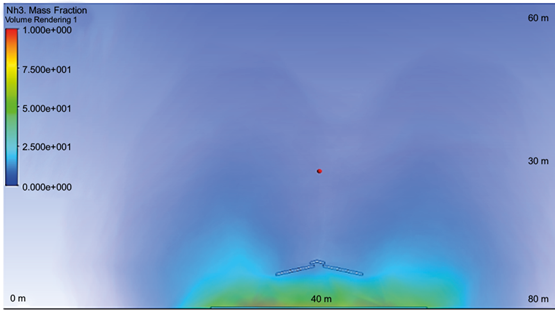
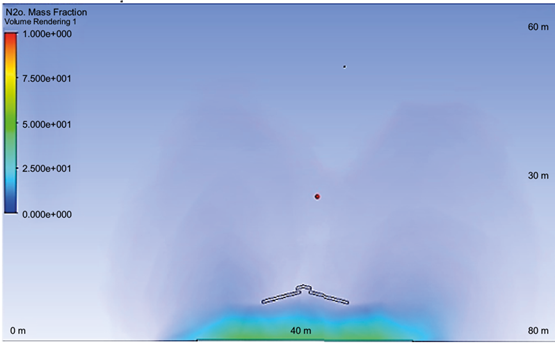
NH3 emissions generate from the limit layer of 0.1 m without airflow. Figures 2 and 3 show the decrease in the pollutant as its dispersion increases towards the highest layers and wind speed. On the other hand, the temperature gradient varies as a function of height, causing a decrease in NH3 (Fig. 4).
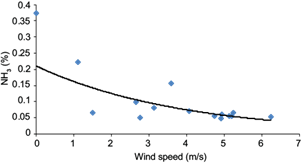
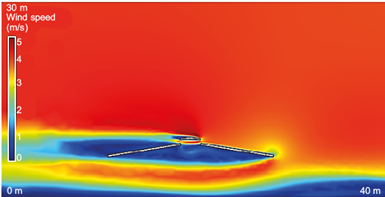
Wind speed is an important factor in the distribution of NH3 concentration. Figure 5 shows the effect of the eaves of the barn on the airflow, causing vertical stagnation zones between 0 to 5 m above and 10 to 12 m below the eave.
3.1 Impact of temperature over NH3
High concentrations of NH3 were observed at different sites that present a positive correlation with temperature (Fig. 4), which is an essential parameter to determine atmospheric levels by volatilization. Furthermore, a vertical trajectory CFD was used to evaluate the impact of long-range transport on the spatial distribution, as shown in Figures 6 and 7, where 75% of the NH3 concentration was found between 0 and 5 m of height, and the remaining 25% was found between 10 and 20 m of height outside the eaves. After a height of 8 m, moisture is lost due to dry climate
3.2 Analysis using the K2 algorithm
Temperature and wind speed are associated with increasing NH3 concentrations, in agreement with Viatte et al. (2022). However, the highest concentrations of NH3 are associated with humidity in the central part of the stable, as shown in Table II. When a concentration of 0.5% NH3 at 298º K temperature and 0 m s-1 air velocity was considered, 90% of the NH3 concentration was found at 0 m of height with 0.5% humidity, that is, on the wet surface.
Table II Probabilistic analysis using the K2 algorithm.
| X (m) | Y (m) | Z (m) | H2O (%) | NH3 (%) | Temperature (ºK) | Wind speed (m s-1) | |
| 55 | 0.1 | 55 | 0.37 | 0.37 | 310.7 | 0.0 | |
| A posteriori | 0.79 | 0.26 | 0.77 | 0.98 | 1.0 | 0.25 | 0.32 |
The approximation of the CFD model analyzed with the K2 algorithm showed that the NH3 concentration is related to humidity, temperature, and wind speed, whose gradients depend on height. Similarly to the studies carried out using CAM-chem and Fourier transform infrared spectrometry by Vira et al. (2022) and Wang et al. (2022), NH3 volatilization is greatest when both temperature and humidity increase on the barn surface.
4. Conclusion
This work concluded that temperature and humidity are the main factors influencing the concentration of NH3. The numerical simulation through CFD is a prerequisite for reducing the time and resources to solve a problem. The data obtained on temperature and wind speed fields in the building lead to an improvement of the considered site’s microclimate. Although the studies carried out through CFD are focused on improving the environmental conditions in situ to increase the productivity of stables, they do not refer to determining the environmental impact of NH3 emissions into the atmosphere. However, these models are very accurate and allow for 3D modeling of pollutant dispersion. On the other hand, the data obtained from satellite data acquisition platforms provide a starting point to visualize the dispersions into the atmosphere. Satellite recoveries offer an alternative data source for NH3 emissions assessment. However, due to the lack of satellite data in many parts of the world, it is essential to mention that the relationships between NH3 and temperature obtained by CAM-chem and Fourier transform infrared spectrometry are similar to those obtained by CDF.

