nueva página del texto (beta)
 Inglés (pdf)
 Artículo en XML
 Referencias del artículo
 Enviar artículo por email
 Citado por SciELO
  Similares en
SciELO
Similares en
SciELO 
 Permalink
1. Introduction
The satellite-based Normalized Difference Vegetation Index (NDVI) is commonly used as an indicator of vegetation growth and health. While it is difficult to relate the NDVI values to individual vegetation types (Scheftic et al., 2014), it is possible to relate the NDVI to vegetation characteristics, such as vegetation cover, their density, and photosynthetic activity (Thenkabail et al., 2000). NDVI is widely used to monitor vegetation changes (Lyon et al., 1998). The study of NDVI changes can reveal how vegetation responds to various climatic factors, such as temperature and precipitation, and has the potential to provide insights into the impact of climate change on vegetation dynamics. Some studies have identified global trends in NDVI (Chen et al., 2019); nevertheless, there are few precedents of NDVI variability in Mexico, usually only linked to specific regions (Salinas-Zavala et al., 2002).
Near-surface air temperature and precipitation influence the NDVI values (Ichii et al., 2002; Zhao et al., 2018; Chen et al., 2019). Several authors have identified high correlations between NDVI and air temperature (Xu et al., 2014; Bagherzadeh et al., 2020; Linscheid et al., 2020). Precipitation and temperature are essential factors in determining vegetation growth and distribution, as they affect the local energy balance and the availability of water and resources that are crucial for plant growth. Notably, the relationship between precipitation, temperature, and vegetation is challenging and can vary depending on factors such as physiography, latitude, and climate oscillations. The type and distribution of vegetation can have a significant impact on land-atmospheric feedback affecting regional precipitation patterns and intensity, as well as temperature conditions. For example, vegetation can act as a source of moisture for the atmosphere influencing precipitation systems. Additionally, vegetation can also affect the surface energy balance, influencing temperature conditions through processes such as evapotranspiration. Some studies have argued that changes in local and regional vegetation (e.g., deforestation, expansion of urban areas) have introduced changes in the spatial patterns of precipitation and intensity (Hilker et al., 2014; Devaraju et al., 2015; Green et al., 2017; Spracklen et al., 2018; Rojas et al., 2019).
Temporal analysis of the NDVI provides insight into the evolution of vegetation characteristics and their possible changes (e.g., spatial extent, health). Due to the connection among precipitation, temperature, and NDVI, it is reasonable to assume that it is possible to identify an interrelation between structural changes in the time series of precipitation and temperature and the changes in the NDVI. Furthermore, it is necessary to estimate the importance of the rainfall and air temperature contribution to potential changes in the NDVI. This study analyses the time evolution of the NDVI over Mexico and explores links with large-scale factors that can modulate air temperature, precipitation, and NDVI. Determining structural change-points in NDVI and precipitation time series provides an opportunity to identify interactions and unravel the different influencing factors. This study, which is based on a regional analysis of Mexico, aims to explore the relationship between NDVI, precipitation, and air temperature. The goal is to identify the factors that influence these variables by estimating the correlation and predictive importance of precipitation and air temperature in the potential structural changes of NDVI.
2. Data and methodology
2.1 Datasets
The daily precipitation dataset Climate Hazards center InfraRed Precipitation with Station data (CHIRPS) was selected for this study (Funk et al., 2015). CHIRPS is a near-global product developed combining satellite imagery with in-situ observations from surface stations, spanning from 1981 to near-present, gridded at 0.05º (1/20º) of resolution, and freely available to download from the CHIRPS 2.0 website (USGS, n.d.). This dataset has been used in previous studies in Mexico (Díaz-Esteban and Raga, 2018, 2019; Perdigón-Morales et al., 2018; Morales-Velázquez et al., 2021), Colombia (Díaz and Villegas, 2022), Brazil (Sikora de Souza et al., 2021), and Venezuela (Paredes et al., 2016). While rain estimation from cloud top temperature introduces uncertainty and suffers from biases in complex terrain (Funk et al., 2015), it provides an accurate description of rain patterns and useful information in areas with a low density of stations.
For comparison purposes, the LIVNEH dataset was also used, which is a hydrometeorological data set for North America, spanning from 1950 to 2013 at 1/16º of resolution (Livneh et al., 2015), freely accessible from the LIVNEH website (NOAA-PSL, 2019). Analyses performed with these two datasets showed some differences in magnitude and spatial distribution due to different data sources and processing (see the supplementary material [SM]). LIVNEH was created with land-station data and adjusted for topographic effects using an elevation-aware precipitation climatology, while CHIRPS blends station data with satellite information. LIVNEH benefits from the accuracy of station data, but its grid quality depends on the density and spatial distribution of stations. As the CHIRPS database starts in 1981, we selected for this study a 30-year period (1984-2013) in which both datasets overlap. Figure 1 shows that the differences were found mainly in the mountainous regions in southern Mexico for the daily precipitation average and for the 99th precipitation percentile. Nevertheless, both datasets report general agreement in the different regions, providing support to the results of this study.
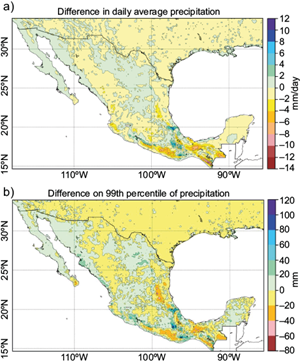
Fig. 1 Comparison of CHIRPS and LIVNEH datasets for the period 1984-2013. Values correspond to the difference (CHIRPS - LIVNEH) for the May-October season, for (a) daily mean precipitation, and (b) 99th precipitation percentile.
The average and several percentiles of the daily precipitation values over the rainy season, from May through October, were calculated for each of the regions determined by the cluster analysis (described in section 2.2). We present here only the time series of the mean and the 99th percentile.
The mean daily air temperature, defined as the average of minimum and maximum daily temperatures, is obtained from TerraClimate (Abatzoglou et al., 2018), which is a high spatial resolution global dataset of monthly climate and surface water balance data over the period 1958-2015 at a spatial resolution of 1/24º. The spatiotemporal aspects of TerraClimate are validated against station data and constitute an improvement relative to coarser resolution gridded datasets (Abatzoglou et al., 2018).
Climatologies over 1984-2013 for CHIRPS precipitation (Fig. 2a) and TerraClimate air temperature (Fig. 2b) show clearly defined areas, suggesting a strong climatological regionalization based on both variables, consistent with the climatic regions identified by García (2004).

Fig. 2 Climatology for the period 1984-2013. Maps correspond to the average of mean daily values for the May-October season. (a) Mean daily precipitation, (b) mean daily air temperature.
The Earth Science Data Records for Use in Research Environments (MEaSUREs) project (NSIDC, 2018) offers an NDVI product of global gridded time series with a spatial resolution of 0.05º. A cross-sensor NDVI continuity series has been developed combining observations from the Advanced Very High-Resolution Radiometer (AVHRR) and the Moderate Resolution Imaging Spectroradiometer (MODIS) instruments (van Leeuwen et al., 2006), allowing the analysis of time series over extended periods. MEaSUREs recommend these time series for historical and climate applications. For our purposes, monthly time series were selected and averaged over the rainy season to obtain annual values, providing information on inter-annual variability. Time series were calculated for each of the regions determined by the cluster analysis (described in section 2.2).
For each region, we evaluate temperature and precipitation modulation by large-scale oscillations. To this end, we select three widely used climate indices: (i) Atlantic Multidecadal Oscillation (AMO) index (Enfield et al, 2001), (ii) Multivariate ENSO Index (MEI V2) (Wolter, 1987), and (iii) Pacific Decadal Oscillation (PDO) index (Mantua, 2002). The monthly time series of these climate indices were downloaded from the Atmospheric and Ocean Time-Series of Climate Indices provided by National Oceanic and Atmospheric Administration (NOAA) Climate Prediction Center (CPC) and available from the CPC website (NOAA-PSL, 2018).
Time series of NDVI, precipitation, and air temperature were generated for each region by spatially averaging and normalizing by the area in each region. The time series consisting of annual values during 1984-2013 were obtained by averaging daily values over the May-October season.
2.2 Spatial regionalization
Numerous factors determine the ecoregions, including physiography, latitude, and the link between precipitation, temperature, and vegetation type. Based on the spatial distribution of precipitation, temperature, and NDVI we propose a coherent regionalization methodology to identify possible changes in climatic variables patterns and NDVI that considers the large climate variability over Mexico. The goal of the regionalization is to obtain identifiable areas differentiated by climatology and vegetation; therefore, the variables used to create the regionalization of Mexico consist of the average for the period 1984-2013, for the daily precipitation, the temperature and NDVI. We believe that these averaged values provide a good reference for a clustering algorithm by removing their natural temporal variability and provide a more homogeneous spatial distribution.
The regionalization was obtained using the density-based spatial clustering of applications with noise (DBSCAN) non-parametric algorithm (Ester et al., 1996; Sander et al., 1998). The DBSCAN clustering algorithm is one of the most used and cited in scientific literature (Duan et al., 2007). DBSCAN is well suited for finding clustering patterns in the physical space, can deal with noise, is robust to outliers and is efficient in finding arbitrarily shaped clusters. Unlike other clustering algorithms, such as K-means, it does not require a priori specification of the number of clusters in the dataset, thus reducing subjectivity into the clustering process. Difficulties associated with the sensitivity of DBSCAN to tuning parameters are discussed in the SM.
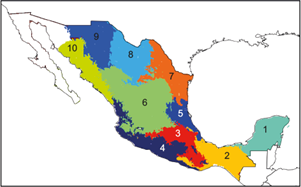
Figure 3 shows 10 regions resulting from the DBSCAN clustering algorithm, which are consistent with previous cluster analysis performed for Mexico (Englehart and Douglas, 2002). Note that the most northwestern region of Mexico is not considered, as the period studied corresponds to the rainy season from May to October. The rainy season in Baja California occurs from October to April, with most of the rainfall observed in January and February (Cavazos, 1999).
2.3 Non-parametric predictive algorithm analysis
The relationship between variables is often evaluated by calculating mutual correlations. However, these correlations do not necessarily imply causality and are most effective in identifying linear relationships. In contrast, explainable-based features can provide useful information about the strength of the relationship between variables, even in the presence of complex non-linear relationships. In this study, we complement standard Pearson correlation analysis with a classification and feature selection algorithm that allows us to determine the explainable importance of selected variables as predictors.
The correlation between NDVI, precipitation, and temperature can vary depending on the specific location and period being studied. Generally, NDVI is positively correlated with precipitation and the standard deviation of precipitation. However, many studies have found a lack of correlation and even negative correlations between NDVI, air temperature, and the standard deviation of temperature, so that further research is needed to understand the relationship between NDVI and air temperature. To address these uncertainties and complexities, we focus on predictability rather than correlation as a measure of the influence of the studied variables on NDVI.
This study uses the Random Forest algorithm to better assess the explainability of the relationship between variables. Random Forest is a non-parametric machine learning algorithm that can handle non-correlated variables and complex non-linear relationships between them. It is commonly used for feature selection and classification (Tang et al., 2014; Li et al., 2017). Other feature selection methods, such as principal component analysis or partial least squares regression, cannot explicitly describe the relevance of a feature. The Random Forest algorithm is robust and able to determine the predictive importance of input variables relative to the output (Guyon and Elisseeff, 2003; Tang et al. 2014). The algorithm creates an ensemble of decision trees with random structure; each tree makes individual predictions for a different sample of features. The overall prediction is an average of the predictions produced by all the trees in the forest.
Random Forest has been used successfully in the classification of vegetation, land use, and ecological regions (Gislason et al., 2006; Rodríguez-Galiano et al., 2012; Grinand et al., 2013). Its ability to function as a feature selector allows for the estimation of the variable’s impact on the region’s properties. Therefore, it is a valuable tool to study the strength of the variable’s interconnection. The estimated relative importance of temperature and precipitation over the NDVI values, allow us to explore the possible link among the changes of such variables and the changes of NDVI.
2.4 Structural change-point analysis
Time series of meteorological variables can often show abrupt changes in their behavior. In this work we attempt to detect such changes using change-point detection tests and explore their causes as a link between NDVI, air temperature and precipitation. To do so, a spatially averaged time series of those variables was created for each region identified in Figure 3.
Change-point detection methods are statistical techniques used to identify the point in time where a significant structural change occurs in a time series data. However, the uncertainty associated with these methods can be substantial, particularly when the data is noisy, or the change is small. This can lead to incorrect detections or missed changes, which can also vary from one method to another. For this reason, we use the combination of two well established change-point detection methods proposed by Mann (Mann, 1945), Kendall (Kendall, 1975), and Pettitt (Pettitt, 1979). By comparing their results, it is possible to gain a more complete understanding of the underlying process and increase the likelihood of correctly detecting changes.
The Mann-Kendall and Pettitt algorithms are widely used to detect change-points in time series data. Both methods are based on non-parametric statistics, which makes them robust to outliers and distributional assumptions and have been shown to have good performance in detecting change-points in time series. These tests are commonly used to detect change-points in time series of meteorological variables (Sneyers, 1990). In interpreting the results, it is important to consider the following. The structural change-points detected with the combined application of both statistical tests will not necessarily be associated with a single year. They could be interpreted as a change occurring within a time interval around the identified year. To compare a change-point pair, ±2 years are considered an acceptable period. The values derived from these tests are significant for p-values ≤ 0.05. To discuss the relationship between variables, only the regions with significant change-points are considered.
3. Results and discussion
3.1 Structural change-points in NDVI
Table I shows the detected structural change-points for the time series of NDVI, mean precipitation value (pmean), 99th precipitation percentile (p99), and mean air temperature (tmean) for each of the regions indicated in Figure 3. Significant change-points in NDVI (shown in bold font) are found in regions 1 through 6, corresponding to southeast, south, and central Mexico. This group of regions includes those with higher annual rainfall and temperature (Fig. 2), with correspondingly denser vegetation. Table I also indicates that northern regions 7 and 8, with scarce vegetation (Pérez-García et al., 2012), do not show significant change-points in NDVI over the selected 30-year period.
Table I Structural change-points in the time series for each region*.
| Regions | NDVI | p99 | pmean | tmean | ||||||||||||
| Pettitt | Mann -Kendall | Pettitt | Mann -Kendall | Pettitt | Mann -Kendall | Pettitt | Mann -Kendall | |||||||||
| Year | p -value | Year | p -value | Year | p -value | Year | p -value | Year | p -value | Year | p -value | Year | p -value | Year | p -value | |
| 1 | 2001 | 0.0001 | 2002 | 0.0001 | 1994 | 0.04 | - | 0.01 | 1994 | 0.3 | - | 0.1 | 2000 | 0.0001 | 2003 | 0.0002 |
| 2 | 2002 | 0.0002 | 1999 | 0.0003 | 1997 | 0.05 | 1998 | 0.02 | 1994 | 0.1 | - | 0.1 | 1996 | 0.0001 | 1997 | 0.0001 |
| 3 | 2001 | 0.0001 | 1999 | 0.0001 | 1997 | 0.0006 | 2005 | 0.0001 | 1997 | 0.04 | - | 0.01 | 1994 | 0.001 | - | 0.0002 |
| 4 | 1995 | 0.01 | 1995 | 0.1 | 1994 | 0.2 | - | 0.07 | 1994 | 0.3 | - | 0.4 | 1993 | 0.01 | 1989 | 0.005 |
| 5 | 2002 | 0.01 | 2003 | 0.07 | 1997 | 0.04 | - | 0.007 | 2006 | 0.4 | - | 0.5 | 1994 | 0.01 | 1987 | 0.04 |
| 6 | 2001 | 0.05 | - | 0.3 | 2001 | 0.01 | 2002 | 0.01 | 1991 | 0.5 | - | 0.7 | 1993 | 0.01 | - | 0.03 |
| 7 | 2002 | 0.08 | - | 0.3 | 2001 | 0.06 | 1997 | 0.04 | 2001 | 0.4 | - | 0.9 | 1993 | 0.04 | - | 0.1 |
| 8 | 2010 | 0.4 | - | 0.6 | 2002 | 0.2 | - | 0.3 | 1991 | 0.06 | 1988 | 0.4 | 1993 | 0.001 | 1993 | 0.002 |
| 9 | 2004 | 0.4 | - | 0.3 | 1991 | 0.09 | - | 0.8 | 1991 | 0.2 | - | 0.2 | 1993 | 0.0004 | - | 0.0001 |
| 10 | 2009 | 0.5 | - | 0.6 | 1991 | 0.5 | - | 0.6 | 2002 | 0.6 | - | 0.7 | 1993 | 0.001 | 1992 | 0.0001 |
*Years in bold are indicative of significant values.
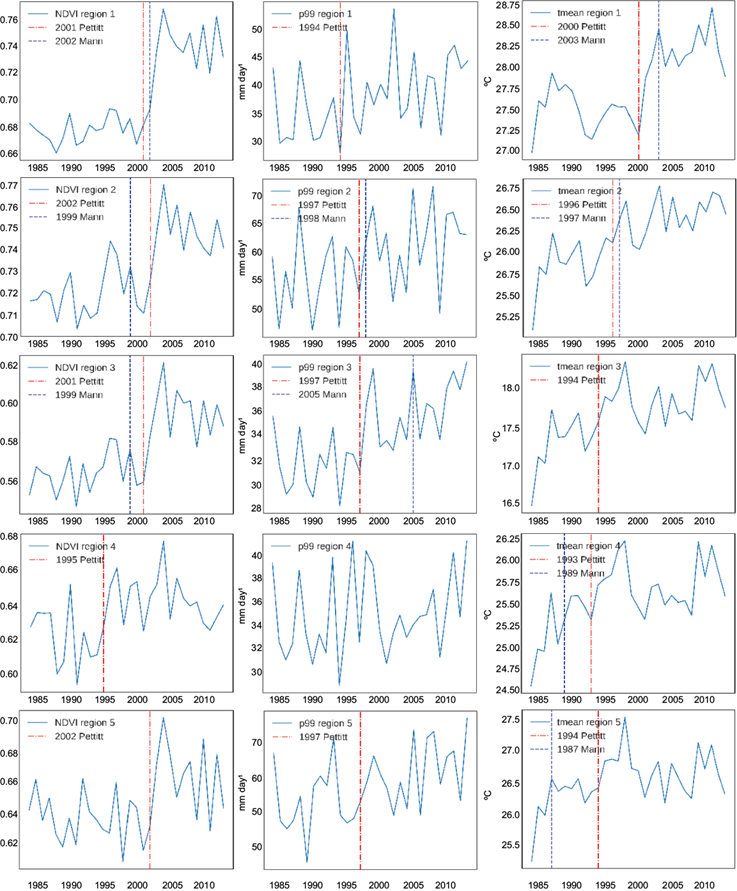
Most of the significant change-points for NDVI, detected by the Pettitt test in regions 1, 2, 3, 5, and 6 occur from 2001 to 2002, while for region 4 it only occurs in 1995. On the other hand, the Mann-Kendall test yields significant change-points only for region 1 in 2002, while regions 2 and 3 for 1999, all located in southern Mexico. This result suggests that time-series changes of regions 2 and 3 may correspond to different kinds of structural change-points. For region 4, in contrast to Pettitt, the Mann-Kendall test shows non-significant change-points in 1995. The presence of identifiable inflection points for regions 1, 2, 3, 5, and 6 within the years 2001-2002 with a ±2-year interval could be indicative of the influence of large-scale phenomena on vegetation.
The consistency of change-points detection is noteworthy for regions 1 and 5 due to the coincidence of results for both Pettitt and Man-Kendall tests. This result suggests a substantial structural change has been produced in the time series of NDVI around 2001-2002 for those regions.
Figures S5 and S6 in the SM show the time series for each region. Note that after the significant structural change-points, there is an increase of NDVI, and this happens in relatively large areas corresponding to the selected regions. Such large areas suggest that those changes are not attributable to deforestation or similar human activities.
3.2 Precipitation and structural change-points in NDVI
Table I shows that in region 3, an area with high annual precipitation values in Mexico, the average daily precipitation time series has a single significant structural change-point in 1997. This is expected as the average precipitation time series in each region is largely modulated by the seasonal cycle of wet and dry periods. Usually the detection of a change-point in the average precipitation suggests a significant alteration in the circulation patterns that govern the rainy season. Although such large changes in regional circulation can occur, they may not be detected as significant by the used statistical tools in all regions. The average precipitation, being influenced by both moderate and extreme precipitation events, may not be as sensitive to changes in climate or local conditions as the 99th percentile of precipitation, which is a metric associated with extreme rainfall events. Murray-Tortarolo (2021) reported that in Mexico the precipitation trend indicates an increase in the wet season - with higher rainfall amounts and extreme weather frequency and no significant changes in the dry season. As a result, it may be easier to detect significant change-points of the 99th percentile of precipitation.
The results of the Mann-Kendall and Pettitt tests applied to the 99th percentile of precipitation time series are also presented in Table I. Note that in regions 1 and 5, the significant change-points in extreme precipitation do not align with the change-points of NDVI; change-points detected in the NDVI time series were several years apart from those in extreme precipitation. Furthermore, the period 2001-2002 shows structural change-points in NDVI that are related to an increase in both the trend and the mean value of the NDVI time series. This behavior cannot be easily attributed to the influence from either the mean precipitation or the 99th precipitation percentile (Figure S6 in the SM). It therefore suggests that changes in the NDVI behavior in regions 1 and 5 are not related to changes in precipitation and may be influenced by other factors.
In regions 2 and 3, change-points in the 99th percentile of precipitation for 1997-1998 are close to the NDVI change point in 1999. However, the Pettitt test only detects NDVI change-points in 2001-2002. This suggests separate, abrupt changes in 1997-1998 and 2001-2002. Additionally, region 3 shows a change-point in average precipitation in 1997, indicating significant changes in precipitation patterns in this region. These observations indicate that the relationship between NDVI and precipitation in regions 2 and 3, where both changed around 1997-1998, could be a result of large-scale circulation influence.
Table I shows that the presence of significant change-points in regions 1, 2, 3, and 5 suggest a large-scale influence that is responsible for a coherent change across several regions. This change is influenced by various factors such as tropical waves, the inter-tropical convergence zone, and tropical cyclones, as noted by Englehart and Douglas (2001). Additionally, the significant change-points in extreme precipitation and NDVI in region 6 in 2001-2002 suggest a relation between the two, indicating that they may be related to the occurrence of specific phenomena.
3.3 Air temperature and structural change-points in the NDVI
Table I also displays the results of structural change-point analysis for mean temperature time series. The Pettitt test reveals significant change-points in all regions, while the Mann-Kendall test fails to identify any in regions 3, 6, and 7. The comparison between NDVI and temperature reveals coincidences of change-points in several regions. For instance, NDVI in region 1 did not show a relationship with the 99th percentile of rainfall but showed a coincidence with temperature change-points in 2000 and 2003, which may be related to the NDVI change-point in 2001. Additionally, the NDVI change-point in 1999 in region 2 aligns with change-points in air temperature in 1996 and 1997, and the presence of change-points for temperature and 99th percentile precipitation in 1997 and 1998 in this region supports the consistency with the NDVI change-point in 1999. For region 1, the increase in temperature causes a positive water balance (Murray-Tortarolo, 2021), that would be responsible for the increase in NDVI.
Figures S5 and S6 in the SM show that regions 3, 4, 5, and 6 have change-points in air temperature too far apart in time from those detected in NDVI and most likely are not associated with them. Note, however, that the same figures show a positive trend for air temperature over the thirty years for all regions (Murray-Tortarolo, 2021), a similar situation that is observed at a global scale (Estrada et al., 2021), consistent with the anthropogenic global warming.
3.4 Large-scale climate indices and structural change-points in temperature and precipitation
The potential influence of large-scale climate indices on structural change-points in average daily precipitation, the 99th percentile of precipitation, and air temperature is explored by comparing their time series in each of the regions with major climate indices known to affect Mexico, such as the Pacific Decadal Oscillation (PDO) (Díaz et al., 2008), the Atlantic Multi-decadal Oscillation (AMO) (Curtis, 2008), and the El Niño Southern Oscillation (ENSO) (Magaña et al., 2003; Peralta-Hernández et al., 2009; Cavazos and Hastenrath, 1990).
Precipitation climatology in Mexico is impacted by ENSO, with winter precipitation increasing in northwestern regions during El Niño (Cavazos and Hastenrath, 1990), while weak events result in slightly below average precipitation (Pavia, 2015). Central and northeastern Mexico experience little variability in summer precipitation with ENSO phases. Areas of southern and eastern Mexico and the Pacific coast of Central America experience dry conditions during El Niño and wet conditions during La Niña (Magaña et al., 2003; Peralta-Hernández et al., 2009). On an interannual scale, tropical cyclones significantly contribute to local rainfall in coastal regions of the Caribbean and northeastern Gulf of Mexico (Domínguez and Magaña, 2018). AMO and PDO also influence the variability in extreme precipitation (Curtis, 2008; Pavia et al., 2006), with the presence of El Niño favoring wet conditions during the summer under a negative PDO phase and during the winter under a positive PDO phase (Pavia et al., 2006). The positive phase of the PDO is associated with more land-falling tropical cyclones over the Pacific (Raga et al., 2013) and, consequently, with increased annual precipitation in northwestern Mexico (Díaz et al., 2008).
The change-points detected in the yearly climate indices are presented in Table II and Figure 4. Significant change-points (shown in bold font) were detected in 1997 and 2007 for PDO and in 1997 for AMO. ENSO also shows change-points in 1997 and 2007, although they are not statistically significant. However, the important change in PDO in both detected change-points, as well as the similarities in spatial sea surface temperature patterns between PDO and ENSO, may indicate the significance of the 1997 ENSO event. Furthermore, as shown in Figure 4, the intense ENSO in 1997, which was the most impactful for the entire study period, coincided with a notable phase change in AMO and PDO.
Table II Structural change-points for climatic indices time series*.
| Index | Pettitt | Mann-Kendall | ||
| years | p-values | years | p-values | |
| PDO | 1997 | 0.002 | 2007 | 0.001 |
| ENSO | 1997 | 0.1 | 2007 | 0.1 |
| AMO | 1997 | 0.001 | 1997 | 0.0002 |
*Years in bold are indicative of significant values.

Fig. 4 Time series of the climatic indices AMO, PDO and ENSO. Significant structural change-points detected with the Pettitt test are marked with a vertical red dotted line, while the corresponding to Mann test are marked with a vertical blue dotted line. The vertical black line indicates coincidence of both tests.
The connection between change-points observed in regional meteorological parameters and those in large-scale climate indices is investigated, determining the relative importance of each climate index (Figs. S3 and S4 in the SM). This relationship is based on the hypothesis that the behavior of climate oscillations, as represented by their respective climate indices, influences the development of a variable through teleconnections, resulting in the detection of change-points.
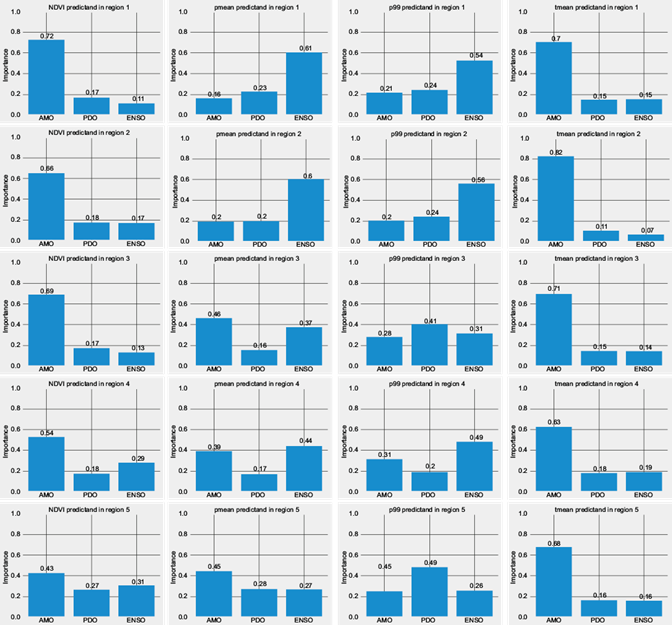
Table I and Figures S5 and S6 in the SM show the presence of structural change-points in extreme precipitation, represented by the 99th percentile, in regions 1, 2, 3, 5, and 7, during the year 1997. This change is reflected in the average precipitation and is consistent with change-points in temperature in region 2 during 1996-1997. An analysis of the relative predictive importance of climate indices for AMO, ENSO, and PDO (presented in Table III), suggests a significant influence of climate oscillations on the behavior of temperature and precipitation in these regions. This relationship can also be observed through the Pearson correlation between each variable and the climate indices, as shown in Table IV. The low correlations and high predictive importance indicate a non-linear relationship among variables that cannot be solely detected through correlation analysis. Thus, for the first time, a direct measure of the relative importance of such influence is introduced.
Table III Predictive importance of climate indices for average precipitation (pmean), 99th percentile of precipitation (p99), and average temperature (tmean) in each region. Values range from 0 to 1, with 1 being the highest relative importance.
| Regions | pmean | p99 | tmean | ||||||
| AMO | ENSO | PDO | AMO | ENSO | PDO | AMO | ENSO | PDO | |
| 1 | 0.13 | 0.62 | 0.26 | 0.13 | 0.66 | 0.21 | 0.69 | 0.14 | 0.17 |
| 2 | 0.16 | 0.69 | 0.16 | 0.14 | 0.71 | 0.16 | 0.85 | 0.06 | 0.08 |
| 3 | 0.39 | 0.45 | 0.16 | 0.2 | 0.44 | 0.36 | 0.82 | 0.08 | 0.1 |
| 4 | 0.3 | 0.49 | 0.21 | 0.27 | 0.54 | 0.18 | 0.73 | 0.13 | 0.14 |
| 5 | 0.54 | 0.3 | 0.16 | 0.29 | 0.27 | 0.44 | 0.76 | 0.04 | 0.2 |
| 6 | 0.38 | 0.37 | 0.25 | 0.53 | 0.3 | 0.16 | 0.5 | 0.21 | 0.29 |
| 7 | 0.35 | 0.43 | 0.22 | 0.46 | 0.31 | 0.22 | 0.31 | 0.3 | 0.39 |
| 8 | 0.33 | 0.25 | 0.42 | 0.35 | 0.34 | 0.31 | 0.31 | 0.1 | 0.59 |
| 9 | 0.57 | 0.11 | 0.33 | 0.24 | 0.45 | 0.31 | 0.52 | 0.11 | 0.37 |
| 10 | 0.52 | 0.31 | 0.17 | 0.26 | 0.33 | 0.41 | 0.67 | 0.13 | 0.20 |
Table IV Pearson correlation coefficient of climate indices time series with average precipitation (pmean, 99th percentile of precipitation (p99), and average temperature (tmean) for each region.
| Regions | pmean | p99 | tmean | ||||||
| AMO | ENSO | PDO | AMO | ENSO | PDO | AMO | ENSO | PDO | |
| 1 | 0.19 | -0.5 | -0.29 | 0.26 | -0.54 | -0.3 | 0.65 | -0.19 | -0.23 |
| 2 | 0.17 | -0.66 | -0.34 | 0.21 | -0.66 | -0.48 | 0.84 | -0.1 | -0.32 |
| 3 | 0.3 | -0.53 | -0.34 | 0.46 | -0.57 | -0.52 | 0.7 | -0.11 | -0.28 |
| 4 | 0.16 | -0.43 | -0.21 | 0.04 | -0.48 | -0.22 | 0.59 | 0.07 | -0.18 |
| 5 | -0.07 | -0.33 | -0.18 | 0.2 | -0.34 | -0.41 | 0.53 | -0.1 | -0.22 |
| 6 | 0.02 | 0.16 | 0.2 | 0.43 | -0.1 | -0.08 | 0.39 | 0.01 | -0.21 |
| 7 | 0.17 | 0.02 | 0.15 | 0.43 | -0.17 | -0.07 | 0.27 | -0.19 | -0.34 |
| 8 | -0.18 | 0.16 | 0.29 | 0.14 | 0.04 | 0.11 | 0.48 | -0.22 | -0.47 |
| 9 | -0.40 | 0.05 | 0.04 | -0.02 | -0.09 | 0.02 | 0.64 | -0.13 | -0.46 |
| 10 | -0.02 | 0.08 | -0.08 | 0.001 | 0.11 | 0.19 | 0.65 | 0.03 | -0.36 |
Table III presents the results of the relative predictive importance analysis of different climate indices on the 99th percentile of precipitation in each region. The findings suggest that ENSO has the greatest impact on the 99th percentile of precipitation in regions 1, 2, and 3, followed by PDO. This can be explained by the fact that ENSO modulates summer precipitation in southern Mexico, which is also connected to PDO. In region 2, a significant change-point in air temperature related to the influence of AMO is observed, as indicated by a high value of importance. In region 5, PDO is found to have the highest predictive importance for the 99th percentile of precipitation, followed by AMO and ENSO. Meanwhile, AMO is found to have the highest importance for the 99th percentile in region 7, followed by ENSO and PDO. The influence of AMO becomes stronger in coastal regions 5 and 7 as one transitions from the tropics to the subtropics. To complement the previous discussion, the Pearson correlation between NDVI and the large-scale oscillations as well as their relative predictive importance are shown in Table V. The AMO is both well correlated and ranks first in predictive importance for regions 1 through 4 (located in southeastern, southern and southwestern Mexico), while ENSO and PDO show both low correlations and predictive role in those regions. In contrast, while correlations between ENSO and NDVI are very low in regions 5 through 8 and 10, the predictive importance ranks first in those regions, indicative of a non-linear relationship between them. PDO ranks second in predictive importance for NDVI in those same regions, again with very low Pearson correlation. Finally, note that all three oscillations have similar predictive importance for NDVI in regions 5 (located in the central coast of the Gulf of Mexico) and 9 (located in northern Mexico).
Table V Pearson correlation coefficient and predictive importance of climate indices relative to NDVI time series for each region.
| Regions | Correlation coefficient | Predictive importance | ||||
| AMO | ENSO | PDO | AMO | ENSO | PDO | |
| 1 | 0.68 | -0.19 | -0.31 | 0.75 | 0.12 | 0.13 |
| 2 | 0.65 | -0.07 | -0.21 | 0.7 | 0.17 | 0.14 |
| 3 | 0.66 | -0.1 | -0.23 | 0.75 | 0.11 | 0.14 |
| 4 | 0.46 | 0.14 | -0.06 | 0.67 | 0.23 | 0.1 |
| 5 | 0.32 | -0.02 | -0.03 | 0.33 | 0.33 | 0.34 |
| 6 | 0.31 | 0.11 | 0.12 | 0.39 | 0.45 | 0.16 |
| 7 | 0.33 | -0.18 | -0.08 | 0.25 | 0.5 | 0.25 |
| 8 | -0.07 | 0.08 | 0.21 | 0.2 | 0.44 | 0.36 |
| 9 | 0.09 | -0.18 | -0.11 | 0.38 | 0.32 | 0.31 |
| 10 | 0.10 | -0.04 | 0.01 | 0.34 | 0.41 | 0.25 |
3.5 Relative explainability of air temperature and the 99th precipitation percentile on NDVI
There is a range of temperatures and water availability that favors the growth of photosynthetic activity for most plants (Bonan, 2015). It is then reasonable to expect a connection between air temperature, rainfall, and NDVI values. Nevertheless, those connections vary as a function of soil and vegetation type (Bonan, 2015). Vegetation in dry areas is more sensitive to water availability, but dense vegetation from humid regions shows a noticeable response to changes in air temperature (Adepoju et al., 2019).
The impact of precipitation and temperature on NDVI is evaluated in this section, following the methodology applied to climate indices in the previous section. The results are displayed in Table VI and Figure S2 in the SM, which shows the relative importance values of each variable as a predictor of NDVI. These values represent the influence of the variable on NDVI behavior. Additionally, Table VI also presents the Pearson correlation coefficients between NDVI and each of the other variables.
Table VI Pearson correlation coefficient and predictive importance of average daily precipitation, 99th precipitation percentile, and air temperature relative to NDVI time series for each region.
| Regions | Correlation coefficient | Predictive importance | ||||
| p99 | pmean | tmean | p99 | pmean | tmean | |
| 1 | 0.06 | 0.09 | 0.85 | 0.26 | 0.14 | 0.71 |
| 2 | 0.08 | 0.12 | 0.8 | 0.2 | 0.18 | 0.56 |
| 3 | 0.42 | 0.13 | 0.45 | 0.38 | 0.26 | 0.39 |
| 4 | 0.28 | 0.31 | 0.41 | -0.06 | 0.29 | 0.22 |
| 5 | 0.25 | 0.32 | 0.43 | 0.26 | 0.2 | -0.18 |
| 6 | 0.38 | 0.51 | 0.11 | 0.41 | 0.54 | -0.28 |
| 7 | 0.41 | 0.33 | 0.26 | 0.54 | 0.56 | -0.47 |
| 8 | 0.2 | 0.36 | 0.44 | 0.55 | 0.64 | -0.61 |
| 9 | 0.21 | 0.43 | 0.36 | 0.32 | 0.33 | -0.17 |
| 10 | 0.30 | 0.32 | 0.37 | 0.39 | 0.43 | 0.01 |
As shown in Table VI, there is a positive correlation between NDVI and air temperature in southern regions and a decreasing correlation as latitude increases, becoming negative in northern regions. The relative importance of air temperature as a predictor of NDVI is higher in regions with high NDVI values such as regions 1 and 2 due to the increase of temperature in those areas, which causes a positive water balance (Murray-Tortarolo, 2021). On the other hand, the correlation between NDVI and precipitation increases with latitude, with higher values in regions with lower NDVI, for example, regions 6, 7, and 8. This suggests that there is a positive correlation and higher importance of temperature compared to precipitation in regions where NDVI values, soil moisture, and water availability are high. This is consistent with previous studies of other authors conducted in different areas that reported a negative correlation between NDVI and temperature in drier zones, while it has a positive association with both precipitation and altitude, showing a greater sensitivity to changes in precipitation compared to temperature and elevation. NDVI was found to decrease at extreme high and low temperatures (Ghebrezgabher et al., 2020; Pan et al., 2019). As expected, in intermediate regions like 4 and 5, the predictive importance and correlations for both precipitation and air temperature have similar influences on NDVI.
Results in Table VI suggest that there is a coincidence in higher predictive importance for variables that show a good agreement among the detected change-points with NDVI. The high correlation and predictive importance of air temperature concerning NDVI in region 1 explain that the coincidence of significant change-points with NDVI at around 2000-2003 corresponds to air temperature and not to precipitation. The high predictive importance of air temperature in region 2 justifies associating the temperature change-point in 1997 with the NDVI one in 1999. Nevertheless, despite the lower correlation and importance of extreme precipitation for this region, the presence of significant change-points for the 99th percentile of precipitation, also in 1997-1998, indicates that an important change in climatic conditions occurred.
In region 3, correlation and importance relative to NDVI are similar for air temperature and the 99th percentile of precipitation, while they are relatively lower for the mean value of precipitation. This behavior allows relating the NDVI change-point in 1999 with the detected change-point in the 99th percentile of precipitation in 1997. For region 4, however, there is an NDVI change-point in 1995 while for the mean and 99th percentile of precipitation the change-point occurs in 1994 , but they are not significant. The higher importance corresponds to air temperature, which shows a significant change-point in 1993, and can be associated with the NDVI change-point for this region.
The results in Table VI suggest that the NDVI change-point observed in region 6 in 2001 is linked to the change-points for the 99th percentile of precipitation, which occurred in 2001-2002. However, the air temperature change-point observed in 1993 does not seem to be related to the NDVI change-point, as it is too far apart and has a low correlation and importance with respect to NDVI in this region.
Finally, note that given this analysis, it is difficult to find an association between the NDVI change-points and other variables in regions 5, 7, and 8. Nevertheless, in regions 3 through 8 there are significant change-points in 1993-1994, which suggest a climatic influence for those regions in that period.
4. Conclusions
Despite the complexity of the interaction between climate variables and vegetation, the combined use of predictive importance, correlations, and change-point detection provides a novel approach to study local changes of NDVI in Mexico. While climate regionalization in Mexico had been previously conducted by other authors using data from surface stations, the combination of the use of the DBSCAN algorithm and gridded climate variables provide a more consistent clustering of the climatic regions. The detection of structural change-points for climatic variables and NDVI is unprecedented in Mexico. The utilization of relative importance as a quantifiable measure to explain the interrelations among meteorological variables is novel and contributes to the robustness of our methodology.
Region 1 (Yucatan Peninsula) experienced an NDVI change-point in 2001-2002, primarily attributed to changes in air temperature rather than precipitation. In contrast, the significant NDVI change-point observed in 2001-2002 in regions 2, 3, and 5 was not linked to changes in mean precipitation nor air temperature. The NDVI change-point identified in 1999 in region 2 may be associated with changes in extreme precipitation in 1997-1998 and air temperature in 1997. Region 6 had a significant NDVI change-point in 2001, which was related to changes in extreme precipitation. In region 4, the non-significant NDVI change-point identified in 1995 appears to be connected to changes in precipitation in 1994.
The modulation by large scale oscillations - AMO, PDO, and ENSO - on precipitation and temperature in Mexico can be linked to local changes in NDVI in specific regions. Change-points detected in regions 2, 3, 5, and 7 around 1997 coincide with shifts in the phase of AMO and PDO. The most intense ENSO event also triggers the detection of change-points, primarily driven by the influence of AMO.
A limitation of this methodology is that it cannot be applied simultaneously to precipitation over the whole territory of Mexico, because of the different seasonality of precipitation in different regions. Recall that in this study the rainy season is considered between May and October, consistent with most of the territory, but some regions, like northwestern Baja California, have a Mediterranean climate with dry summers and rainy winters, and thus, the region was excluded.
The impact of precipitation and temperature on the NDVI varies depending on the region and vegetation density. Sparse vegetation in drier regions is more affected by precipitation, while dense vegetation with adequate moisture levels has a stronger response to temperature fluctuations. This can be seen in the predictive importance and correlations to NDVI values. However, there are intermediate areas where both precipitation and temperature have a similar impact on NDVI behavior. The connection between changes in variables and NDVI can be identified in some regions. In particular, the increase in NDVI after significant structural change-points suggests that these changes are most likely due to climate forcings rather than deforestation or other human activities, albeit internal feedback can also occur.
By integrating structural change-point analysis of time series of meteorological variables and climate indices, alongside the assessment of each variable’s relative predictive importance, we enhanced our comprehension of their interrelationships and connections. To gain a deeper insight into the complex nature of the climate influence on NDVI, further development of this methodology would include local variables including vegetation and soil type, and soil water content.