


 nueva página del texto (beta)
 Inglés (pdf)
 Artículo en XML
 Referencias del artículo
 Enviar artículo por email
 Citado por SciELO
  Similares en
SciELO
Similares en
SciELO 
 Permalink
1. Introduction
Nivology is the science that studies the physical properties of snow, as well as its recurrence and temporality. It is of great hydrological importance due to its equivalence in liquid water, however, for glaciology and geocriology it is also an important issue. Nivology is widely studied in regions of medium and high latitudes of the planet, where due to their climatic conditions snowfall events are common in certain seasons of the year. In mountain ranges, such as the Alps, for example, its monitoring is important due to the economic, environmental, and social repercussions it represents. There are other areas of the planet where the height of its relief, despite being within the intertropical region, favors snow precipitation, as in the case of Mexico, where this issue is unknown and much less quantified despite the number and altitude of its mountains.
Mexico is a mountainous country with 31 summits exceeding 3000 masl (INEGI, 2017); among them, 10 exceed 4000 masl, the upper limit of the forest (Soto et al., 2021). The combination of factors such as latitude, altitude, and continentality (Farbrot et al., 2011; Hasler et al., 2015) cause the presence of recurrent winter snowfall events in most of these mountain areas. However, due to their higher altitude, Iztaccíhuatl (5220 masl), Popocatépetl (5500 masl), and Citlaltépetl (5610 masl) record snowfall, in particular during the rainy season (June-November). Among these mountains, the first and the third have glaciers. In the northern part of the country (the mountainous regions of the states of Durango, Sonora, Chihuahua, Baja California, and Zacatecas), and the high elevations of the Neovolcanic Axis, there is a regular to very frequent snowfall index; as well as a lower frequency in the peaks of Nuevo León and San Luis Potosí states (Jiménez et al., 2006; Prieto et al., 2021).
There was a growing interest in studying the mechanisms and characteristics of snow during the 20th century (Mellor, 1977) in such a way that, at present, there are manuals throughout the planet for the observation of different snowpack parameters (e.g, Sanz et al., 2015; American Avalanche Association, 2016). This is because the physical characteristics of snow are of great importance for winter sports and associated recreational activities (Fauve et al., 2008), or for the hydric value due to its density and its equivalent volume in liquid water (Judson and Doesken, 2000). Largely, this density, its degree of compaction, and plastic deformation govern its stability on the mountain slopes where it is deposited (Theile et al., 2009) and can be linked to the threat of avalanches. The accumulation over time and its transformation into solid ice acquire great importance for the mass balance of glaciers (Fountain et al., 2017). From an environmental perspective, fluctuations over time in terms of frequency and permanence are clear indicators of current climate variability (Allison et al., 2001; Martin and Etchevers, 2005; Azizi and Asaoka, 2020).
Notwithstanding the above, to date, the equipment and measurements for quantifying precipitation and snow depth are very scarce in high-mountain terrain (Staub and Delaloye, 2017). This snow quantification task becomes even more complex when elements such as precipitation patterns, wind speed, slope of the terrain, and insolation are considered, which altogether contribute to the snowpack getting a very irregular thickness on mountainous surfaces (Gisnås et al., 2014; Soto, 2021).
Snow is considered a semitransparent element, which has a high reflection index (here the refraction effect caused by subsurface snowflakes/ice grains is also considered), and at the same time allows the passing of non-reflected energy up to a certain depth, which depends on the thickness of the snow cover. According to Warren (2019), the albedo of fresh snow reaches 90%, while during the melting stage it is equivalent to 60%; however, ~80% is considered a common value for the reflectivity of solar energy. The maximum albedo is reached with a thickness of fresh snow greater than 20 cm, while for 1 cm thickness it becomes less than 60%. Therefore, ~20% of the remaining energy on the surface of the snowpack will penetrate the snow as part of the surface energy balance, something similar to what happens with the bare ground (Soto and Delgado-Granados, 2019) and with glacial ice (Soto et al., 2019), heating the subsurface and also generating latent and sensible heat fluxes at the snow-air interface.
According to Kokhanovsky (2021), energy penetrating into the snowpack can be absorbed several centimeters from the surface, which is converted into conductive heat transfer that can cause snow to melt from the bottom of the snowpack, despite the existence of negative temperature values in the air (Dombrovsky and Kokhanovsky, 2022). However, for Wiscombe and Warren (1980) the behavior of energy, regardless of its wavelength, depends on the shape and size of the ice crystals it contains (Neshyba et al., 2003). Albedo is much higher at incoming energy wavelengths between 0.4 and 0.5 μm, while as the wavelength increases it becomes smaller until it reaches its minimum level near the threshold of 1.5 μm of wavelength (Warren, 2019).
The heat-insulating effect of snow between the ground surface and the upper air is another important physical property. Due to the high porosity and high air content, especially as fresh snow, it acts as a barrier preventing the temperature effects of the atmospheric boundary layer on the ground’s surface (Pomeroy and Brun, 2001). Its seasonal presence and the thickness of the snowpack are decisive in circumpolar zones for the preservation of permafrost in regions of Siberia and North America, where permafrost is highly sensitive to the air’s thermal increase since the middle of last century (Park et al., 2015). Therefore, the duration of accumulated snow is usually a factor that modifies seasonal fluctuations in the thickness of the permafrost active layer (Zhao et al., 2018). In the tropical high-mountain environment, the presence and duration of snow also govern the existence and conservation of alpine permafrost (Yoshikawa et al., 2021).
The thermal attenuating effect of the snowpack isolates surface ground (up to ~30 cm deep) from the direct effects of air temperature. The low density of fresh snow and its low degree of thermal conductivity make it an effective insulating barrier; consequently, the natural delay in the response of the ground to air temperature becomes even greater during the snowy season (Mackiewicz, 2012). According to Zhang (2005), the thermal conductivity of snow can be up to 20 times less than that of soils, ranging from 0.1 to 0.5 Wm-1 K-1 in fresh and packed snow, respectively. In addition, considering that the surface temperature of the ground is also a result of the incoming solar radiation, the reflectance of the snow (~80%) strengthens the heat-insulating effect. The percentage of non-reflected energy (~20%) is absorbed within the first 30 cm of snow thickness (Pomeroy and Brun, 2001); thus, in general terms, from this depth the thermal effect of air and insolation are negligible.
Considering that the insulating effect increases with the thickness of the snowpack, Zhang (2005) and Luetschg et al. (2008) considered that the optimal effect is around 30-50 cm deep. Ge and Gong (2010) pointed out that a thin cover of snow can favor the increase of the albedo, but it does not represent clear thermal insulation. As an example of the above, in a particular case, they report that while 5 cm of snow thickness conditions a temperature of -3 ºC at 50 cm of ground depth, 30 cm of thickness determines a value of -1 ºC at the same depth, noting the influence of air temperature into the ground. Another difference found with the previous example is that the thermal gradient within the ground decreases as the thickness of the snow increases. On the other hand, at surface level, during the presence of snow and at the beginning of its melting, the temperature of the ground usually remains at ≈0 ºC constantly, with small fluctuations close to the freezing point, but of short duration (Zhang et al., 2008; Staub and Delaloye, 2017). Because the first centimeters of bare ground are highly susceptible to diurnal and seasonal thermal variations, the snow insulation factor has been successfully tested using temperature sensors installed at depths of 5 to 20 cm into the ground (Schimd et al., 2012). Therefore, the difference in the behavior of the ground temperature with respect to that of the air can be used to estimate the presence, thickness, and duration of the snowpack (Apaloo et al., 2012; Schneider et al., 2012).
In Mexico, in recent years, glaciological investigations have been carried out (Ontiveros-González et al., 2015; Cortés-Ramos et al., 2019) and more recently of periglacial type (Soto and Delgado-Granados, 2018, 2020a, b; Soto et al., 2019). However, despite the common presence of snow precipitation in the country, and even though it has the highest mountain around Earth’s 19º north latitude that exceeds the height of the snow line, no detailed in-situ-work has been carried out to analyze and quantify the temporality and volume of snowfall events. Additionally, the attempts to install equipment for the measurement of snow precipitation and depth by ultrasonic probe have been unsuccessful due to the severe weather conditions that prevail at high altitudes and that commonly prevent its correct operation, in addition to the damages suffered by vandalism, as pointed by Soto and Delgado-Granados (2020a). Hence, the quantification and characteristics of snowfall events from the ground’s surface temperature could represent one of the most viable and economical alternatives for tropical high-mountain environments.
Therefore, due to the environmental importance of snow for the Mexican highlands, and for all tropical high mountains, this work is focused on providing an approach to the study of its quantitative properties in the highest mountain of the country, based on temperature data at the ground-air interface. These results are intended to serve as a reference for the Mexican high-mountain system and the intertropical region. It is also intended to highlight the need to install appropriate automatic meteorological stations to monitor the snow parameters of the Mexican high summits.
2. Study area
Located 190 km from Mexico City (19º 02’ N, 97º 16’ W), Citlaltépetl (also known as Pico de Orizaba) represents the highest volcano in North America. It is an active dormant ice-clad volcano whose most recent episode of eruptive activity occurred at the end of the 17th century. The largest glacier in the country is on its northern flank beginning at 5060 masl. From this elevation, it extends continuously to the summit; Cortés-Ramos et al. (2019) estimated its extension in 0.62 km2. Automatic meteorological stations were installed for glaciological research at 5140 masl operating from 2006 to 2010; afterwards, adverse weather conditions prevented the equipment from maintenance for continuous operation. Regarding its periglacial environment, Soto and Delgado-Granados (2020a) recently carried out work to estimate the coverage and current state of the permafrost on its slopes. These authors determined that from 4880 masl, the presence of permafrost begins with a temperature very close to 0 ºC, as occurs in most of the tropical high mountains that have this cryospheric element. At the same time, they noted that the active layer of permafrost reaches a depth of 120 cm nearby the lower limits of the glacier.
With respect to the climate and based on García (2004), the volcanic edifice presents two main variants: the “cold climate” [E (TH)] above 3369 masl and the “very cold climate” (EFH) that begins from the limits of the glacier; the annual average temperature of the latter is -2.3 ºC, staying below 0 ºC during the warmest month. These temperature conditions, together with the incidence of anabatic winds from the Gulf of Mexico and its humidity, favor the recurrence of snowfalls on its surface (Reyes-Coca, 2002). Due to its climate and the associated periglacial geomorphology, Soto et al. (2021) determined the altitude of the timberline at 4047 masl, while the tree line was located at 4117 masl. Above this altitude, the vegetation is made up of bushes that reach an altitude of ~4600 masl (Soto and Delgado-Granados, 2020a). Figure 1 corresponds to the study region.

3. Methods, data, and analysis
Temperature dataloggers model Hobo Pendant UA-001-64 were installed as indicated in Figure 1. Due to their range of measurements (-20 to 70 ºC), accuracy (< 0.5 ºC), resolution (0.1 ºC), size, and resistance, these sensors have been widely used to monitor the air temperature, the temperature at the bottom of the snowpack and the permafrost temperature in different parts of the planet (Soto and Delgado-Granados, 2019, 2020a, b). Sensors were distributed at four different altitudes on the northern slope of Citlaltépetl volcano, starting from the upper limit of the forest line and ending near the lower limit of the glacier. At each site, the ground was drilled, and a sensor was placed at the ground-atmosphere interface, at a depth of 5 cm. The installation sites were on a flat surface, away from elements that may intercept falling snow.
All sensors were new and factory calibrated, programmed to measure and store records every hour continuously for two years, from December 9, 2015, to December 8, 2017. The optimal performance of each sensor was continuously monitored every four months on average to take care of the level of batteries and data backup. An additional station was placed in the surroundings of the glacier because it is one of the sites most exposed to snowfall; a sensor was installed to record the air temperature, and another was placed at a depth of 50 cm, just below the surface ground sensor. The purpose was to analyze in detail the thermal behavior of the ground profile and the permafrost active layer, given the insulation caused by a thick and a thin layer of snow. In Table I the coordinates of each temperature monitoring site are shown, as well as their corresponding altitude.
Table I Temperature dataloggers location.
| Altitude (masl) | Depth (cm) | Longitude | Latitude |
| 5060 | +150 (air) | 97º 16.177’ | 19º 02.393’ |
| -5 | |||
| -50 | |||
| 4584 | -5 | 97º 16.209’ | 19º 02.778’ |
| 4200 | -5 | 97º 16.399’ | 19º 03.613’ |
| 4050 | -5 | 97º 16.491’ | 19º 04.346’ |
Once the data were extracted, the series quality was verified by using the graphic and exploratory method (Castro and Carvajal-Escobar, 2010). It was verified that there were no days or missing data between the series, ensuring temporal homogeneity. To detect possible outliers, it was ensured that all records were kept within a maximum of four times the value of the standard deviation (SD) (Vea et al., 2012), always reflecting atmospheric conditions (Firat et al., 2012; WMO, 2018).
With the time series of ground surface temperature, those periods were identified in which the temperature remained constant at 0 ºC, or with minimal variations around the freezing point. These isothermal periods would represent the presence of accumulated snow according to the criteria of Zhang (2005), Luetschg et al. (2008), Zhang et al. (2008), Ge and Gong (2010), Schimd et al. (2012), Apaloo et al. (2012), Schneider et al. (2012) and Staub and Delaloye (2017) and would be clearly distinguished from those with much more marked fluctuations, common in bare ground. To determine the degree of thermal oscillation in relation to the freezing point, the average temperature was obtained for each period, and from this value the thermal fluctuation was estimated based on its SD, under the premise that SD = 0 represents a constant value for all data. Therefore, based on the foregoing and as indicated by Ge and Gong (2010), three criteria have been established with respect to SD and temperature (Temp) to determine the thickness of the snowpack in each period of snowfall:
Those isothermal periods with SD < 0.1 and -0.3 ºC ≤ Temp < 0.3 ºC would represent a snowpack thickness ≥ 30 cm, relatively homogeneous with sufficient thermal insulating capacity.
Periods with 0.1 < SD < 0.3 and -1 ºC ≤ Temp < 1 ºC would indicate cycles with the presence of constant snow, but with a depth between 3 and 30 cm, allowing small variations of temperature around the freezing point.
Periods with SD > 0.3 and Temp < 1 ºC would be indicative of very shallow snow accumulation < 3 cm, unable to isolate the ground from atmospheric influence.
Temperature monitoring stations were identified on satellite images to corroborate the presence of snow at the site. In this way, the presence of snow indicated by isothermal or fluctuating values ≈0 ºC was corroborated. We used Landsat, Sentinel, or Aster images according to their availability; when no images were available for certain period, a later image, closer to the period of interest was used. The images were acquired from the Earth Explorer (2021)platform. RGB images were obtained by combining bands 4, 3, 2 of Landsat 8 and Sentinel, while for Landsat 7 bands 3, 2, 1 were used. In the case of Aster bands 6, 3, 1 were combined.
Additionally, to corroborate the presence and intensity of snowfall during the analysis periods, beyond those indicated by the RGB images of natural color, the GPM_3IMERGDL model (Huffman et al., 2019) was used; this is generated by multi-satellite microwave and IR platforms to estimate the accumulated daily precipitation. From this model, the total precipitation of each period and its daily average were calculated. The model was obtained through NASA’s Giovanni platform.
Finally, at 5060 masl the period with deeper and more homogeneous snow accumulation was compared against one of less thickness and of the most irregular. For each of these episodes, the air and ground temperatures at -5 and -50 cm were plotted. From the ground temperature values, the averages and their SDs were compared, and the thermal gradient of the ground profile was obtained. Considering that Soto and Delgado-Granados (2020a) determined the presence of permafrost with an active layer 120 cm thick at this site, the temperature behavior in the profile allowed us to know the response of the active layer to the snowpack.
To verify the estimated snow thickness by means of ground surface temperature, the visits to the monitoring sites to back up the data were used to measure the depth of the snow cover; this was only possible when it coincided with a snowfall that occurred in recent days or during workdays. Considering the difficulties of ascent to the mountain and even more during episodes of snowfall, there was only an opportunity to corroborate the thickness of snow in three different periods. The verification consisted of measuring the snowpack thickness with a tape measure just above the position of each sensor.
4. Results
Over two years various episodes of snowfall with different accumulation thickness and duration were identified and confirmed, from the limit of the glacier (5060 masl) to 4200 masl; meanwhile, at 4050 masl there was no clear evidence of snowfall. Figure 2 shows the time series for each altitude on the northern slope of Citlaltépetl volcano. Based on this, it can be noticed that at 5060 masl, 14 periods with snow cover were identified. Among these, five had a thickness ≥ 30 cm with a permanence ranging from three to 60 days depending on the months of the year; the average surface temperature of the ground was from 0.06 to 0.25 ºC; the SD from 0.04 to 0.07 indicates the thickness of the snowpack and relative homogeneity. Nine periods with a thickness < 30 cm with a duration of 3 to 25 days were also observed; the average surface temperature was from -0.63 to 0.58 ºC, and the SD from 0.10 to 0.27 indicates the relative influence of air on the ground surface. Finally, five episodes were identified with a thin layer of snow with a duration of three to 53 days, and the average ground temperature ranged from -5.40 to 0.47 ºC during the periods. The SD between 0.59 and 2.59 indicates a greater influence of the air on the ground’s upper layer.
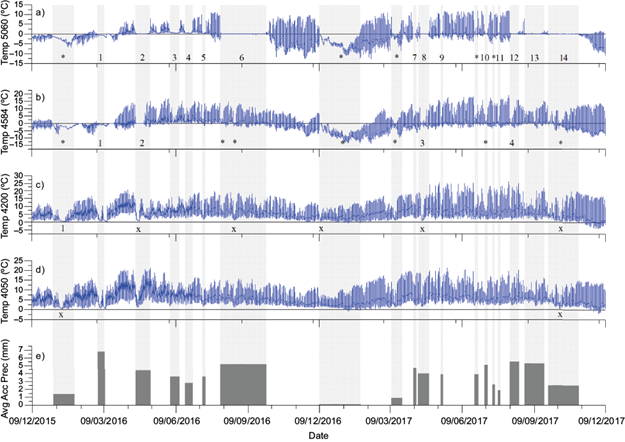
Fig. 2 Time series per altitude (“a” to “d”). Continuous numbers represent snowpack thickness equal or greater than 30 cm; periods marked with an asterisk (*) indicate a snow thickness of less than 30 cm and those small periods marked with an “X” could be associated with falling sleet. The “e” graph indicates the daily average accumulated precipitation per period.
At 4584 masl, there was a period with snow accumulation equal to or greater than 30 cm thick that lasted 11 days; the average temperature of the ground was 0.03 ºC and its SD of 0.06 indicates the little thermal oscillation of the surface because of the insulation. There were two periods with snow thickness < 30 cm with a duration of three and 9 days; the average temperature of the events was -0.08 and 0.26 ºC, respectively; its SD ranges from 0.11 to 0.24. There were also eight periods with shallow snow that lasted between 3 and 53 days; the average temperature of the ground surface was from -7.13 to 0.75 ºC in response to the influence of the air; this is confirmed by the thermal fluctuation of the ground ranging from 0.32 to 3.25 of SD.
At 4200 masl, a single period of accumulated snow was identified with a duration of six days; its average surface temperature was 0.45 ºC and its SD of 0.12 suggests that the thickness of the snowpack was less than 30 cm. In relation to the elevation of 4050 masl, there was no clear evidence of snowfall from the ground temperature; there were also no satellite images indicating the presence of snow during the study period.
For all cases, Table II indicates each of the mentioned periods with their corresponding values; likewise, Figure 3, composed of satellite images for each identified period, allows corroborating the presence of snow per altitude, regarding the temperature observation stations.
Table II Number of snowfall periods and their duration at different altitudes at Citlaltépetl volcano.
| Acc Prec per period mm | Average precipitation per period (mm) | 5060 masl | 4584 masl | ||||||||||||||||||||||
| Period | From | To | Days | Soil Avg T | SD | Image | Map | Period | From | To | Days | Soil Avg T | SD | Image | Map | Period | From | To | Days | Soil Avg T | SD | Image | Map | ||
| 38.4 | 1.4 | + | 05/01/2016 | 31/01/2016 | 27 | -3.16 | 1.469 | 22/01/2016 | a | + | 14/01/2016 | 21/01/2016 | 8 | -1.95 | 0.315 | 22/01/2016 | a | **1 | 16/01/2016 | 21/01/2016 | 6 | 0.45 | 0.121 | 22/01/2016 | a |
| 61.5 | 6.8 | **1 | 02/03/2016 | 10/03/2016 | 9 | -0.63 | 0.079 | 18/03/2016 | b | **1 | 02/03/2016 | 10/03/2016 | 9 | -0.08 | 0.235 | 18/03/2016 | b | ||||||||
| 56.9 | 4.4 | **2 | 19/04/2016 | 07/05/2016 | 13 | 0.19 | 0.119 | 27/04/2016 | c | ***2 | 20/04/2016 | 30/04/2016 | 11 | 0.03 | 0.064 | 27/04/2016 | c | ||||||||
| 43.3 | 3.6 | **3 | 02/06/2016 | 13/06/2016 | 12 | 0.58 | 0.154 | 14/06/2016 | d | ||||||||||||||||
| 28.4 | 2.8 | **4 | 21/06/2016 | 30/06/2016 | 10 | 0.53 | 0.087 | 22/06/2016 | e | ||||||||||||||||
| 14.3 | 3.6 | (**5) | 13/07/2016 | 16/07/2016 | 4 | 0.33 | 0.109 | 16/07/2016 | f | ||||||||||||||||
| 108.7 | 21.7 | + | 05/08/2016 | 09/08/2016 | 5 | 0.75 | .773 | 09/08/2016 | s | ||||||||||||||||
| 314.4 | 5.2 | ***6 | 05/08/2016 | 02/10/2016 | 60 | 0.16 | 0.074 | 25/08/2016 | g | + | 22/08/2016 | 25/08/2016 | 4 | -0.14 | 0.471 | 25/08/2016 | g | ||||||||
| 3.7 | 0.1 | + | 09/12/2016 | 30/01/2017 | 53 | -5.40 | 2.588 | 24/01/2017 | h | + | 09/12/2016 | 30/01/2017 | 53 | -7.13 | 3.250 | 24/01/2017 | h | ||||||||
| 12.4 | 0.9 | (+) | 11/03/2017 | 24/03/2017 | 14 | -1.33 | 2.000 | 13/03/2017 | i | (+) | 11/03/2017 | 23/03/2017 | 13 | -1.98 | 2.960 | 13/03/2017 | i | ||||||||
| 18.8 | 4.7 | **7 | 08/04/2017 | 11/04/2017 | 4 | 0.05 | 0.128 | 14/04/2017 | j | ||||||||||||||||
| 55.3 | 4.0 | ***8 | 14/04/2017 | 27/04/2017 | 14 | 0.07 | 0.069 | 22/04/2017 | k | * | 14/04/2017 | 23/04/2017 | 10 | -0.25 | 0.770 | 22/04/2017 | k | ||||||||
| 11.7 | 3.9 | 9 | 13/05/2017 | 15/05/2017 | 3 | 0.18 | 0.044 | 16/05/2017 | l | ||||||||||||||||
| 19.4 | 3.9 | + | 25/06/2017 | 29/06/2017 | 5 | 0.47 | 0.921 | 25/06/2017 | m | + | 25/06/2017 | 28/06/2017 | 4 | 1.29 | 1.545 | 25/06/2017 | m | ||||||||
| 20.4 | 5.1 | ***10 | 08/07/2017 | 11/07/2017 | 4 | 0.25 | 0.061 | 13/07/2017 | n | ||||||||||||||||
| 7.8 | 2.6 | + | 18/07/2017 | 20/07/2017 | 3 | -0.26 | 0.593 | N/A | N/A | ||||||||||||||||
| 5.8 | 1.9 | **11 | 25/07/2017 | 27/07/2017 | 3 | 0.26 | 0.266 | 27/07/2017 | o | ||||||||||||||||
| 65.4 | 5.5 | **12 | 09/08/2017 | 20/08/2017 | 12 | 0.23 | 0.101 | 12/08/2017 | p | **4 | 09/08/2017 | 11/08/2017 | 3 | 0.26 | 0.099 | 12/08/2017 | p | ||||||||
| 132.6 | 5.3 | **13 | 28/08/2017 | 21/09/2017 | 25 | 0.22 | 0.104 | 13/09/2017 | q | ||||||||||||||||
| 100.6 | 2.5 | (***14) | 27/09/2017 | 05/11/2017 | 40 | 0.06 | 0.064 | 15/10/2017 | r | (+) | 27/09/2017 | 19/10/2017 | 3 | 0.53 | 2.328 | 15/10/2017 | r | ||||||||
+: Events with great influence of air temperature on the surface in response to a thin snowpack; N/A: no satellite images were available for the corresponding period; *** snowpack thickness ≥ 30 cm; **thickness between 3 and 30 cm; * superficial snow ≤ 3 cm; Soil Avg T: average temperature of the ground during the snow presence; SD: ground’s degree of thermal oscillation.
Consecutive numbers indicate the events with thermal insulation as a result of a greater thickness.
Letters in the Map column correspond to satellite images in Figure 3.
Periods marked in bold correspond to events compared in detail in relation to air temperature and depth = 50 cm.
The altitude of 4050 masl was not considered in the table because there was no evidence of snowfall.
The leftmost columns indicate the total accumulated precipitation for each period and its daily average respectively.
Periods in parentheses indicate those events whose snowpack thickness could be verified at each site.
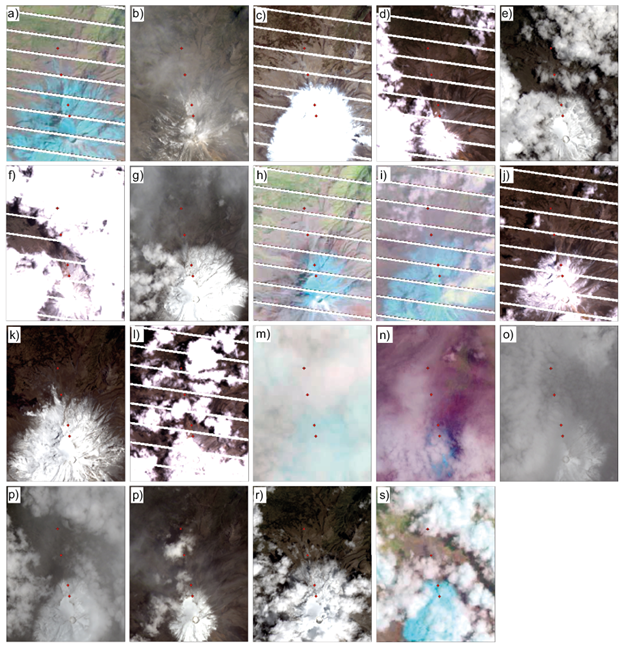
Fig. 3 Set of satellite images indicating the presence of snow; ground temperature monitoring sites are shown in red.
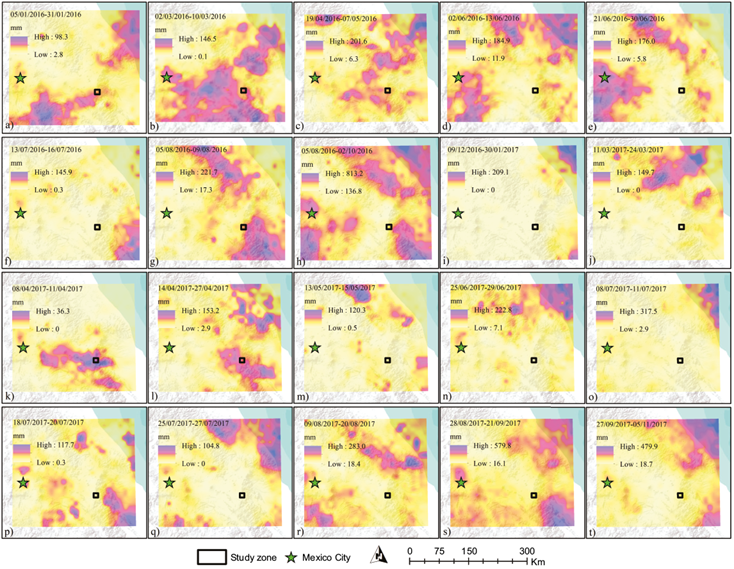
Regarding total accumulated precipitation, the sequence of images “a” to “t” in Figure 4 shows chronologically the periods of snowfall identified. Maximum accumulation values ranging from 36 to 813.2 mm can be observed in the eastern region of the Neovolcanic Axis, with different levels of accumulation in the Citlaltépetl volcano. The accumulated precipitation in the Citlaltépetl area can also be seen in the left columns of Table II, with cumulative values ranging from 3.7 to 314.4 mm per period of snow presence, with a daily average of 0.1 to 21.7 mm. From Figure 4 and Table II it is observed that the highest accumulated precipitation values occur between the periods of maximum and medium thickness of snow, showing a consistent relationship. Similarly, those episodes of less accumulated precipitation correspond to a shallow snow thickness; both cases can be observed through the thermal insulation of each of the periods indicated in Figure 2.
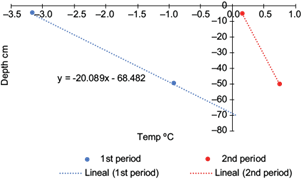
The comparison between two periods of snowfall with different characteristics at 5060 masl (the first case, from January 5 to 31 and the second from August 5 to October 2, 2016) allowed to know the thermal behavior in the ground profile. In the first case, an average temperature of -3.16 ºC at 5 cm and -0.92 ºC at 50 cm of ground depth was reported; the average air temperature at the site was -2.96 ºC during this period. This episode was characterized by a layer of shallow snow that allowed the influence of the air on the surface; its SD of 1.47 indicates fluctuation in surface temperature. Meanwhile, at a depth of 50 cm, the SD of 0.89 indicates a certain degree of influence of the air, whose temperature, despite the fact that the period analyzed is in the middle of the winter, presented fluctuations (SD = 4.89) according to the different hours of the day. Based on the temperature records of the ground profile, a gradient of 0.091 ºC cm-1 was found, emphasizing the degree of penetration of the air temperature previously mentioned.
For the case of the second period, the average surface temperature of the ground was 0.16 ºC and at 50 cm it was 0.75 ºC; the average air temperature during the period was 1.66 ºC. Based on the surface temperature and its SD = 0.07, a snowpack thickness ≥ 30 cm was determined, which allowed a temperature closer to 0 ºC and with less fluctuation at a depth of 50 cm. At this depth, an SD = 0.42 shows a lower influence of the air at the bottom of the ground profile, despite the greater air thermal oscillation represented by its SD = 5.00 due to the variation of sunlight during the day. Ground temperature data show a thermal gradient equal to 0.02 ºC cm-1. The behavior of the different temperature values for both periods is observed in Figure 5.
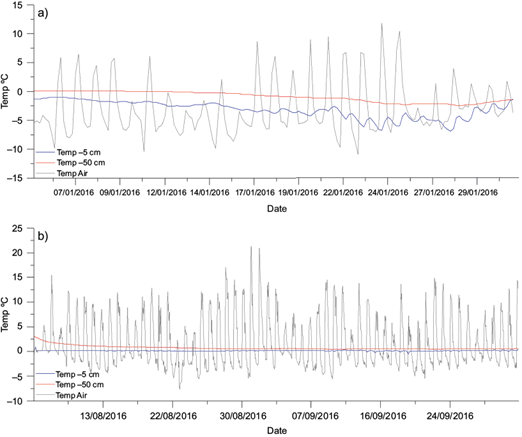
Fig. 5 Two different periods of snowfall at 5060 masl. Graph (a) corresponds to the period from January 5 to 31, 2016, and (b) from August 5 to October 2, 2016.
Weather conditions allowed the snow thickness to be verified manually only on three occasions; however, it was sufficient to corroborate the depth of the snow cover in three different thickness situations. Table III indicates the three verified events with their corresponding values. Measurements made in situ correspond to the estimation ranges calculated by means of the ground surface temperature and its fluctuation (SD).
Table III Snow depth estimated vs. measured*.
| Average precipitation per period (mm) | Duration of snowpack (from/to) | Date of verification | Verification altitude (masl) | Thermal fluctuation (SD) | Estimated snowpack thickness (cm) | Measured thickness (cm) |
| 3.6 | 13/07/2016 16/07/2016 | 15/07/2016 | 5060 | 0.109 | > 3 and < 30 | 22 |
| 0.9 | 11/03/2017 24/03/2017 | 14/03/2017 | 5060 | 2.0 | ≤ 3 | 3 |
| 4584 | 2.96 | 2 | ||||
| 2.5 | 27/09/2017 05/11/2017 | 10/10/2017 | 5060 | 0.064 | ≥ 30 | 34 |
| 4584 | 2.328 | ≤ 3 | 3 |
*Estimated and verified values are shown in the last two columns on the right.
Despite the number of measurements made, they are statistically representative; Figures 6 and 7 confirm the above. Based on Figure 7, there is an acceptable degree of correlation between the level of thermal fluctuation (SD) and the quantized thickness; a Pearson’s coefficient of -0.9 indicates that as the snow thickness decreases, the thermal oscillation of the surface increases, as has been indicated in the theoretical context. And according to the model, any other measurement must be within the indicated confidence intervals, with a significance level of 0.05. The residual graphs in Figure 8 indicate the differences between the estimated and the verified, confirming the margin of error obtained, which once again is statistically acceptable. The reasons that explain the residuals can be diverse; however, among these, the wind factor can be highlighted, mainly due to the intensity in the highest areas of the mountain that is responsible for suddenly transporting the non-compacted snow from one place to another.
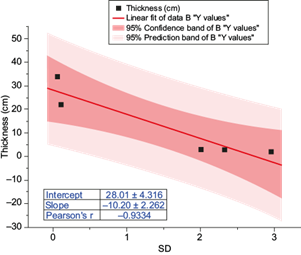
Fig. 6 Measured thickness vs. ground thermal oscillation. Correlation calculated using Pearson’s coefficient.
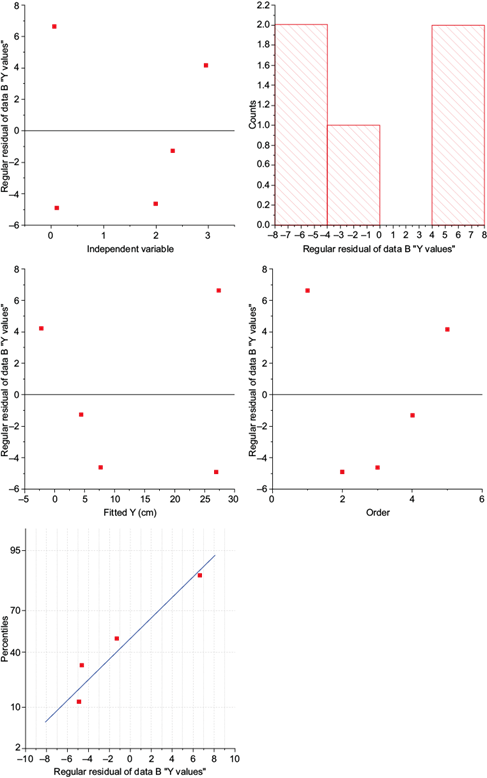
Fig. 7 Graphs of residuals between the estimated and measured snow thickness, based on the model in Figure 6.
5. Discussion
The ground surface temperature below the snowpack remains constant if a sufficiently thick layer is maintained, causing the temperature values to remain a few tenths of a Celsius degree around the freezing point. According to the data obtained, below a thickness of at least 30 cm, the ground temperature remains at values very close to 0 ºC constantly if the accumulated snow persists, as mentioned by Mackiewicz (2012). It is likely that these fractions of a degree centigrade around the freezing point are a consequence of the level of precision of the sensors, which has been mentioned in their technical specifications. However, it may be difficult to confirm this because all weather measurement devices (some more than others) have their own threshold of accuracy (WMO, 1983). Regardless of the above, the insulating effect of snow has been corroborated in this work through ground surface temperature records, as pointed out by Zhang (2005) and Luetschg et al. (2008). The high correlation between air temperature and surface in bare ground conditions is well known, which has been verified by Soto and Delgado-Granados (2020b) in this same mountain. However, in the presence of a thick layer of snow, the thermal behavior of the ground is different to that of air, which is clearly seen in Figure 4.
Once the snowpack thickness decreases, the thermal fluctuation of the ground begins in response to the increasing influence of the air. Based on the above, it has been possible to identify different periods of snowfall with different accumulated thickness and different duration; accordingly, it can be corroborated that snowfall in the Citlaltépetl volcano occur more frequently as terrain elevation increases. Since most snowfall occurs during part of the summer and autumn, below ~4000 masl the precipitation becomes liquid once it crosses the 0 ºC isotherm, as occurs in the mid-mountain regions of the region, giving rise to the humid forests characteristic of the windward region of the study area between altitudes of 700 to just over 3000 masl.
During the time of this study there was no clear evidence of snowfall at the altitude of the upper limit of the forest (4050 masl); however, at least two small isothermal periods were identified that could represent sleet fall. Or perhaps the snowfall events, if they did occur, were so light and short-lived that it was impossible to be noticed by both temperature sensors and satellite images. This is possible because the two episodes correspond to snowfall events that occurred at higher elevations. On the other hand, different episodes of snowfall occur from 4200 masl, some with a thin layer of snow and others with a greater thickness, which together with the air temperature favored a longer duration.
Snowfall events are present in any season of the year, and they may occur with some regularity in mountains that exceed the altitude of the forest limit, as in the case of the volcanoes indicated within the Neovolcanic Axis in Figure 1. The snow precipitation that occurs between the warm months (April-October) is mostly of the convective type, due mainly to the forcing of the relief on the entry of moisture from the Gulf of Mexico that prevails during that season, while the little precipitation during the coldest months (November-March) is mostly produced by the arrival of cold fronts, causing light precipitation from stratiform type clouds. Soto et al. (2023) point out both precipitation processes in mountain areas on the eastern slope of the country, emphasizing the precipitation characteristics found in this work for the same periods.
The duration of the snowpack in this mountain depends on the thickness and altitude at which it occurs. At 5060 masl there have been periods of irregular or thin snowpack both in winter and summer, while the thickest events occurred during spring and autumn. This seems to indicate that despite the low winter temperatures, precipitation in this season is scarcer, while during the greater precipitation regime that occurs in the summer, insolation and daily thermal oscillation facilitate the rapid melting of snow. In turn, the thermal transition from winter to spring, as well as the pluvial transition from summer to autumn, favor the greater thickness of snow. The low precipitation regime in this mountain during winter has been previously pointed out by Ontiveros-González et al. (2015) and Cortés-Ramos et al. (2019); on the other hand, Soto et al. (2020) state that during the months of higher temperature, the precipitation regime increases in the Nevado de Toluca volcano (4680 masl), 260 km away.
The snow accumulation at 5060 masl lasts three weeks on average because of the air temperature that prevails at that altitude; however, insolation and fluctuation with positive temperature values are responsible for its melting and/or sublimation. Meanwhile, at 4584 masl snowfall events are mostly of little thickness and, therefore, together with a higher average air temperature, insolation, and oscillation around positive temperatures, their duration is one to two weeks on average. It is likely that the second period of snowfall identified at this altitude, thicker than it is presented at 5060 masl, was the consequence of the intensity of the wind at higher altitudes, causing the spread of fresh snow above 5000 masl. At 4200 masl snowfall is scarce, at least that is how it was observed during the study period, and its duration is a few days due to the rapid recuperation of air temperature. The precipitation regime found in this work, in relation to altitude, emphasizes what has been pointed out by Soto et al. (2020) in the Mexican high-mountain system.
The results found in terms of thickness of the snow coincide closely with those of Olefs et al. (2020) in the Austrian Alps, with an average thickness per event of 15 cm, although the duration of the snow cover, with an average of 42 days, could be the result of colder temperature conditions due to the latitudinal factor. In a similar way to what was found by Shaw et al. (2020) in the central region of the Andes, the accumulation of snow per hydrological year exceeds one meter of total accumulation, although the slope of the Andean relief and orographic shadows favor a longer duration of the snow cover which reaches up to 140 days per year, while in our study the maximum duration found was 60 days due to greater exposure to insolation because of the homogeneity of the volcanic cone of Citlaltépetl. On the other hand, the thickness per event is less than the findings of Mayes-Boustead et al. (2015) for most of the central and northern USA, with a mean value close to 40 cm; it seems that the proximity to the Great Lakes, and its moisture contribution, among other factors, could the cause of this situation. Additionally, the temperature conditions during winter, with values ≤ -10 ºC on average, also favors its duration for several weeks.
Regarding the mass balance of the Glaciar Norte, the largest in the country, which is housed in this mountain, the snowfall regime that has been noticed in this research seems to play an important role in this glacial system. Even though Ontiveros-González et al. (2015) point out that the main factor of mass loss is due to the net radiation received on its surface, the precipitation variable is added to the radiative element, creating a duality of negative impact for the conservation of the glacier mass; that is, while the positive energy balance causes a high degree of melting of glacial ice, among other consequences, the volume and duration of the snowpack does not seem to contribute enough to the mass balance. It is important to mention that between 2006 and 2009 the authors reported an accumulated annual precipitation of 454 mm at 5130 masl, a much lower value compared to those identified in other tropical mountains. If this total precipitation value is considered, and we associate it with the episodes of snowfall that occurred at 5060 masl, we can highlight that the greatest snow accumulation occurs during the warmest months of the year due to the entry of humid air masses from the Gulf of Mexico, carried by the summer trade winds. It seems that the ENSO phases (positive, negative, or neutral) have no direct influence on the precipitation regime due to the distance from the Pacific Ocean; Soto et al. (2020) emphasized this situation.
Snow precipitation in this mountain is of importance because the great majority of the snowpack is affected by the diurnal fluctuation of air temperature during summer and part of the autumn, while the few winter snowfall events are seemingly not affected by the thermal factor but by sublimation due to solar radiation. This fact is frequently notorious by the regular presence of penitents above the glacier ice. Additionally, when considering the glacier equilibrium line altitude, determined by Cortés-Ramos et al. (2019) at 5228 masl, we can highlight that these snowfall episodes occur within or nearby the ablation zone, without adding to the glacier mass due to its fast melting or sublimation. The sum of the factors mentioned above suggests that the clear retreat trend of the country’s main glacier would be far from reversing.
As a result of different thicknesses of the snowpack, and from the data obtained at 5 and 50 cm depth at 5060 masl, two different thermal behaviors have been identified in the ground profile. The first corresponds to the period of shallow snow accumulation (January 5-31, 2016) that determines a low level air-ground insulation; this is corroborated by the degree of thermal fluctuation at the bottom of the profile indicated by its SD = 0.89 and a thermal gradient of 0.0497 ºC cm-1. Meanwhile, the second period, with a snowpack depth ≥ 30 cm (August 5 to October 2, 2016), creates a noticeable insulation through a thermal fluctuation less than half that in the first period, represented by an SD = 0.42; this level of insulation conditions a much smoother gradient of 0.0131 ºC cm-1; that is, 3.8 times less. Because of the months in which each snowfall event occurs, the average air temperature in each period is -2.96 and 1.66 ºC, respectively. The average temperature values are due to the seasons of the year in which both periods have occurred. However, between both episodes there is a relatively similar thermal oscillation of the air (SD 4.89 vs. 5.00) due to the different levels of insolation throughout the day.
From the periglacial perspective, the analysis of both periods allows us to know the thermal impact of the air on the underground. If the presence of permafrost and the average depth of the active layer (120 cm) indicated by Soto and Delgado-Granados (2020a) are considered, as well as the temperature gradient of the profile for each case, it is possible to corroborate that the thin layer of snow influences directly the thickness of the active layer. Considering that the first period of snowfall occurs during winter, the surface temperature of the ground (5 cm deep) records a value relatively similar to that of the air. The ground profile also shows negative temperatures, which cause the active layer thickness to reduce to a depth of 68 cm, with a behavior according with the season of the year (Figure 8). For its part, the period that occurred during the end of summer and with greater snowpack thickness, allows us to see that at that time, the thawed active layer could reach a great thickness during the summer. Soto and Delgado-Granados (2020a) indicate that during this period the active layer reaches a depth greater than 250 cm at this point; once again, this behavior is consistent for the warmer months of the year. It is even probable that, at least during this episode of summer snowfall, the active layer (with higher temperature values according to depth) shows a behavior that allows determining its non-existence during the warmest months of the year. This is perhaps a phenomenon typical of the tropical high mountains and at the same time a consequence of the permafrost temperature in these regions, which is very close to the thawing point (Soto and Delgado-Granados, 2020a; Yoshikawa et al., 2021), showing a behavior very different from what occurs in circumpolar permafrost regions. However, in order to determine whether the permafrost active layer at this site is actually non-existent, at least during the warmest month of the year, it is necessary to monitor the temperature at a much greater depth. Regardless of all the above, this comparative action between both periods makes it clear that the greater the thickness and duration of the snowpack, the thermal fluctuations inside the ground are limited, influencing the thickness of the active layer, and restricting the depth of penetration of air temperature into the isothermal permafrost layer.
6. Conclusions
The level of air-ground insulation of the snow was verified in this work and allowed to determine the different episodes of snowfall in the Citlaltépetl volcano. From the data of ground surface temperature, it was identified that snowfall is present in any season of the year and occur more frequently at higher altitudes of the mountain. Snowfall events are more recurrent and with greater intensity during the months of higher air humidity transported by the trade winds, during the summer and part of the fall. Most of the time the volume of snowfall generates a snowpack thickness of less than 30 cm lasting less than two weeks on average; however, there is little difference in terms of frequency with events of greater depth of snow accumulation that can remain even for three or more weeks on average.
It was found that because snowfall occurs mostly during the warmer months and within the glacial ablation zone, its melting and/or sublimation does not allow it to expand the mass of the largest glacier in the country. For its part, the permafrost in this mountain is influenced by the depth of penetration of air temperature, depending on the thickness of the snowpack and the season of the year.
The results of this work represent the first approach to the quantitative study of snowfall in Mexico, and it is a crucial part of the study of cryosphere in intertropical regions of the planet. However, in order to understand more precisely the amount of precipitated snow, its thickness, and liquid water equivalent in the highest mountain of Mexico, it is necessary to install at least one meteorological station equipped with a rain gauge adapted to measure the liquid water equivalent of snow, as well as a sonic sensor to determine the thickness of the snowpack, at the same time protected from onlookers who may harm it. The sum of these efforts will undoubtedly strengthen the knowledge of nivology in the latitudinal zone of 19 ºN, where the Citlaltépetl volcano represents the only reference of glacial and periglacial environments on the entire planet.
This theoretical approach addresses the quantification, thickness, and duration of snowfall in Mexican high mountain environments from in situ records; however, it is necessary to point out that in order to strengthen the findings of this work and improve future research, it is necessary to consider other parameters such as the size and shape of the snow crystals and the moisture content present in the snow, since, as has been pointed out, these properties determine the intensity of the energy flow inside the snowpack, which in turn determines its permanence or the speed of its melting, in addition to air temperature. Furthermore, it is necessary to mention that the latitude factor represents another determining component in the matter of energetic radiation at surface level, since in the equatorial and intertropical regions the amount of energy received is greater than in the middle latitudes.

