


 nueva página del texto (beta)
 Inglés (pdf)
 Artículo en XML
 Referencias del artículo
 Enviar artículo por email
 Citado por SciELO
  Similares en
SciELO
Similares en
SciELO 
 Permalink
1. Introduction
Borneo is the third-largest island in the world and the largest island in Asia. The region is divided into three state regions: Brunei Darussalam, Malaysia, and Indonesia. Located in the Indonesian Maritime Continent (IMC), Borneo is characterized by its high convective activity, complex atmospheric dynamics, and unique climate (Yamanaka, 2016). The variability of rainfall in this region is influenced by many drivers such as monsoons, Madden-Julian Oscillation (MJO), El Nino Southern Oscillation (ENSO), Borneo Vortex, Cold Surges, and other phenomena (Dambul, 2010; Qian et al., 2013; Paulus and Shanas, 2017; Isnoor et al., 2019; Purwaningsih et al., 2020; Mandang and Rahmiati, 2022).
Global climate change is caused by the increased concentration of Green House Gasses (GHG) and natural carbon sink reduction, which induces the greenhouse effect (Agnihotri P, 2015). Global climate change is predicted to lead to extreme temperatures, severe drought, heavy storms, and periodic flooding (Costa de Oliveira, 2014). Extreme climate events have devastating consequences, including loss of life, destruction of property and ecosystems, as well as economic damage in various regions of the world. Therefore, it is crucial to understand the future climate to develop appropriate mitigation and adaptation strategies to reduce the risk of lives and property damage.
The Borneo region is experiencing many threats and disasters due to climate change (WWF, 2012). One of these threats is a prolonged drought that could lead to other disasters such as forest fires, crop failures, tree mortality in forests, changes in plant, insect, and animal habitats, and other consequences (Miyamoto et al., 2021; Harrison, 2001).
Given how dynamic the climate is in Borneo and the importance of Borneo’s political and geographical position, it is necessary to ensure that this region is safe and not vulnerable to the impacts of climate change. Thus, efforts must be made to mitigate and adapt to climate change. One such effort is conducting climate modeling with climate scenarios. Climate scenarios can help consider possible future climate conditions and help determine the steps needed to prevent and mitigate the impacts of climate change.
Climate change modeling has undergone many developments. One is the dynamical downscaling method which increases the resolution of Global Climate Model (GCM) simulations and the development of climate scenarios such as Representative Concentration Pathways (RCPs). These methods are developed within the Coupled Model Intercomparison Project Phase 5 (CMIP5) framework, which is used to obtain climate projections. The GCM has a spatial resolution of 100-250 km (Taylor et al., 2012). However, the spatial resolution of the GCM is too low, so it cannot be directly used for climate projections on a regional scale. Therefore, it is necessary to use a downscaling method to observe regional climate conditions and obtain a regional climate model (RCM).
Regional Climate Models (RCM) developed in the late 1980s represent climate variability on a small scale and were obtained by downscaling the GCM. The RCM has a spatial resolution of 10-50 km (Colmet-Daage et al., 2018). Examples of the RCM are the ICTP RCM (RegCM4) and CSIRO’s Conformal Cubic Atmospheric Model (CCAM).
The Conformal Cubic Atmospheric Model (CCAM) is a global atmospheric model developed for atmospheric climate modeling and regional climate downscaling. It employs a conformal cubic grid to model the atmosphere without requiring lateral boundaries (McGregor, 2005; McGregor and Dix, 2008). Under some circumstances, it has been found that CCAM and its improvement methods gave equally valid downscaled output. Therefore, this model can be the best method for accurately downscaling the GCM to describe Indonesia’s regional climate conditions.
The Representative Concentration Pathway (RCP) 4.5 is a scenario that stabilizes radiative forcing at 4.5 Watts per meter squared in the year 2100 without ever exceeding that value (Thomson et al., 2011). This scenario assumes that climate policies, in this case, introducing a set of global greenhouse gas emissions prices, are invoked to achieve the goal of limiting emissions and radiative forcing. Given the current world conditions, RCP 4.5 is a possible scenario.
This study aims to investigate the possibility of drought events on the island of Borneo caused by climate change. Climate projections will be conducted using the global climate model, downscaled into 25 km resolution. The climate scenario used in this modeling is RCP 4.5.
2. Data and Method
2.1 Research Location
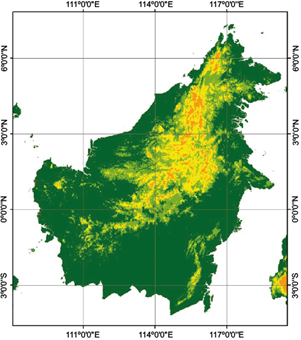
The research location is Borneo Island with the following boundary coordinates 107º - 120º E, 4.5º S - 7.5º N. The research location map is presented in Figure 1.
Several sites corresponding to big cities in Borneo were selected for this study and are listed in Table I. Sample point data were retrieved from model data that has grid mode based on the locations of the data.
2.2 Data
2.2.1 Observation Data
This research used SA-OBS data as its observation data. This dataset has daily, high-resolution, land-only, observational, and gauge-based interpolated precipitation information (Van den Besselaar et al., 2017). The data also has a spatial resolution of 0.25ox0.25o and daily temporal resolution. The SA-OBS is part of the SACAD (Southeast Asian Climate Assessment and Dataset) as a joint project between the National Meteorological Services of Indonesia (BMKG) and the Netherlands (KNMI) (Van den Besselaar, 2017). The observation data were used to validate the precipitation data from the model output. The validation method used in this research consisted of calculating the correlation coefficient, root mean square error (RMSE), probability of detection (POD), and false alarm ratio (FAR).
2.2.2 GCM
The Global Climate Model (GCM) presents a complex mathematical representation of major climate system components (atmosphere, land surface, ocean, and sea ice) and their interactions (Farzaneh et al., 2012). The GCM provides important data for understanding the representation of climate conditions with global resolution and sufficiently comprehensive data for the analysis of global climate change. In this study, the GCM data was used as input to analyze climatic conditions. Furthermore, a dynamical downscaling method was used for this GCM data for the regional-scale climate analysis. In this study, ACCESS 1-3 data was used. This model was selected based on the suitability of schemes used in the model with precipitation conditions in the Maritime Continent, especially in Borneo (Ackerley and Dommenget, 2016).
2.3 Method
2.3.1 Dynamical Downscaling
The GCM data used in climate change analysis still has a low resolution. Therefore, the dynamical downscaling method was applied to the GCM data for regional-scale climate analysis (Wang et al., 2004). In this study, the type of Regional Climate Model used is CCAM (Conformal Cubic Atmospheric Model). The CCAM is a model developed for atmospheric climate modeling and regional climate downscaling and does not require a lateral boundary in its running (McGregor, 2005; McGregor and Dix, 2008). The CCAM is a hydrostatic atmospheric model with two time-level semi-implicit times differencing. It uses semi-Lagrangian advection associated with bicubic horizontal interpolation and total-variation-diminishing vertical advection (McGregor, 2005).
2.3.2 RCP 4.5 Scenario
The Representative Concentration Pathway (RCP) is a climate scenario developed by the IPCC by considering the possibility of large GHG concentrations in the air in the future (Van Vuuren et al., 2011a). The RCP considers the effect of GHG concentrations on radiative forcing as it warms the earth’s surface and results in global warming. The RCP has four climate scenarios considering GHG concentrations for up to 2100 and their trajectories (Van Vuuren et al., 2011a). An explanation of the RCP scenarios is presented in Table II.
Table II Representative Concentration Pathways in the year 2100 (Van Vuuren et al., 2014).
| Radiative Forcing | CO2 equivalent concentration | Rate of change in radiative forcing | Key Reference | |
| RCP 8.5 | 8.5 W/m2 | 1350 ppm | Rising | Riahi et al., 2011 |
| RCP 6.0 | 6.0 W/m2 | 850 ppm | Stabilizing | Masui et al., 2011 |
| RCP 4.5 | 4.5 W/m2 | 650 ppm | Stabilizing | Thomson et al., 2011 |
| RCP 2.6 | 2.6 W/m2 | 450 ppm | Declining | Van Vuuren et al. 2011b |
This study used the Representative Concentration Pathway 4.5 (RCP 4.5) to project the future climate condition. The RCP 4.5 is a scenario that covers the long-term global emissions of greenhouse gases, short-lived species, and land-use-land-cover, based on stabilizing radiative forcing at 4.5 W m−2 (approximately 650 ppm CO2-equivalent) in the year 2100 without ever exceeding that value (Thomson et al., 2011).
2.3.3 Bias Correction with Linear Scaling
Linear scaling is a method for correcting climate model output data using monthly correction values based on the differences between observed and present-day simulated values (Lenderink et al., 2007). The rainfall data were corrected using a factor based on the long-term monthly mean, and control run data ratio. The formula for generating corrected data using Linear Scaling is presented in equations (1) and (2).
P* represents the corrected precipitation value, P represents the precipitation value, and µ represents the mean. In this study, the control period was between 1991-2017.
2.3.4 Standardized Precipitation Index (SPI)
Many experts from various disciplines have put forward the definition of drought. In this study, the drought that will be discussed is meteorological drought or drought in terms of meteorological variables. The SPI (Standardized Precipitation Index) was also used to analyze the drought index in an area.
The standardized precipitation index (SPI) is a new drought index based only on probability precipitation for any time scale (McKee et al., 1993). The SPI can be calculated in several time standards, such as 1, 3, 6, 12, and 24 months. In this study, the SPI-3 was used as a standardization analysis method for precipitation.
The SPI generally uses the gamma distribution to calculate its rainfall data standardization. The formula for calculating SPI is presented in equations (3) until (7).
By using the gamma function, the SPI could be obtained from the equation below:
With:
c_0=2.515517
c_1=0.802583
c_2=0.010328
d_1=1.432788
d_2=0.189269
d_3=0.001308
Furthermore, the values of the SPI are categorized per the classifications presented in Table III.
2.3.5 Calculation of Consecutive Dry Days
Consecutive Dry Days (CDD) is the maximum number of consecutive days with less than 1 mm of rainfall (Duan et al., 2017). The CDD is an effective measure of extreme precipitation and seasonal droughts and provides information on the duration of drought events. By knowing the CDD value, mitigation and adaptation efforts can be appropriately implemented to prevent and overcome drought disasters due to climate change. The CDD is an index developed by the Expert Team on Climate Change Detection and Indices (ETCCDIs) as one of the 27 climate change indices. This index is widely used in the detection and study of extreme climate events, especially droughts (Duan et al., 2017; Alexander et al., 2006; Vincent and Mekis, 2006; Oikonomou et al., 2010; Zhang et al., 2011; IPCC, 2012).
2.3.6 Calculation of FAR, POD, and RMSE
The False Alarm Ratio (FAR) measures how much the model makes a false detection. The value of FAR calculates the event frequency when the observation data does not show rain while the model data shows rain. The FAR value ranges from 0-1, where a small FAR value indicates the model’s good performance.
The Probability of Detection (POD) measures how much the model correctly detects the occurrence of rain. Therefore, the POD value will be high when the observation and model data show rain. A high POD value indicates the model’s good performance. The POD value ranges from 0-1.
The Root Mean Square Error (RMSE) value shows how big the error or difference is between the model data and the observation data. A low RMSE value indicates the model’s good performance.
3. Result and Discussion
Before being used for rainfall projections, the CCAM output data was validated and tested for performance in the control period (1991-2017). After being validated and tested, the model data output was corrected using a linear scaling method to obtain a better performance of the model data output. The model performance parameters were FAR, POD, and RMSE.
Table IV indicates that the FAR value after correction tends to decrease for almost all locations, although the decrease is relatively small. However, the FAR values for the model after self-correction in almost all locations ranged from 0.37-0.45. The POD values tend to increase when bias correction is performed by around 0.01-0.04, and this results in the POD values in almost all sample locations after self-correction ranging from 0.76-0.85 (Table IV).
Table IV FAR, POD, and RMSE Value of CCAM Output Data.
| No. | Sample points | FAR | POD | RMSE | ||||||
| Before correction | After correction | Difference | Before correction | After correction | Sub | Before correction | After correction | Difference | ||
| 1. | Balikpapan | 0.38 | 0.39 | -0.01 | 0.81 | 0.84 | 0.03 | 10.33 | 10.21 | -0.12 |
| 2. | Bandar Seri Begawan | 0.37 | 0.37 | 0 | 0.84 | 0.85 | 0.01 | 11.13 | 11.20 | 0.07 |
| 3. | Banjarmasin | 0.39 | 0.37 | -0.02 | 0.79 | 0.80 | 0.01 | 12.54 | 12.17 | -0.37 |
| 4. | Malinau | 0.33 | 0.33 | 0 | 0.81 | 0.83 | 0.02 | 10.61 | 10.58 | -0.03 |
| 5. | Palangkaraya | 0.40 | 0.39 | -0.01 | 0.76 | 0.79 | 0.03 | 13.79 | 14.32 | 0.53 |
| 6. | Pangkalan Bun | 0.38 | 0.37 | -0.01 | 0.73 | 0.76 | 0.03 | 13.43 | 13.65 | 0.22 |
| 7. | Pontianak | 0.46 | 0.45 | -0.01 | 0.83 | 0.85 | 0.01 | 15.00 | 15.26 | 0.26 |
| 8. | Samarinda | 0.45 | 0.44 | -0.01 | 0.76 | 0.79 | 0.03 | 11.31 | 11.62 | 0.31 |
| 9. | Serawak | 0.33 | 0.32 | -0.01 | 0.77 | 0.81 | 0.04 | 10.62 | 11.16 | 0.54 |
Table IV also shows the RSME-corrected CCAM data; lower values are observed in Balikpapan, Banjarmasin, and Malinau. This suggests that the correction bias can reduce the error between the model and observations by 0.12-0.36. However, in Bandar Seri Begawan, Samarinda, Pontianak, Palangkaraya, Pangkalan Bun, and Sarawak, the correction bias increased the model’s error by 0.07-0.54. This is due to the difference topography between all of the stations. The stations with high topography tend to have low errors compared to those with low topography.
The stations that experienced improved performance in RMSE reduction were located in highland areas (Fig. 1). Therefore, in this case, the linear scaling method can correct the rainfall value in the highland areas of Kalimantan.
Figure 2 shows the annual rainfall characteristics in Borneo: Figure 2a shows the average annual rainfall amount for Borneo Island. The northwest part of Borneo has the highest annual rainfall amount. The average annual rainfall amount in 1991-2020 reached 4,000 mm. Meanwhile, the northeast area has the lowest annual rainfall of around 2,500 mm. The high amount of rainfall in the Borneo northwest area is related to the cyclonic activity of the Borneo vortex and MJO phase 3 (Ichikawa and Yasunari, 2006; Isnoor et al., 2019; Purwaningsih et al., 2019).
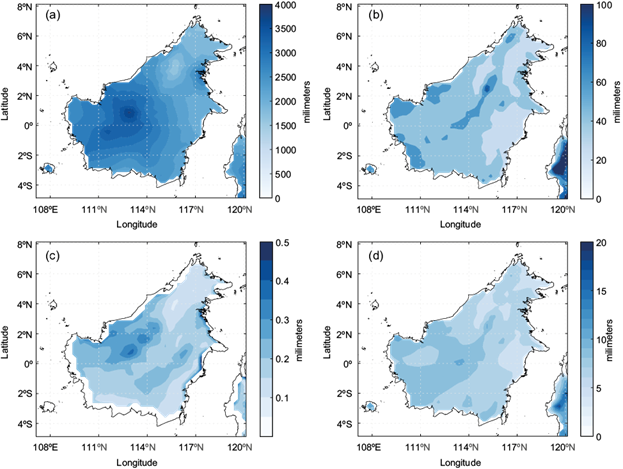
Fig. 2 Annual rainfall characteristics in Borneo in mm: (a) Sum/Amount, (b) Range, (c) Percentile-5, and (d) Standard deviation based on CCAM Data 1991-2020.
Furthermore, the rainfall range in Borneo is relatively high, reaching a maximum of 100 mm at a few points (Figure 2b). The majority of the rainfall range in this area is around 60 mm. The rainfall value is required to identify the range between the maximum and minimum rainfall values in a location to estimate whether the area experiences wet or dry days that alternate quite extremely or not.
Figure 2c presents the 5th percentile value and shows that most of the 5th percentile value of rainfall in Borneo is around 0.2 mm. The northwest Borneo area also has high annual rainfall and a high 5th percentile value. The 5th percentile value of the annual rainfall data in this area is 0.5 mm (Figure 2c). This indicates that this area tends to be wet as its 5th percentile value is quite large compared to other areas.
The standard deviation (SD) of rainfall data shows the diversity of data in the Borneo northwest area. In this study, the SD of rainfall has a reasonably high value, with the annual average value in this area being 11 (Figure 2d). This tends to be higher than in other areas on the island of Borneo. This high SD value indicates that the rainfall values in the northwest Borneo area are quite diverse.
Figure 3 exhibits the value of the annual rainfall amount in the projection/scenario period (2021-2050) and the percentage difference from the annual rainfall amount in the historical period (Figure 2a). Figure 3a shows that the rainfall in Borneo in the projection period (2021-2050) will significantly increase in almost all regions, especially in the western part of Borneo. This is reinforced by Figure 3b, which shows that most of Borneo’s eastern and central regions will experience more rainfall in the 2021-2050 period compared to the 1991-2020 period. The increase is relatively significant, reaching up to 25%. Meanwhile, the eastern part of Borneo, especially the northeast region, tends not to experience changes in the annual rainfall amount as it decreased by only 5% (Figure 2b). This indicates that for the annual rainfall amount, rainfall in the projection period (2021-2050) tends to be wetter than in the historical period (1991-2020). However, this will be further reviewed using the SPI (Standardized Precipitation Index) and CDD (Consecutive Dry Days) for drought analysis.
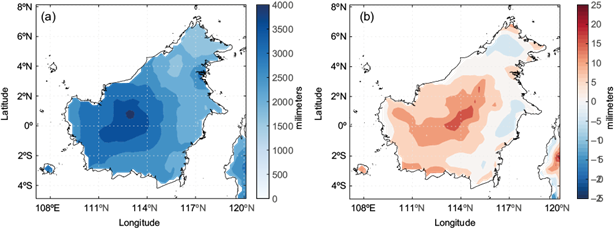
Fig. 3 (a) Annual rainfall amount in 2021-2050 in Borneo in mm, (b) Percent change of annual rainfall amount in 2021-2050 compared to 1991-2020.
The drought index was calculated using the SPI (Standardized Precipitation Index) from both periods (historical and scenario) to see and consider the possibility of an increase in the frequency of drought events in the future. The frequency of drought events in the sample points for both periods, historical period (1991-2020) and RCP (2021-2050), is presented in Table V.
Table V Frequency of drought events in sample points (several cities in Borneo).
| No. | Location | Drought Event Frequency | |
| 1991-2020 | 2021-2050 | ||
| 1 | Balikpapan | 114 | 77 |
| 2 | Bandarseri Begawan | 111 | 91 |
| 3 | Banjarmasin | 93 | 108 |
| 4 | Malinau | 107 | 94 |
| 5 | Palangkaraya | 96 | 81 |
| 6 | Pangkalan Bun | 79 | 109 |
| 7 | Pontianak | 85 | 91 |
| 8 | Samarinda | 108 | 93 |
| 9 | Sarawak | 111 | 91 |
The precipitation data for the calculation of drought was obtained from the model data. A drought is defined as an event where the local SPI-3 index is less than -0.5. Thus, the drought events calculated in the table are considered moderate to severe drought events.
According to Table V, three of the nine locations indicated an increase in the frequency of drought events. At the same time, the other 6 locations indicated a decrease in drought frequency. Locations that see an increase in the frequency of drought events tend to be in the south-central part of Borneo, such as Banjarmasin and Pangkalan Bun, as well as the west-south areas, such as Pontianak. Banjarmasin, Pangkalan Bun, and Pontianak are predicted to experience more drought events in 2021-2050 compared to 1991-2020. Meanwhile, other areas in the more northern part, such as Balikpapan, Bandar Seri Begawan, Malinau, Palangkaraya, Samarinda, and Sarawak, are estimated to experience a decrease in the frequency of drought in 2021-2050 compared to 1991-2020.
While the SPI considers drought events to be based on the distribution of monthly rainfall data, it is necessary to analyze drought events based on dry spells or consecutive dry day events. Therefore, this will be discussed further in the following paragraphs.
The number of consecutive dry days (CDD) measures the maximum length of dry days where the rainfall value is less than 1 mm. Figure 4a shows the CDD value in Borneo in the historical period of 1991-2020. The CDD value in the southern part of Borneo has the highest value and reached 30 days. This means that the southern part of Borneo in 1991-2020 averaged a maximum consecutive dry day length of about 30 days. This value is relatively high when compared to other regions. Other regions have CDD values that only reaches 10-15 days. The high CDD value in the southern part of Borneo is strongly suspected to be related to the rainfall pattern. The southern part of Borneo has a monsoon rainfall pattern (Arini et al., 2015; Aldrian and Susanto, 2007). In monsoon areas, rainfall is closely related to wind bends during the Asian and Australian monsoons. This area has one rainfall peak (when the rainfall is maximum) in the December-January-February season (DJF) and one rainfall valley (when the rainfall is minimum) in the June-July-August (JJA) season. This suggests that this area tends to experience high rainfall in the DJF season and low rainfall in the JJA season. In contrast to the central and northern Borneo areas, which have an equatorial rainfall pattern, this area has two peaks for the rainy season. Therefore, the maximum consecutive dry days in this area tend to be lower than in the southern part of Borneo.
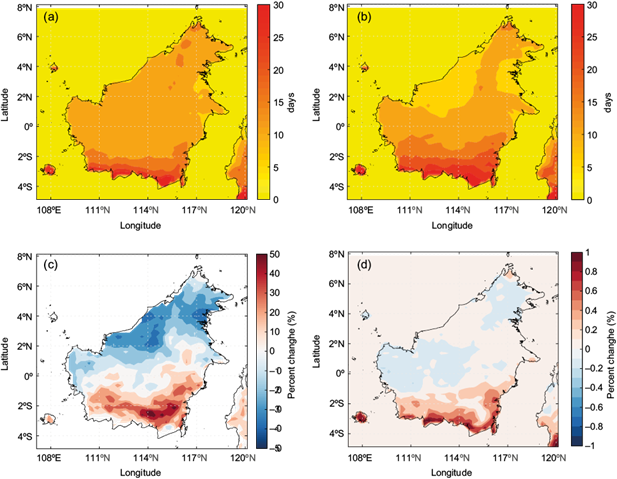
Fig. 4 (a) Mean of Annual Consecutive Dry Days (CDD) in History Period (1991-2020) (b) Mean of Annual Consecutive Dry Days (CDD) in RCP Period (2021-2050) (c) Percent change of annual mean CDD in 2021-2050 (RCP Period) and 1991-2020 (History Period) (d) Slope (b coefficient) of linear regression trend of CDD in 2021-2050.
The CDD projected from scenario RCP4.5 for 2021-2050 in Figure 4b shows a tendency to expand in the area and increase the value of CDD in the southern part of Borneo compared to 1991-2020. This is also confirmed by the plot in Figure 4c, where the percentage difference in rainfall values in this area in the period 2021-2050 compared to 1991-2020 reached more than 50%. Meanwhile, the central part of Borneo appears to have a constant CDD value of around 15 days (Figures 4b and 4c). The northern part of Borneo also has a declining CDD value (Figure 4c).
Figure 4d exhibits a plot of the linear regression slope of the CDD value in the years 2021-2050 on the island of Borneo. This figure shows that in 2021-2050, the slope value of the CDD in southern Borneo has a positive value where the value tends to increase from year to year. Meanwhile, the slope value is negative in other areas and leads to 0. This suggests that the CDD value in the Borneo area in the 2021-2050 period will remain constant.
Based on the above explanation and the SPI-3 calculation, it can be concluded that the northern part of Kalimantan is projected to have a lower drought frequency. Moreover, according to the results of CDD calculations, this area will have a shorter dry day duration. Conversely, southern Kalimantan is projected to have a higher drought frequency and longer dry days.
It should be noted that the above analysis is only based on climate condition projections that are based on the RCP 4.5 scenario with GCM ACCESS 1-3 inputs and downscaled by CCAM. This scenario is not based on changes in land use that occurred in Kalimantan, and the assumption of changes in conditions is only based on changes in radiative forcing of 4.5W/m2 as scripted by RCP 4.5. More massive scenarios and changes could occur if land use changes in Kalimantan occur a lot, especially related to forest fires, industrialization, and urbanization that have been happening on this island. Thus, climate change can significantly impact the variability of rainfall and drought events in Kalimantan if the spatial variability of land use changes more.
In addition, this scenario and study only used one GCM, ACCESS 1-3 CSIRO, which uses special land and cloud surface schemes in their atmospheric components. The results may be different if the principle of the ensemble with various GCM inputs is carried out. Therefore, a study on drought potential in Borneo as an impact of change with several GCM and ensemble methods should be done.
4. Conclusion
One of the impacts of climate change is an increase in the potential for drought. This paper describes the potential for future drought events as an impact of climate change in Borneo under the RCP4.5 climate scenario. According to our analysis, the northern part of Borneo will be wetter in the future. Therefore, the incidence of future drought (2021-2050) for this region will be lower than in the baseline period (1991-2020). In contrast, in the southern part of Borneo, future drought frequency events (2021-2050) are projected to be more frequent than during the baseline period (1991-2020). In the future (2021-2050), this region will also experience longer consecutive dry days than the northern part of Borneo. However, this study is based only on simulations and projections based on downscaling one GCM ACCESS 1-3 and RCP 4.5 scenario. It is necessary to carry out simulations and projections based on several GCMs with the ensemble method and consider land-use changes that may occur in Kalimantan.

