nueva página del texto (beta)
 Inglés (pdf)
 Artículo en XML
 Referencias del artículo
 Enviar artículo por email
 Citado por SciELO
  Similares en
SciELO
Similares en
SciELO 
 Permalink
1. Introduction
Mexican temperate forests are among the most biodiverse regions in the world (Myers et al., 2000), inhabited by about 7000 plant species (Villers-Ruiz et al., 1998; Galicia and Gómez-Mendoza, 2010). They constitute the most important center of diversity of the genus Quercus, accounting for approximately 30% of the described Quercus species (Valencia, 2004; Nixon, 2006). These forests are some of the most extended vegetation types in the country, and at the same time, one of the most affected by anthropogenic disturbance, as more than half of the country’s population is established on them (Galicia and Gómez-Mendoza, 2010).
Currently, land-use change is the main threat to temperate forests and biodiversity in general (Caro et al., 2022). Yet, it is expected that the effects of climate change in the form of longer and recurring droughts (but also increases in precipitation [e.g., Hubbart et al., 2016], higher temperatures, modification of fire patterns, larger populations of native and invasive pathogens, among others [Millar and Stephenson, 2015; Abram et al., 2021; Camarero and Gazol, 2022]), will represent an increasingly relevant threat for Mexican temperate forests in the nearby future (Villers-Ruiz and Trejo-Vázquez, 2004; Galicia and Gómez-Mendoza, 2010).
The synergic effects of climate change and deforestation are particularly challenging for temperate forests, as they facilitate the expansion of disturbance-related species, currently found in secondary and tropical affinity vegetations, to higher elevations formerly occupied by forests (Harrington et al., 1999). In Mexico, evidence of atypical forest decline at the lower altitude limits of temperate forests, likely induced by climate change, has already been collected (Sáenz-Romero et al., 2020). In addition, altitudinal migration might not be viable for some temperate forests in Mexico as the range shift of tropical forests over temperate ecosystems is expected in the lower limit of their altitudinal range, and migration to higher altitudinal levels might be limited by the altitude of most mountain ranges (Flenley, 1998; Villers-Ruiz and Trejo-Vázquez, 2004; Zacarías-Eslava and del Castillo, 2010). All over the globe, species with cold and temperate affinities are expected to reduce their distribution ranges due to a general reduction in mountain climates (García et al., 2014).
Additionally, it is expected that climate change will favor the appearance of climatic conditions that do not exist nowadays nor have existed in the geologically recent past (i.e., novel climates) (Williams et al., 2007). The effects of novel climatic conditions on present-day biodiversity distribution are difficult to forecast. Still, it is expected that non-analogous climatic conditions will also give place to new configurations of biotic communities (García et al., 2014). Consequently, changes in forest composition due to range shifts can result in a reduction of the natural services provided by forests, such as water provision, soil maintenance, and climatic regulation (Bonan, 2008).
Oaks (genus Quercus) constitute a fundamental, ecologically dominant component of diverse ecosystems in the northern hemisphere. Temperate forests dominated by Quercus are considered sensitive to climate change, as increases in temperature and changes in precipitation regimes can cause tree mortality (IPCC, 2014) and alter phenological and physiological processes related to population maintenance such as flowering, acorn production, germination, and seedlings establishment (Peñuelas et al., 2004; Pérez et al., 2013). Within this genus, Quercus candicans (Née) is one of the most widely distributed oak species in Mexico’s temperate forests. Although it is present in different types of forests, it has a marked preference for mesic and more temperate habitats, including cloud forests (Romero-Rangel et al., 2002; Olvera-Vargas et al., 2010; Rubio-Licona et al., 2011a). It is also a canopy-dominant species, so it can prevent the establishment of subordinate seedlings and influence all the processes that happen below its canopy. This dominance has been described in different regions along its distributional range (Rubio-Licona et al., 2011a; Olvera-Vargas and Figueroa-Rangel 2012; Álvarez et al., 2016). Q. candicans, is also relevant for conservation because of its regeneration capacity in forest edges with intermediate light conditions, which makes it a useful candidate for the restoration of mountain habitats (Díaz-Fleischer et al., 2010; González-Espinosa et al., 2011). Nevertheless, it is seriously threatened in some areas of its range as its habitat is being transformed into avocado plantations (Arizaga et al., 2009). For all reasons mentioned above, and due to the synergetic pressure added by global warming, it is important to assess the effects of climate change on a species that is widely distributed, ecologically relevant, and is currently experiencing anthropogenic pressure. Additionally, we consider that Q. candicans is sufficiently well studied regarding its ecological dominance and its preference for more temperate and mesic habitats (Olvera-Vargas et al., 2010; Rubio-Licona et al., 2011a) as to represent a useful study model.
In this study, we assessed the effects of climate change on the areas of climatic suitability for Q. candicans. We identified potential areas of contractions, expansion, and stability of suitable climatic conditions over three periods: 2030, 2050, and 2070 under two contrasting representative concentration pathways, RCP 4.5 and RCP 8.5 (van Vuuren et al., 2011). In addition, we assessed how the forecasted emergence of climates not found at present, also known as novel climatic conditions, affects the obtained climatic suitability predictions. Implications of our results related to the conservation of temperate forests in the face of climate change in Mexico are also discussed.
2. Methods
2.1 Occurrence records
We used Q. candicans (Née) presence records available in the Inventario Nacional Forestal y de Suelos (National Forests and Soils Inventory; INFyS for its acronym in Spanish) for the periods 2004-2007 and 2009-2014. This database is the main input for forestry estimates in Mexico. It contains updated information on the amount, location, and conditions of the Mexican forest resources’ overall land with woody vegetation, and its main objective is to support the national policy for sustainable forestry development (CONAFOR, 2015). The INFyS datasets contain information regarding the type of vegetation observed on the field and disturbance conditions, among other variables, measured at the sampling plots. The sampling plots have a circular extension of 1 ha (56.42 m radius) and the coordinates provided in the raw datasets correspond to the center of the plot (CONAFOR, 2015). As these records come from systematic sampling efforts, we assume errors regarding georeferencing and taxonomic identification to be minimal. However, we observed that the primary vegetation recorded in 20 plots (1.7% of plots with Q. candicans) was from some type of tropical forest. In the literature, it is well stated that Q. candicans is typical of temperate forests (González, 1986; Arizaga et al., 2009; Olvera-Vargas et al., 2010; Rubio-Licona et al., 2011a) and nowhere is it mentioned to inhabit tropical forests, so the records present in these plots were assumed misidentified and were removed. In addition, only one record per plot was kept, obtaining 569 unique records (Fig. 1).
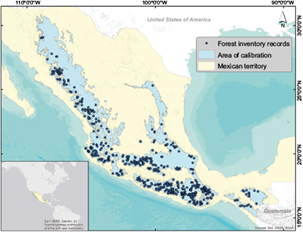
Fig. 1 Study region, Q. candicans occurrence records from the National Forest Inventory, and calibration area for ecological niche modeling.
A second data set was obtained from the Global Biodiversity Information Facility (GBIF, 2019). This set was used to calculate the models’ omission rate (Cobos et al., 2019). Records were obtained from 1961 onwards to match the temporal extent of the climatic variables; only records that had ‘Human Observation’ and ‘Preserved Specimen’ as the basis of records were downloaded. We obtained 909 geo-referenced presences. Additionally, duplicated coordinates within a grid of 1 km2 spatial resolution and outside Mexico (one record from the USA and one record from Guatemala) were discarded to obtain a dataset of 296 unique presence records.
2.2 Climatic data
Current climate conditions represent the normal climate period: 1961-2000 (Ruiz-Corral et al., 2018). Seven bioclimatic variables were generated from monthly layers of maximum temperature, minimum temperature, and precipitation. The generated layers were: (1) annual mean temperature (arithmetic average of the 12 months of mean temperature), (2) minimum temperature of the coldest month, (3) maximum temperature of the hottest month, (4) annual temperature range (difference between the annual mean maximum and minimum temperatures), (5) annual mean precipitation (arithmetic average of the 12 months precipitations), (6) precipitation of the driest month, and (7) precipitation of the wettest month. For the climate change scenarios, we used variables generated by Ruiz-Corral et al. (2016) for the periods 2021-2040 (2030), 2041-2060 (2050), and 2061-2080 (2070) on two contrasting scenarios, RCP 4.5 and RCP 8.5, a stable and high-emission pathway, respectively (van Vuuren et al., 2011). These variables were constructed through an assembly model of 11 General Circulation Models belonging to the Coupled Model Intercomparison Phase 5, reported in the 5th IPCC report (a detailed description of variables generation can be found in Ruiz-Corral et al. [2016]). For each period and scenario, we estimated the same seven bioclimatic variables used in the current climate. We expect these variables to be informative of the climatic conditions suitable to Q. candicans as they cover mean and extreme conditions of temperature and precipitation. We decided to use this source of climatic information for both current and future conditions because it represents more accurately the climatic conditions of the Mexican territory compared to global sources of information (Cuervo-Robayo et al., 2014; Ruiz-Corral et al., 2016). All raster layers had a 900-m pixel resolution and geographic coordinate system with Datum WGS 1984. All raster calculations were made on ArcMap 10.2.
2.3 Ecological niche modeling
The calibration area, or the M concept over the Biotic Interactions, Abiotic Conditions, and Movement (BAM) diagram refers to areas that have been accessible to the species via dispersal over relevant periods (Barve et al., 2011; Peterson and Soberón, 2012). To define this area, we used a combination of two approaches. First, we selected the Temperate Mountain Ranges of Mexico (INEGI, 2008) because it is the oaks’ center of diversity in the hemisphere due to orographic processes and climatic fluctuations in the geological past (Nixon, 1993). These mountain ranges are the Sierra Madre Occidental (SM-Occ), Sierra Madre Oriental (SM-Or), Sierra Madre del Sur (SM-Sur), Sierra Madre Centroamericana (SM-Centroamericana), Altos de Chiapas (A-Chiapas) and Sistema Neovolcánico Transversal (SN-Tr) (Fig. 2). Then, we created a 15-km buffer around all presence points and combined that with the Temperate Mountain Ranges polygons to define the area for model calibration. These buffers aim to include climatic conditions adjacent to sites that are very close to the Temperate Mountain Ranges edges. The size of the buffers was based on the median of the migration distances of North American tree species (ranging from 10 to 20 km) estimated by Iverson et al. (2004). Present climate variables were cropped to this calibration area.
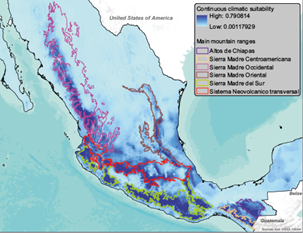
Fig. 2 Spatial prediction of Q. candicans climatic suitability at present. The main Mexican mountain ranges are displayed over the prediction.
We modeled the ecological niche of Q. candicans with the Maxent algorithm v. 3.4.1, a machine-learning technique that estimates a target probability distribution subject to a set of constraints obtained from the presence records and environmental data (Phillips et al., 2006). Model complexity within maxent parameters was tuned using the R (R Foundation, 2018) kuenm package (Cobos et al., 2019). Kuenm automatically runs a series of candidate models with different combinations of feature classes (FC) and regularization multiplier (RM) values and evaluates them in three steps: first by statistical significance, then by predictive ability, and last by model complexity, choosing the simplest models. We assessed model performance using the partial receiver operating characteristic (ROC) curve for statistical significance (Peterson et al., 2008), with omission rates (E = 5%) to evaluate predictive ability (Anderson et al., 2003), and the Akaike Information Criterion corrected for small sample sizes (AICc) to account for model complexity (Warren and Seifert, 2011). We selected the final model with the lowest AICc (14 441) from those that were statistically significant and had omission rates below 5%.
Using the kuenm package, we tested models using all possible combinations of the five FC allowed by Maxent (l, linear; q, quadratic; p, product; t, threshold; h, hinge) and sequential order of the RM values from 0.5 to 5 with 0.5 increases, having a total of 580 candidate models. The optimal parameters included ‘product’, ‘threshold’, and ‘hinge’ FCs and an RM of 2. Final models were fitted using these parameters and five k-fold cross-validation replicates. The calibrated model was transferred to the whole extent of the Mexican territory in both present-day and future climate scenarios. We allowed Maxent to clamp as well as extrapolate into novel conditions.
2.4 Climatic novelty
We assessed climatic novelty (i.e., climates not found at present) for the entire Mexican territory with the tool ExDet (Mesgaran et al., 2014), which identifies areas, where variables projected to future climatic scenarios, exceed present-day reference values as well as areas where future variables combinations are novel. ExDet identifies spatially two types of climate novelties: individual variables in future climate scenarios whose values leave the reference range of the same variable in the present time, as well as sites where, although the values of future climatic variables do not go beyond the reference range, they are combined in ways that do not exist in the present. In the present work, the novelty was only detected in the values’ range of single variables (i.e., not considering changes in the combination among variables).
2.5 Species range shift
We identified areas of contraction, expansion, and stability of Q. candicans climatic suitability by first transforming continuous output into a binary map using the 10th percentile training presence threshold, and then using the tool Distribution changes between binary SDMs of the SDM toolbox for ArcMap (Brown, 2014). Range shifts and novel climatic conditions maps were transformed into WGS 84 World Mercator coordinate system to obtain areas in metric units. We graphically visualized the changes in the most important variables between the present and future scenarios in the areas of expansion and contraction and assumed the species’ full dispersion capacity (Bateman et al., 2013). Lastly, we estimated how well-represented are present-day and future suitable areas for Q. candicans in the Federal Natural Protected Areas (CONANP, 2017) and the Priority Land Regions, terrestrial areas with considerably higher ecosystems richness (CONABIO, 2004) of Mexico.
3. Results
Suitable climatic conditions for Q. candicans occur over all the main mountain ranges of Mexico, with the largest contiguous region of high suitability at the SM-Sur, followed by the southern slope of the SN-Tr (Fig. 2). Partial ROC had a value of 0.79. The 10th percentile training presence threshold had an average value of 0.3164 across the five cross-validation replicates, and a mean test omission rate of 12.82 %.
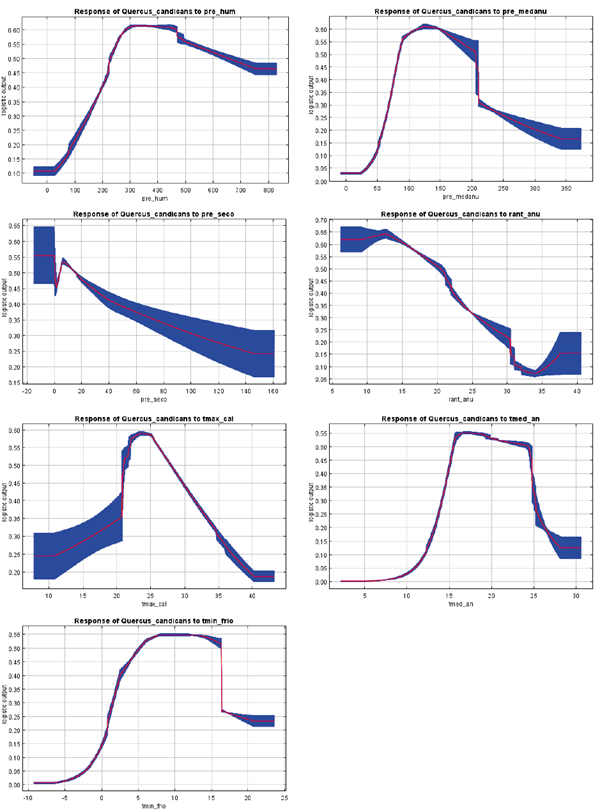
The variables that contributed the most to explaining Q. candicans climatic suitability were annual mean precipitation (30.5 permutation importance), annual mean temperature range (18.5 permutation importance), and minimum temperature of the coldest month (18.3 permutation importance). The response curves using only one variable at a time showed that maximum suitability values occur at approximately 125 mm of the annual mean precipitation (threshold values of 80-210 mm), at 12 °C of the annual temperature range (threshold values of 7-25 °C) and approximately 10 °C of the minimum temperature of the coldest month (threshold values of 2-16 °C). See all variables’ importance and response curves in Figure S1 and Table SI in the supplementary material.In general, Q. candicans potential distribution has high exposure and sensitivity to climate change (IPCC, 2014). Future potentially suitable areas (253 636 km2) with respect to the present climate reference period are predicted to experience a larger net reduction by 2030 and 2050 under RCP 4.5 (31 and 40%, respectively), compared to approximately 25% for both years under RCP 8.5. However, by the year 2070, net suitability contraction is larger under the extreme climate scenario RCP 8.5 (Table I). Changes in the most important variables of the model (Fig. 3) are not markedly different between the areas of expansion and contraction of climatically suitable conditions, except for the annual temperature range in RCP 8.5. In 2030, under a full dispersal scenario, areas of expansion are located in regions where the temperature range is projected to decrease more than in areas of contraction; by 2050, this difference is less pronounced and by 2070 areas of expansion and contraction are located at similar conditions of the annual temperature range. The plots also show larger differences between present and future conditions for all times and variables in scenario RCP 8.5.
Table I Estimated changes in climatically suitable habitats.
| Year | Contraction (%) | Expansion (%) | Net change (%) | |||
| RCP 4.5 | RCP 8.5 | RCP 4.5 | RCP 8.5 | RCP 4.5 | RCP 8.5 | |
| 2030 | 36.49 | 37.58 | 5.1 | 11.69 | -31.39 | -25.89 |
| 2050 | 46.07 | 38.95 | 5.84 | 14.39 | -40.23 | -24.56 |
| 2070 | 50.47 | 53.24 | 6.77 | 7.39 | -43.7 | -45.85 |
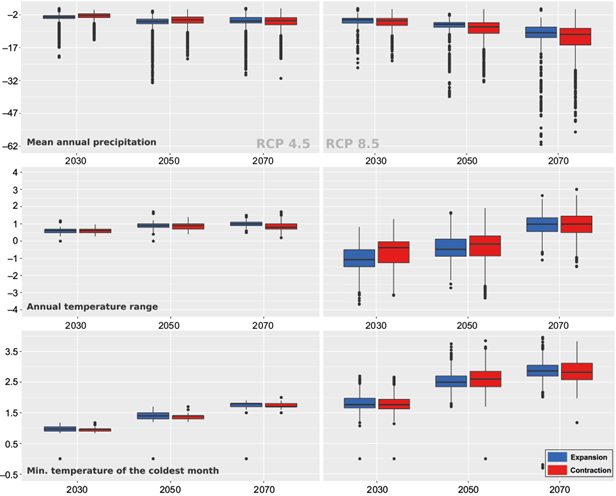
Fig. 3 Changes in the most important variables of the model at areas of expansion and contraction of climatic suitability. The left and right columns show variables at scenarios RCP 4.5. and 8.5, respectively. X-axes of the three predicted periods show changes in the displayed variables. Negative and positive values correspond to areas where variables’ values decreased or increased, respectively.
The rest of the variables (annual mean temperature, maximum temperature of the hottest month, and precipitation of the wettest and driest months) also display greater variation between areas of expansion and contraction in RCP 8.5, although their overall contribution to the model is smaller. See Figure S3 in the supplementary material for the rest of these plots.
The lower areas of the external (i.e., west-facing) slope of the SM-Occ are projected to become climatically unsuitable in the future (Fig. 4), whereas areas of range expansion are predicted on the leeward slope. Large areas of range contraction are projected in the southernmost region of the SM-Occ where it converges with the western portion of the SN-Tr. The area where SM-Occ and the SN-Tr converge shows important range contractions under RCP 4.5, but under an extreme scenario the pattern varies: a mosaic of areas of expansion, contraction and stability is projected for 2030 and 2050. However, by 2070 this mosaic gives place to larger continuous areas of stability and climate suitability contraction. In both emissions scenarios, range contractions are predicted along the edges of SN-Tr, where altitudes go from 0 to 3109 m with a mean of 1175 m. Nevertheless, a noticeable region of range expansion is predicted to emerge in the central-eastern part of this mountain range at an elevation above 2500 m, which could serve as a corridor for Q. candicans connectivity.
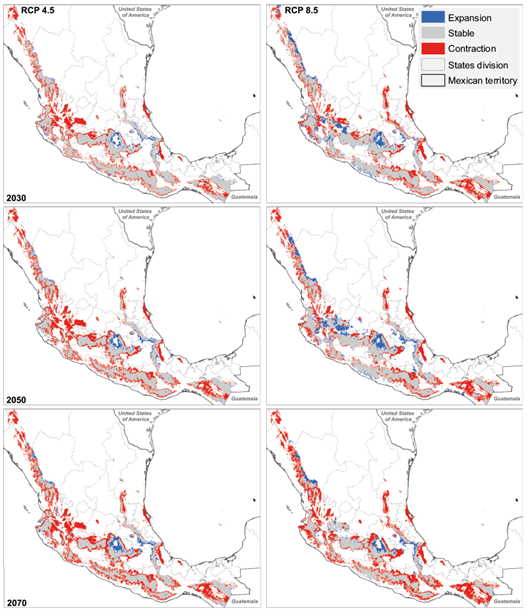
Fig. 4 Estimated changes of climatically suitable areas for Q. candicans. Red, grey, and blue polygons represent areas of climatic suitability contraction, areas that remain stable, and areas of suitability expansion, respectively.
In the SM-Sur there are slight range contractions by 2030 in both the windward and leeward slopes that increase by 2050 and 2070. Most of the higher interior sections of the SM-Sur remain stable. Large-range contractions are projected on the SM-Centroamericana. By 2070, almost all of this mountain range could become unsuitable to Q. candicans. On the other hand, A-Chiapas remains almost entirely stable during the three periods.
The SM-Or contraction of climatic suitability is projected mainly in the northern and central parts of this mountain range (Fig. 4); however, most of the region will remain stable during the three periods. A slight expansion of suitable area is projected in the leeward slope at the central part of the SM-Or.
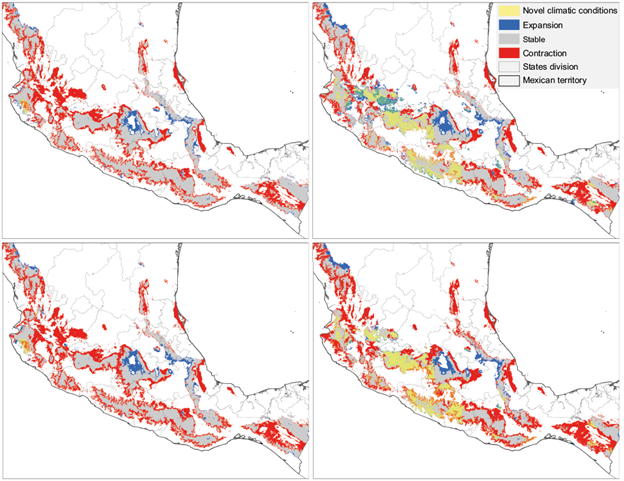
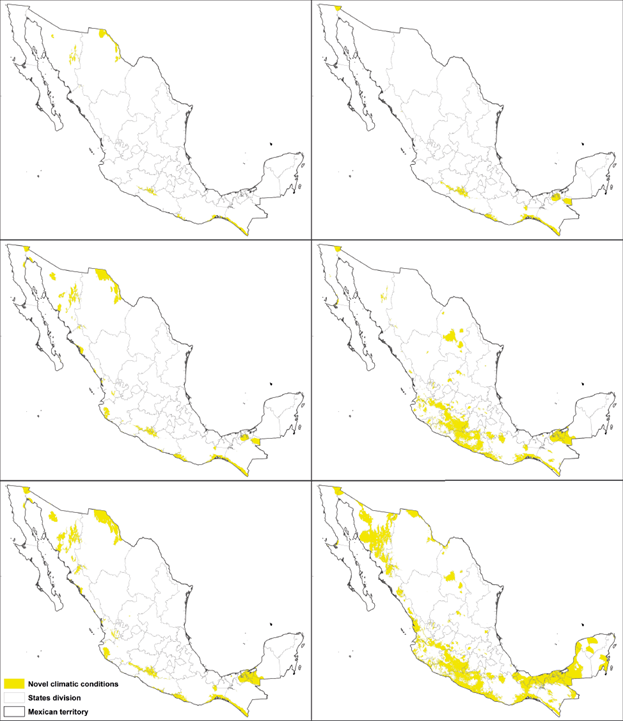
Fig. 5 Intersection of novel climate conditions with climatic suitability estimated changes. Red, gray, and blue polygons represent areas of climatic suitability contraction, areas of stable suitability, and areas of suitability expansion, respectively. Yellow polygons represent regions where novel climatic conditions intersect estimated suitability changes and stability.
3.1 Novel climates
In general, climate novelty is greater under a higher emissions scenario (. By 2070, novel climatic conditions extended over only 6.44% of the Mexican territory on RCP 4.5, compared to 19.29% on RCP 8.5 (see Fig. S2 in the supplementary material). In the temperate mountain ranges of Mexico, novel climates only occur in the years 2050 and 2070 in both scenarios. By 2070, novel climates could cover approximately 1 and 10% of this ecoregion on scenarios RCP 4.5 and RCP 8.5, respectively (Table II and Fig. S2).
Table II Proportional novel climate conditions in Q. candicans range shifts.
| 2030 | 2050 | 2070 | ||||
| RCP 4.5 (%) | RCP 8.5 (%) | RCP 4.5 (%) | RCP 8.5 (%) | RCP 4.5 (%) | RCP 8.5 (%) | |
| Novelty on expansion | 0 | 0 | 18. 8 | 20.9 | 15.6 | 5.9 |
| Novelty on stability | 0 | 0 | 74 | 77.0 | 79.1 | 91.7 |
| Novelty on contraction | 0 | 0 | 3.4 | 1.0 | 2.0 | 1. 8 |
| Novelty on absence | 100 | 100 | 3.8 | 1.1 | 3.3 | 0.7 |
| Total novelty extension | 100 | 100 | 100 | 100 | 100 | 100 |
| Percent of Mexican territory | 1.3 | 1.9 | 4.1 | 8.6 | 6.5 | 19.4 |
In RCP 8.5, novel climatic conditions overlap Q. candicans suitable area mostly on the western part of the SN-Tr, the western section of the SM-Sur, and less extensively over the convergence of the SN-Tr and the SM-Occ. In RCP 4.5, it is only in this region that climatic novelty intersects a small portion of the predictions generated. On RCP 8.5, the mosaic of areas of expansion, contraction, and stability located in the convergence of the SM-Occ and SN-Tr is highly intersected by climatic novelty. On the other hand, the expansion area that emerges in all periods and both scenarios in the central-eastern portion of the SN-Tr is not intersected by novel climates. Overall, the most dissimilar variables concerning present climate (i.e., type 1 novelties as defined in ExDet) were the minimum temperature of the coldest month, annual temperature range and mean annual temperature.
3.2 Additional analyses
The 10.8 and 15.9% of Q. candicans suitable habitat are represented in the Federal Natural Protected Areas and in the Priority Land Regions, respectively. These percentages will decrease to 7% in both scenarios by 2070 for Natural Protected Areas and to 6% on RCP 4.5 and 10% on RCP 8.5 for Priority Land Regions.
4. Discussion
Q. candicans is broadly distributed along all the main mountain ranges in Mexico, and climate change will reduce its distribution mainly in the foothill areas. This reduction will be higher over time, pushing Q. candicans to narrower areas; however, large areas are expected to serve as climate refugia for the species, and under a full dispersal scenario, suitability gain could allow climate connectivity between Q. candicans populations. Given its preference for mesic habitats within temperate forests, it is not unexpected that our results forecast a large reduction of climatic suitability across most of its present-day distributional range. Climate novelty spatially differs between both RCPs and is larger under RCP 8.5. We discussed how the effect of climate change could allow additional pressures on the species’ suitability.
Although not much is known about the specific eco-physiological characteristics of Q. candicans, existing studies describe some species traits that might cause additional vulnerability to climate change. For instance, its acorns contain fewer nutrient reservoirs than other oak species, making them less capable to germinate and establish under less suitable conditions (Rubio-Licona et al., 2011b). Increases in temperature and changes in precipitation regimes also affect its physiological performance by reducing stomatal conductance (Barradas et al., 2011). In general, oak species from temperate forests are expected to experience reductions in climatically suitable areas, although detailed responses are species-specific (Gómez-Mendoza and Arriaga, 2007; Galicia and Gómez-Mendoza, 2010; Guitérrez and Trejo, 2014).
We tried to gain some insights into the climatic variables’ contribution to the contraction of suitable conditions. Although we did not observe strong patterns, there seems to be a trend for warmer and drier climate over Q. candicans distributional range, particularly by the year 2070 in RCP 8.5, and more markedly in areas of suitability contraction (higher maximum and minimum temperatures, lesser precipitation). Given the climatic conditions in which the species typically inhabits, the projected changes in the variables would cause the areas of the species along the mountain foothills to contract.
Our models predicted some of the most striking contractions in the SM-Centroamericana, whereby in 2070 the region loses climatic suitability almost entirely regardless of the emissions scenario. By contrast, most of the A-Chiapas (~150 km northeast) stays suitable throughout the period analyzed. This entire region is in the two most biodiverse states of Mexico (Chiapas and Oaxaca) where, at the same time, most of the socio-ecological conflicts in Mexico have been reported (Rodríguez-Robayo et al., 2022). Yet, the large area of stability in A-Chiapas is not included in the National Protected Areas (NPAs) system, whereas several NPAs cover the area of contraction in the SM-Centroamericana, including zones of forest protection and the biosphere reserves of La Sepultura and El Triunfo. These reserves are part of the Mesoamerican Biological Corridor, an area of great ecological, social, and conservation importance with complex land-use change dynamics, including high rates of deforestation at different points in time (Díaz-Gallegos et al., 2008; Ramírez-Mejía et al., 2017). While this surely differs among species, at least for Q. candicans these protected areas are likely to stop functioning as a corridor.
Noticeably, the few areas predicted to maintain suitable climatic conditions in this region by 2070 correspond to areas now covered by montane cloud forests. These ecosystems have high ecological relevance because of their high biodiversity and the provision of hydrological ecosystem services, but lack sufficient protection at the global (Karger et al., 2021) and national levels (Ochoa-Ochoa et al., 2017). Our results suggest that cloud forests could function as climatic refugia for tree species such as Q. candicans.
The internal, higher areas of the SM-Sur also remain stable (to a lesser extent in RCP 8.5) and its eastern section does not intersect with novel climates in RCP 8.5. Additionally, Q. candicans populations still have high genetic diversity and relatively high connectivity across this region’s highly fragmented landscape (Oyama et al., 2018). This is also a region of conservation interest, as it is the most biodiverse mountainous region of the country and the second in extension, but at the same time it is the one with the less remaining primary vegetation, most of which is not included in natural protected areas (Cantú-Ayala et al., 2013). Hence, these two conditions (on one hand high biodiversity value and likely emergence of climatic refugia for forest mesic tree species like Q. candicans, and on the other extensive vegetation disturbance), make SM-Sur an area where habitat restoration efforts should be implemented. The SM-Or also holds an important area of stability for Q. candicans in both climatic scenarios (although more markedly in RCP 4.5).
The most noticeable area of suitability expansion, not intersected by novel climates, is located in the southwest part of the Estado de México (central section of the SM-Transversal). However, this region is one of the most disturbed and deforested regions of the country (Pineda et al., 2009), so it is unlikely that new populations can establish if this trend continues. Further, targeted research could emphasize the relevance of this region for conservation and restoration efforts. For instance, other works have also forecasted the emergence of climate refugia for forest tree species in some of the mountains in this region (Manzanilla-Quiñones et al., 2019).
Recent evidence has pointed out that the effect of climate change on temperate forests might already be evident in some of the main Mexican mountain ranges (Sáenz-Romero et al., 2020). Forest decline caused by diseases, pests and/or defoliation has been observed for several years now, mainly on the lower limits of temperate forests in the SM-Occ and SM-Transversal. The replacement of temperate vegetal communities for more arid-adapted communities in altitudinal gradients has been observed at some sites and the trend is expected to continue under climate change scenarios (Zacarías-Eslava and del Castillo, 2010). This trend, of which some changes are already observable (Sáenz-Romero et al., 2020), has also been predicted for the entire Mexican territory (Villers-Ruiz and Trejo-Vázquez, 2004).
The reduction of climatic suitability, particularly in the case of long-lived trees, does not mean that species will become immediately extinct once conditions have changed, but that conditions for population regeneration will stop being suitable, so the hypothetical local extinction of the species will likely take a longer time (Sinclair et al., 2010), as physiological and phenological processes related to regeneration are negatively (but slowly) influenced by climate change. The ecological niche model (ENM) likely displays a time lag between the changes in climatic suitability and the speed at which tree species can migrate upslope (Scherrer et al., 2020). In addition to changes in climatic conditions, population dynamics and to a lesser degree dispersal limitation seem to have a large influence on trees’ migration rates. Although consistent information on population dynamics of widely distributed tree species like Q. candicans is rarely available, potential conservation strategies informed by ENM in areas where the expansion of suitable conditions emerges at higher altitude sites, as is the case for all the expansion areas forecasted by our models, should consider such dynamics and time lags. Protection of altitudinal gradients in mountainous areas is key for effective protection under climate change (Elsen et al., 2018). Still, it is insufficient in Mexico (Cantú-Ayala et al., 2013; Elsen et al., 2018). Our forecast of potential contraction of Q. candicans range in national Protected Areas and Priority Land Regions emphasizes the need to consider the patterns of migration and redistribution of species if conservation efforts are to be effective under climate change.
Finally, it must be considered that the appearance of novel climatic conditions is higher under a high emissions scenario. This situation is particularly evident over the SM-Transversal, bringing additional uncertainties to a region where anthropic activities have highly transformed the landscape. This shows that with larger climatic change, it is less likely to obtain useful forecasts of biodiversity responses through accessible, low-cost tools such as correlative ecological niche modeling.
5. Conclusions
The results obtained in the present work show that climatic suitability for Q. candicans is expected to decrease in the following decades because of climate change. Although other factors besides climatic suitability (such as biotic interactions, adaptation, or historic dispersal) determine the actual distribution of a species, the suitability of climatic conditions is the main factor at large scales (Peterson et al., 2011). As Q. candicans is a canopy-dominant species, changes in its distribution can contribute to triggering further changes below the canopy, influencing ecological processes in the rest of the forest. In addition, it is a species representative of moist and temperate mountain habitats, prone to be restricted under climate change, and which provides important ecosystem services, particularly hydrological, to human societies. These habitats are currently not sufficiently represented in natural protected areas (Cantú-Ayala et al., 2013), and our results indicate that a further reduction in species representability can be driven by the effects of climate change. Another relevant finding is that novel climatic conditions increase considerably with higher emission scenarios. Thus, the greater the climatic changes, the harder it will be to forecast ecological responses. In our case, this is reflected in the interpretation of the modeled predictions, but in a wider context, it extends to all conservation efforts.