


 nueva página del texto (beta)
 Inglés (pdf)
 Artículo en XML
 Referencias del artículo
 Enviar artículo por email
 Citado por SciELO
  Similares en
SciELO
Similares en
SciELO 
 Permalink
1. Introduction
During winter there are different atmospheric circulation patterns over Brazil that produce several impacts on the weather, most of them related to significant anomalies of temperature and precipitation. Most of the Brazilian regions are situated over tropical and subtropical areas; consequently, they are influenced by different synoptic weather patterns.
In the climate sciences field regarding South America, until now only individual synoptic meteorological cases related to different meteorological phenomena over Brazil, or climatological analysis based on mean meteorological fields, are well known. However, there are not many scientific analyses that synthesize objectively the daily synoptic variability. Within the academic and scientific community, the most important synoptic weather systems that influence the weather in the baroclinic region of Brazil are well known (Escobar et al., 2019a). Most of them (fronts, cyclones, anticyclones, troughs) are practically the same during winter. However, the synoptic patterns are different because they are determined by the position and intensity of the synoptic weather systems. It is important to note that synoptic weather patterns are different from synoptic weather systems. The first ones show the atmospheric circulation determined by the position and intensity of the latter. Therefore, the different weather conditions, especially those related to severe meteorological conditions (heavy rainfall or persistent rain, for example), can be determined through the interpretation of the different synoptic weather patterns.
The cold fronts (Andrade, 2005; Foss et al., 2017; Escobar et al., 2019a) are the main synoptic weather systems identified among the daily synoptic weather patterns during wintertime over Brazil. During this period, the cold fronts reach more frequently most of the southern and southeastern regions of Brazil and parts of other regions within the country (Cavalcanti and Kousky, 2009; Foss et al., 2017).
Several of these cold fronts are associated with cold surges, producing significant decreases in air temperature and wide frost over most of the southern region of Brazil, most of Mato Grosso do Sul (MS) and São Paulo (SP) states, and the southern part of Minas Gerais (MG) state (Parmenter, 1976; Marengo et al., 1997; Escobar, 2007; Vera e Vigliarolo, 2000; Lupo et al., 2001; Satyamurty et al., 2002). Occasionally (once or twice a year) the cold fronts associated with cold waves in Brazil also produce snowfall in the mountainous areas of the states of Rio Grande do Sul (RS) and Santa Catarina (SC) (Escobar et al., 2006; Dolif et al., 2015).
When the cold surges invade the tropics and affect the Amazonic region, they are called friagens (cold surges) and produce a great impact on the population due to the decrease in the temperature and humidity (Oliveira et al., 2004; Marengo et al., 1997; Ricarte, 2012; Escobar et al., 2019b).
The cold fronts begin to lose their thermal contrast as they move towards lower latitudes, more specifically to the south and east of Bahia (BA) state. Due to these fronts losing their characteristic of classical cold fronts, Kousky (1979) called them subtropical fronts.
Most cold surges are associated to the passage of mid-latitude waves, which interact with the Andes mountains and propagate equatorward (Garreaud, 2000; Vera and Vigliarolo, 2000; Lupo et al., 2001; Cavalcanti and Kousky, 2003; Escobar et al., 2004).
Escobar (2007), Reboita et al. (2015), and Escobar et al. (2019b) applied principal components analysis (PCA) to identify the main synoptic patterns related to cold air incursions and/or frost occurrence in Brazil. They showed that the most typical atmospheric circulation pattern related to these cold events is the presence of a large ridge in mid-levels over the Pacific Ocean near the coast of South America associated to an intense surface post-frontal anticyclone favoring cold air advection from the south.
The North-Western Argentinean Low (NAL) is one of the most characteristic systems of low-level atmospheric circulation in South America. It is usually located around 30º S leeward of the Andes Mountains and has had an important role throughout the year in Brazil, principally during the rainy season (Seluchi and Marengo, 2000; Seluchi et al., 2003; Marengo et al., 2012; Escobar and Seluchi, 2012).
During winter, the NAL has a more intermittent behavior because it is affected by the approach of upper-level troughs that generate heating through forced orographic subsidence (Ferreira, 2008).
Extratropical cyclones are other of the most important baroclinic systems that affect the weather in South America around the year. In particular, during winter, the cyclogenetic area is located close to the coast, between 25 and 35º S (Taljaard, 1972; Gan and Rao, 1991; Sinclair, 1995).
Most of the extratropical cyclones that occur over eastern South America are caused by the arrival of an upper-level trough, which propagates across lower latitudes triggering a quasi-stationary front located over eastern South America (Sinclair, 1995).
The cold fronts related to these extratropical cyclones are often associated with strong winds and heavy rainfall, producing a great impact on the population of the states of RS and SC (Avila et al., 2016).
The South Atlantic Subtropical high (SASH) is another important meteorological system that plays a significant role in the regional climate of Brazil. It is located on the western side of the South Atlantic basin, affecting cloudiness and precipitation around the year over southeastern South America.
This semi-permanent high-pressure system undergoes modifications due to different baroclinic systems (troughs, cold fronts, cyclones) that pass through the ocean and affect the coast of south and southeastern Brazil.
Sun et al. (2017) described the annual cycle of the SASH and found that during winter it is less intense and appears closest to the equator and the western side of the South Atlantic basin.
The western part of the anticyclone enters the mainland affecting all the and central-west regions, as well as part of southeastern the north and northeast regions of Brazil. The subsidence associated with this dynamic high-pressure system prevents the formation of clouds, characterizing this period as a dry season (Rao and Hada, 1990). In winter, the low-level atmospheric circulation related to the SASH also determines the establishment of the South American Low-Level Jet (SALLJ), which brings maritime tropical air from the Atlantic Ocean into southern Bolivia, northeastern Argentina, Paraguay, Uruguay, and the western part of the southern region of Brazil (Marengo et al., 2004; Castañeda and Ulke, 2015; Santos and Reboita, 2018). The low-level atmospheric circulation associated with the SALLJ also contributes to the formation of mesoscale convective systems (MCS), which produce heavy rainfall over southern Brazil and bordering countries (Salio et al., 2007).
In summary, concerning the daily analysis of the weather during winter, it is possible to identify more than one atmospheric circulation pattern associated with different kinds of synoptic-scale meteorological phenomena.
Due to this daily variability in atmospheric circulation patterns, the objective of this study was to identify the principal modes of daily variation of atmospheric circulation at low and middle levels of the atmosphere to identify the main synoptic patterns that influence the weather during this period.
The main synoptic patterns identified in this work may also help weather forecasters to improve the forecast of extreme weather episodes during winter in Brazil.
2. Data and methodology
2.1 Data
Sea level pressure (SLP) and 500 hPa geopotential height (GH500) at 12:00 UTC from the National Center for Environmental Prediction (NCEP) Climate Forecast System Reanalysis (CFSR) were used for the period 1979-2020. The CFSR v. 1 (CFSv1) (Saha et al., 2010) covers the period from January 1979 to March 2011. The CFSR v. 2 (CFSv2) (Saha et al., 2014) was released in March 2011, and it has been running operationally since then. Both (CFSv1 and CFSv2) have a horizontal native resolution of T382 (~38 km). Their horizontal resolution is 0.25º × 0.25º latitude/longitude between 10º S and 10º N, reducing gradually towards the poles, reaching 0.5º between 30º N and 30º S.
The study area is is encompassed between 5º-40º S and 30º-80º W, and the time period includes the months from June through August (wintertime in Brazil) (Fig. 1).

Fig. 1 Map of South America with abbreviations for Brazil’s states. RS: Rio Grande do Sul, SC: Santa Catarina, PR: Paraná, SP: São Paulo, RJ: Rio de Janeiro, ES: Espírito Santo, MG: Minas Gerais, MS: Mato Grosso do Sul, MT: Mato Grosso, GO: Goiás, BA: Bahia, SE: Sergipe, AL: Alagoas, PE: Pernambuco, PB: Paraíba, RN: Rio Grande do Norte, CE: Ceará, PI: Piauí, MA: Maranhão, TO: Tocantins, PA: Pará, AM: Amazonas, AC: Acre, RO: Rondônia.
2.2 Methodology
One of the main goals of synoptic climatology is to understand the relationship between atmospheric circulation patterns and meteorological conditions at surface through the use of objective classification methods. At the beginning of the 20th century, all the methods used to classify atmospheric circulation patterns were manual and therefore subjective.
From the decade of 1960 onwards, these subjective methods have been replaced by objective techniques, such as, for example, Lund’s correlation methodology (Lund, 1963). However, there are even more objective and mathematically efficient methods derived from the eigenvector technique (Preisendorfer, 1988).
Principal component analysis (PCA) is an objective classification method derived from the eigenvector technique and has been used particularly in research related to synoptic climatology. Yarnal (1993) presented a complete description of the PCA technique and its applications in meteorological and climatological variables.
The physical interpretation of the results obtained with this kind of methodology has been discussed for many years by several authors (e.g., Huth et al., 2008).
Currently, the application of PCA to the creation of synoptic classifications has become increasingly consolidated over time and it has been used by different authors that showed robust and consistent results. Therefore, PCA is the most appropriate technique to analyze the synoptic variability because it is used to classify synoptic weather patterns.
In the present study, a synoptic classification was performed to identify the main atmospheric circulation patterns at surface and at 500 hPa.
PCA was applied with a correlation matrix in T-mode (Green and Carrol, 1978; Richman, 1986; Huth et al., 2008; Escobar et al., 2016; Escobar and Reboita, 2022). Thus, in this approach, each variable is a spatial field of a given meteorological variable (SLP or GH500), and observations correspond to grid points. In this way, T-mode allows identifying subgroups or types of fields with the same spatial structure.
The matrices are composed of SLP and GH500 data and have 1261 cases × 7171 variables for June and 1302 cases × 7171 for July and August. Therefore, the cases correspond to days (1260 or 1302), and variables are the selected grid points over the used domain (7171). The PCA methodology was applied separately for each month (June, July, and August) and each meteorological variable (SLP and GH500).
After the application of the PCA, Varimax rotation (Richman, 1986) was performed. This methodology is useful to redistribute the total variance of the data among the components to emphasize the physical meaning of the principal components (PCs) generated (Richman, 1986). The results and the variance explained by the PCs depend on the number of them retained in rotated solutions. The optimum number of rotated PCs was determined by the eigenvalue 1.0 rule (Kaiser, 1958; Richman et al., 1992). The results showed, for the two analyzed levels (SLP and GH500), that the number of significant retained PCs represented a cumulative percentage of explained variance greater than 75%.
The real meteorological fields correlated significantly with the PCs were determined through temporal series of factor loadings that represent the correlations between the variable used (real meteorological field) and each PC (Richman, 1986).
The analysis of the component loadings allows the evaluation of the representative patterns (obtained from PCA) as real atmospheric circulation fields (registered in the reanalyses). Values of component loadings closer to 1 represent atmospheric circulation fields similar to the obtained pattern (Harman, 1976; Cattell, 1978).
In addition, the explained variance of each PC found by such methodology can be calculated through the component loadings. Therefore, the frequency of each PC can be determined through the explained variance. The higher the percentage of the explained variance, the higher the frequency of the PC. That means that the contribution (weight) of each PC during the three analyzed months can be determined.
The spatial field of the PCs can be interpreted in both their positive and negative phases (Compagnucci and Salles, 1997). PCs are related to two different synoptic patterns that have the same shape. For positive values of component loadings (direct mode), PCs have the same sign as the meteorological variable under study. For example, positive (negative) values of sea level pressure, represent high (low) pressures in the PCs. Conversely, for negative values of component loadings (indirect mode), PCs have the opposite sign as the real meteorological fields. Therefore, positive (negative) values represent low (high) pressures. In this study, the values of component loadings (figures not shown) were positive, meaning that the PCs have the same sign as the meteorological fields (weather type).
To study the atmospheric circulation variability of the whole troposphere related to each of the analyzed months, the PCs of the two analyzed levels (SLP and GH500) were related. First of all, a subjective procedure was performed through a visual examination of the PCs obtained at each level analyzed. Because most of the winter synoptic weather patterns in Brazil show a baroclinic vertical structure (Lackmann, 2015), we could rapidly find the correspondences between the low (SLP) and middle (GH500) levels, due to the personal experience in the weather forecast.
Finally, an objective procedure based on the correlation between the series of component loadings of each PC identified at each level (figures not shown) was applied to confirm the visual examination results.
3. Results
3.1 Sea level pressure
The analysis identified six PCs at surface for each analyzed month that explain between 87.2 and 88.4% of the total variance, with the first four PCs representing approximately 80% of this total (Table I).
Table I Percentages of explained variance and the cumulative percentages (P. C.Var) explained by the PCs retained at surface for each of the analyzed months.
| PCs | June | July | August | |||
| P. Var | P.C. Var. | P. Var. | P.C. Var. | P. Var. | P.C. Var. | |
| 1 | 26.4 | 26.4 | 23.2 | 23.2 | 29.7 | 29.7 |
| 2 | 21.5 | 47.9 | 21.0 | 44.2 | 20.6 | 50.3 |
| 3 | 15.8 | 63.7 | 18.9 | 63.1 | 17.2 | 67.5 |
| 4 | 14.5 | 78.2 | 16.9 | 80.0 | 11.8 | 79.3 |
| 5 | 5.2 | 83.4 | 4.9 | 84.9 | 5.5 | 84.8 |
| 6 | 3.8 | 87.2 | 3.5 | 88.4 | 3.4 | 88.2 |
PCs: principal components; P. Var.: percentages of explained variance; P.C. Var.: cumulative percentages of explained variance.
Characters in bold highlight the cumulative percentages of explained variance.
This means that there are no significant differences in synoptic variability between each of the three months analyzed.
The temporal series of factor loadings associated with the first five PCs (figures not shown) presented values greater than 0.7. This means that these PCs have a similar configuration to real weather patterns. The sixth PC, which also represents real meteorological situations, was not considered in this work as its series of component loadings presented values lower than 0.4 (Harman, 1976; Cattell, 1978).
The surface synoptic patterns identified during winter (Fig. 2) are practically the same for all months, but with some differences in the positioning of the different meteorological systems and the contribution or weight of each one of them in each of the analyzed months.
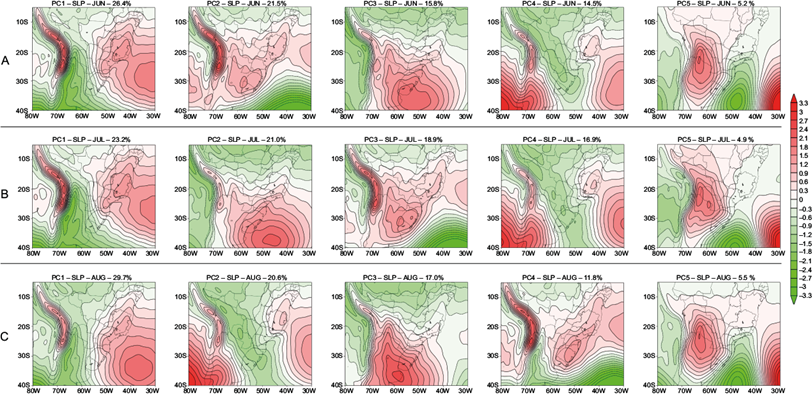
The most frequent surface synoptic pattern observed for all analyzed months is related to the climatological mean-field (CMF) (Marengo et al., 2012), with the presence of the SASH (PC1 in Fig. 2a, b, c) located approximately at 30º/35º S, 30º/38º W.
During June and July this synoptic pattern represents 26.4 and 23.2% of the total variance, respectively (Table I), and in August this synoptic pattern is the most frequent of all, representing 29.7% of the total variance (Table I).
During winter, cold fronts are more frequent at all latitudes (Foss et al., 2017; Escobar et al., 2019a); however, in August the cold fronts are less frequent than in June and July. In this way, the SASH becomes more stable and more frequent in its climatological position, contributing more significantly to the total variance. In August, the SASH shows a displacement to the south with respect to June and July, locating its center approximately around 35º S, 37º W. On the other hand, during June and July a trough can also be seen in the Atlantic Ocean with a southwest-northeast orientation between SC and RJ states. This trough contributes to the establishment of a continental flow in a northern/northwestern direction over part of SP and RJ states.
At the same time, during the analyzed period this synoptic pattern shows a low-pressure area on the continent, extending from the south of Bolivia towards the center of Argentina. Sometimes, this trough intensifies and forms a cyclone, leeward of the Andes, which is probably related to the NAL. In this case, this low-pressure system acquires more dynamic characteristics due to its relation to a trough in the middle levels (Escobar and Seluchi, 2012).
With such a surface synoptic pattern, the western part of the SASH enters the continent affecting a great part of the southeastern and central-west regions and part of the north and northeast regions of Brazil. Thus, a wide area of these regions is dominated by the subsidence and determines this analyzed period as a dry season (Rao and Hada, 1990; Sun et al., 2017).
On the other hand, the SASH produces persistent easterly winds over the eastern part of the northeastern region of Brazil that contribute to intensifying the rains in this area. According to Molion and Bernardo (2002), the maximum precipitation over the east of northeastern Brazil during winter could be related to the maximum convergence of the trade winds with the land breeze.
Easterly wave disturbances are other meteorological systems that cause heavy rains in this region (Pereira et al., 2014), usually propagating into the trade winds generated by the SASH and showing wave configurations in the wind and pressure fields (Berry et al., 1945).
The surface synoptic pattern associated with the presence of a cold front in southeast Brazil during winter is represented by PC2 (Fig. 2a), PC3 (Fig.2b) and PC4 (Fig. 2c), explaining 21.5, 18.9 and 11.8%, respectively, of the total variance (Table I), which means that in June and July this pattern is approximately twice as frequent as in August. The frontal system is located in the Atlantic Ocean, approximately between SP and RJ states, and the migratory post-frontal anticyclone appears covering the southern region of Brazil, the northeast of Argentina, and southern Paraguay.
The atmospheric circulation related to this surface synoptic pattern determines one of the principal conceptual models associated with cold air incursions in the southeastern and central-west regions of Brazil (Escobar, 2007; Reboita et al., 2015; Escobar et al., 2019b).
The surface synoptic classification during winter identified another of the most frequent patterns related to cold waves in Brazil (Ricarte, 2012; Reboita et al., 2015; Lanfredi e Camargo, 2019; Escobar et al., 2019b) which is represented by PC3 (Fig. 2a), PC2 (Fig.2b), and PC3 (Fig. 2c), explaining 15.8, 21.9, and 17.0%, respectively, of the total variance (Table I). The center of the post-frontal anticyclone is located around 36º S during the period. In June and July, this high-pressure system is over the Atlantic Ocean at around 52º and 45º W, respectively, and in August it is centered over the continent, over Buenos Aires province (Argentina). This surface pattern is also associated with the presence of a frontal system on the coast between Espirito Santo (ES) and Bahia (BA), which contribute to producing fairly cloudiness and rain over a wide area encompassed by the ES state, central and eastern MG state, and southern and eastern state BA state. This frontal system was designated as a subtropical front by Kousky (1979) since it shows a weak horizontal temperature gradient Escobar et al., 2019a).
Sometimes, subtropical fronts continue advancing across the Atlantic Ocean toward lower latitudes, close to the states of Sergipe (SE), Alagoas (AL), Pernambuco (PE), Paraíba (PB), and Rio Grande do Norte (RN). In these situations, the convergence increases along the coast of these northeastern states, producing extreme rainfall events and consequently severe impacts on the population. According to Silva and Molion (2002), the incursions of subtropical fronts in equatorial latitudes is another important mechanism that causes easterly wave disturbances. These systems are more frequently observed over the state of BA, and may even reach AL in some cases (Fedorova et al., 2016).
The atmospheric circulation related to this synoptic pattern usually shows both the subtropical front and the post-frontal migratory anticyclone slowly moving to the east, establishing a blocking configuration (Sinclair, 1996). This synoptic pattern is similar to the one identified by Escobar et al. (2019b) when they carried out a synoptic climatology associated with friagem episodes in the city of Cuiabá (Mato Grosso) (MT).
The surface synoptic pattern related to the presence of a cold front in southern Brazil during winter is represented, by PC4 (Fig. 2a, b), PC4 (Fig. 2b), and PC2 (Fig. 2c), explaining 14.5, 16.9 and 20.6%, respectively, of the total variance (Table I).
The cold front is located over RS state, extending approximately between the Atlantic Ocean and Bolivia. This synoptic pattern also shows a trough in the Atlantic Ocean with a southwest-northeast orientation between SC and RJ states, which contributes to the establishment of a continental flow in a northern/northwestern direction over part of SP and RJ states. The surface atmospheric circulation pattern also determines a pre-frontal meteorological situation over SP and RJ states. The post-frontal anticyclone associated with the cold front penetrates through central and northern Argentina, southern and western Paraguay, southern Bolivia, and the extreme western part of RS. The southern incursion of this migratory high is favored by the Andes Mountains, which facilitate the channeling of cold air to their east (Garreaud, 2000). This surface synoptic pattern also favors the formation of a trough over the Pacific Ocean off the coast of Chile, approximately between 25º and 33º S, associated with low cloud cover and episodes of atmospheric pollution (Garreaud et al., 2002).
The above-mentioned synoptic pattern also shows an area of high pressure between the center-east of MG, ES, and southern BA, associated with an extension of the SASH that appears over the Atlantic Ocean further away from the continent. This area of high pressure contributes to inhibiting the formation of rain in this part of the southeastern region of Brazil.
Finally, the last most important surface synoptic pattern observed during winter is related to a cyclogenesis process (PC5 in Fig. 2a, b, c), with the presence of an extratropical cyclone in the Atlantic Ocean, approximately at 30º/40º S, 48º W.
During June, July, and August, this pattern represents 5.2, 4.9, and 5.5% of the total variance, respectively (Table I).
The cold front related to this extratropical cyclone appears approximately over SP states and it extends to the south of Rondônia (RO) state. Simultaneously, there is a high-pressure system over the continent located to the northwest of the extratropical cyclone, between northern Argentina and Bolivia. Both systems (the cyclone and the anticyclone) determine a strong pressure gradient over a great part of south Brazil and the states of MS and SP. Thus, this surface synoptic pattern allows the identification of a wide area with southerly winds over a great part of central-south Brazil with the cold air mass entering through the south of the northern region and determining a friagem episode. This synoptic pattern is similar to the one identified by Escobar (2007) and Escobar et al. (2019b) when they carried out a synoptic climatology associated with cold surges in SP city and friagens in central-west Brazil, respectively.
3.2 Geopotential height at 500 hPa
Since surface systems reflect the atmospheric circulation observed in the middle troposphere (Petterssen, 1956; Inness and Dorling, 2013), the PCA was also applied to the 500 hPa level to determine the vertical structure of the main synoptic patterns during winter. It is important to emphasize that surface systems follow the wind movement at the 500 hPa level and consequently contribute to the weather forecast (Sutcliffe, 1947).
The analysis of the results shows four PCs for each analyzed month that explained approximately between 94 and 95% of the total variance of the data, with the first three PCs representing more than 90% of the total variance (Table II). It is noted that the variance explained by each PC is quite similar over the analyzed period. This means that there are no significant differences in synoptic variability between each of the three months analyzed.
Table II Percentages of explained variance andcumulative percentages explained by the principal components retained at 500 hPa for each of the analyzed months.
| PCs | June | July | August | |||
| P. Var | P.C. Var. | P. Var. | P.C. Var. | P. Var. | P.C. Var. | |
| 1 | 35.9 | 35.9 | 32.2 | 32.2 | 32.9 | 32.9 |
| 2 | 31.3 | 67.2 | 31.7 | 63.9 | 31.2 | 64.1 |
| 3 | 26.1 | 93.3 | 28.2 | 92.1 | 28.5 | 92.6 |
| 4 | 1.7 | 95.0 | 2.1 | 94.2 | 1.7 | 94.3 |
PCs: principal components; P. Var.: percentages of explained variance; P.C. Var.: cumulative percentages of explained variance.
Characters in bold highlight the cumulative percentages of explained variance.
It is important to mention that the number of PCs obtained at the 500 hPa level is smaller than at surface (Table I). For example, at 500 hPa, only three PCs represented approximately 93% of the total variance, while at surface six PCs were needed (Table I). The physical significance of fewer modes explaining a large part of the total variance at 500 hPa level is that the fields are smoother, away from the surface irregularities. Therefore, a PC at 500 hPa may be related to more than one PC obtained at the surface.
As it was observed at surface, the temporal series of component loadings associated with the first three PCs (figures not shown) presented values greater than 0.7. This means that these PCs have a similar configuration to real weather patterns. The fourth CP, which also represents real meteorological situations, was not considered in this work as its variance explained less than 3% and its series of component loadings presented values lower than 0.3 (Harman, 1976; Cattell, 1978).
Fig. 3 shows the PCs obtained at the 500 hPa level for each of the three analyzed months. Similar synoptic patterns were observed throughout the period. Since atmospheric circulation shows less variability at upper levels than at lower ones, the PCs identified at 500 hPa level are smoother, highlighting only the main synoptic features. Thus, meteorological systems related to short waves may be underestimated in these theoretical fields.

The most frequent synoptic pattern at the 500 hPa level shows a high-pressure system over the Atlantic Ocean with its associated ridge extending with a northwest/southeast orientation (PC1 in Fig. 3a, b, c). During June, July, and August, this pattern represents 35.9, 32.2, and 32.9% of the total variance, respectively (Table II).
This high-pressure system is usually related to the SASH observed at the surface in its climatological mean position (Marengo et al., 2012) or sometimes located further south with blocking characteristics.
On the other hand, there is a trough to the west of the high-pressure system extending with a northwest/southeast orientation, between the Pacific Ocean and southern Argentina. The intense northwestern baroclinic flow determined by this trough contributes to the formation of the NAL, due to the adiabatic heating produced by the subsidence generated east of the Andes (Seluchi et al., 2003).
The classification shows another important atmospheric circulation pattern at 500 hPa level, associated with the presence of an intense trough with a northwest/southeast orientation, extending from the southeast region of Brazil to the south Atlantic Ocean (PC2 in Fig. 3a, b; PC3 in Fig. 3c). During June, July, and August, this pattern represents 31.3, 31.7, and 28.7% of the total variance, respectively (Table II).
This upper-level low-pressure system is associated with a cold front at surface, mainly in the Atlantic Ocean and close to the coast of SP and RJ states. Behind the frontal trough, an intense ridge can be observed over the continent, covering a great part of Argentina and part of Paraguay and Bolivia.
Finally, the last important upper-level atmospheric circulation pattern observed during winter is related to the presence of a cold front in south Brazil which is represented, by PC3 (Fig. 3a, b), and PC2 (Fig. 3c), explaining 26.1, 28.2 and 31.2% of the total variance, respectively (Table II). This pattern shows an intense trough with a northwest/southeast orientation extending from northern Chile to the Atlantic Ocean.
In some cases, this upper-level atmospheric circulation pattern is related to an upper-level trough, which triggers an extratropical cyclone in the Atlantic Ocean (Sinclair, 1995).
3.3 Relationship between surface and 500 hPa atmospheric circulation patterns
Previous sections presented the PCs obtained for each atmospheric level (SLP and GH500). However, PCs can be merged for describing the vertical structure of the atmosphere associated with the main synoptic patterns of winter.
Table III shows the relationship between PCs and both levels for each of the five synoptic patterns identified during the three studied months. These patterns were determined by the correlation between the series of component loadings of each PC identified at each level and on the synoptic and climate knowledge of South America.
Table III Relationship between principal components of the two levels (SLP and GH500) for each of the five main atmospheric circulation patterns identified during winter (CMF, CF_SE, BAn, CF_SUL_CG).
| June | July | august | ||||
| SLP | GH500 | SLP | GH500 | SLP | GH500 | |
| CMF | PC1 | PC1 | PC1 | PC1 | PC1 | PC1 |
| CF_SE | PC2 | PC2 | PC3 | PC2 | PC4 | PC3 |
| BAn | PC3 | PC2 | PC2 | PC2 | PC3 | PC3 |
| CF_SUL | PC4 | PC3 | PC4 | PC3 | PC2 | PC2 |
| CG | PC5 | PC3 | PC5 | PC3 | PC5 | PC2 |
SLP: sea level pressure; GH500: 500 hPa geopotential height; PC: principal component; CMF: climatological mean field; CF_SE: cold front over southeastern Brazil; BAn: blocking anticyclone; CF_SUL: cold front over southern Brazil, CG: cyclogenesis.
Characters in bold highlight the cumulative percentages of explained variance.
As mentioned in section 3.2, due to the smaller variability observed at 500 hPa, PC2 and PC3 were related simultaneously to two surface PCs at this geopotential height. This behavior was observed during the three analyzed months (Table III).
The five synoptic patterns are (a) climatological mean field (CMF), (b) cold front over southeastern Brazil (CF_SE), (c) blocking anticyclone (BAn), (d) cold front over southern Brazil (CF_SUL), and (e) cyclogenesis (CG).
The real atmospheric circulation fields at each analyzed level related to the five synoptic patterns were selected through the series of component loadings (figures not shown) that presented values greater than 0.7.
3.4.1.1 Synoptic pattern associated with the climatological mean field
The real SLP and GH500 charts related to a CMF pattern are shown in Fig. 4, which depicts the SASH at surface, located over its climatological position.

Fig. 4 Real GH500 charts (in dam) (top), and real SLP charts (hPa) (bottom) at 12:00 UTC related to the CMF pattern. (a) June 16, 2017; (b) July 29, 1997; (c) August 13, 2004.
In the middle troposphere (500 hPa), there is an intense ridge with a high-pressure system associated, covering a great part of central-south Brazil. This important dynamic system is related to the SASH, whose western part appears in the continent producing subsidence over a great part of the southeastern and central-west regions and part of the north and northeast regions. Thus, the atmospheric circulation associated with this synoptic pattern contributes to determining a dry season over this wide area during winter. On the other hand, the SASH also contributes to produce heavy rainfall episodes over the eastern part of the northeastern region of Brazil through the influence of the trade winds (Molion and Bernardo, 2002) and easterly wave disturbances (Pereira et al., 2014) that propagate into the easterly winds.
The three analyzed months also show a continental trough, extending from the south of Bolivia towards the center of Argentina that in several cases is related to the NAL.
Although this low-pressure system is more frequent during spring and summer due to the strong intensity of solar radiation, the NAL usually displays also in winter due to the presence of a trough in the middle levels (Escobar and Seluchi, 2012). This upper low-pressure system can also be identified in 500 hPa geopotential height charts (Fig. 4) through the trough located over the Pacific Ocean close to Chile.
3.4.1.2 Synoptic pattern associated with cold fronts over southeastern Brazil
The real SLP and GH500 charts related to a CF_SE pattern are depicted in Fig. 5, which shows a typical cold front extending from the coast of the southeastern region toward the southern part of the northern region of Brazil. The three analyzed months show the cold front around the ES state with the post-frontal anticyclone entering the continent and advecting cold air toward the lower latitudes.
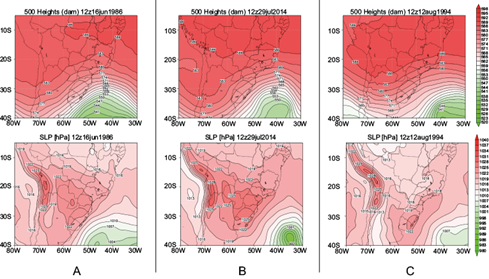
Fig. 5 Real GH500 charts (in dam) (top), and real SLP charts (hPa)(bottom) at 1200 UTC related to the CF_SE pattern. (a) June 1, 1986; (b) July 19, 2014; (c) August 24, 1994.
In the middle troposphere (500 hPa), the frontal trough associated with the cold front at the surface appears over the Atlantic Ocean with a meridional extension. This trough is connected with an intense upper low-pressure system located approximately around 40º S, 40º W. Behind this trough, there is an important ridge, also with a meridional extension, around 65º/70ºW. This upper high-pressure system is related to the post-frontal anticyclone described in the SLP chart.
A similar synoptic pattern in the low and middle troposphere was found by Escobar (2007) and Escobar et al. (2019b) when they made a synoptic classification associated with cold waves and friagens in the cities of São Paulo (SP) and Cuiabá (MT), respectively.
3.4.1.3 Synoptic pattern related to blocking anticyclone situations over the Atlantic Ocean
The BAn pattern (Fig. 6) is related to one of the most important atmospheric circulation patterns associated with cold waves in South America (Lupo et al., 2001; Escobar et al., 2004; Lanfredi and Camargo, 2018).
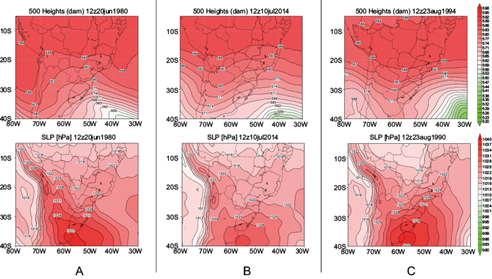
Fig. 6 Real GH500 charts (in dam) (top), and real SLP charts (hPa) (bottom) at 12:00 UTC related to the BAn pattern. (a) June 20, 1980; (b) July 10, 2014; (c) August 23, 1990.
The real SLP and GH500 charts related to this pattern highlight the presence of an intense post-frontal anticyclone at surface that reflects at 500 hPa level through an important ridge that extends with a meridional orientation, from southern Bolivia toward central Argentina.
With this kind of atmospheric circulation pattern, the post-frontal anticyclone shows a slow displacement to the east over the Atlantic Ocean, establishing a blocking configuration (Sinclair, 1996). A similar synoptic pattern was also found by Escobar et al. (2019b) when they made a synoptic classification associated with friagem episodes in the city of Cuiabá (MT).
The stationary frontal system is usually located between the southeastern region and the southern part of the northeastern region of Brazil. During August, the frontal system appears around southern BA and it is labeled as a subtropical front because it shows a weak horizontal temperature gradient (Escobar et al., 2019a). The advance of the subtropical fronts toward lower latitudes also contributes to favoring the formation of easterly wave disturbances that intensify the rains between the southern BA and AL (Fedorova et al., 2016).
3.4.1.4 Synoptic pattern associated with a cold front over southern Brazil
Fig. 7 shows the vertical structure of the CF_SUL pattern during winter, when the cold front can be observed approximately between RS and Bolivia and its associated post-frontal anticyclone enters the continent in a northeastward direction. It can also be observed that there is a ridge of the anticyclone to the east of the Andes, advancing to the north. With such surface atmospheric configuration, an inverted trough over the Pacific Ocean off the coast of central Chile can also be noticed, which in this period of the year is related to atmospheric pollution episodes (Garreaud et al., 2002).

Fig. 7 Real GH500 charts (in dam) (top), and real SLP charts (hPa) (bottom) at 12:00 UTC related to the CF_SUL pattern. (a) June 23, 2009; (b) July 16, 2017; (c) August 24, 2018.
In the middle troposphere (500 hPa) there is a frontal trough associated with the cold front at surface. This upper low-pressure system shows a northwestward extension during June and July and a meridional extension during August. The amplitude and the intensity of this baroclinic wave determine the way the cold front at surface penetrates the continent (Petterssen, 1956; Inness and Dorling, 2013).
Ahead of the frontal trough, there is a ridge with a southeastward extension affecting a great part of the central east of Brazil. This upper high-pressure system is associated with the SASH, which is located to the east of its climatological position due to the cold front at surface.
Despite this feature, a part of the western edge of the SASH can be observed entering the continent and affecting a great part of southeastern and part of central-west and northeast Brazil.
Thus, this atmospheric circulation pattern also contributes to determining the dry season over this wide area during winter.
3.4.1.5 Synoptic pattern associated with a cyclogenesis process over the Atlantic Ocean
The real SLP and GH500 charts related to this pattern (Fig. 8) show the atmospheric circulation pattern associated with an extratropical cyclone over the Atlantic Ocean.
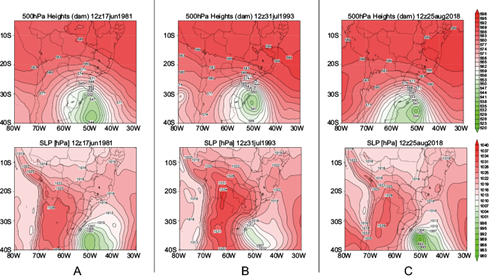
Fig. 8 Real GH500 charts (in dam) (top), and real SLP charts (hPa) (bottom) at 12:00 UTC related to the CG pattern. (a) June 17, 1981; (b) July 31, 1993; (c) August 25, 2018.
The three analyzed months show this phenomenon located around 36º S-48º W, with its associated cold front extending toward southeastern Brazil. This cold front enters the continent and penetrates the central-west and north regions of Brazil.
In the middle troposphere (500 hPa) there is a trough with a northwestward orientation and an intense cyclonic vortex located slightly to the west, concerning the low-pressure system observed at surface. It can be seen that the post-frontal anticyclone is centered over central and northern Argentina with a ridge extended toward the southern part of the northern region of Brazil.
Both systems (the extratropical cyclone and the post-frontal anticyclone) determine a significant southerly flow over a great part of Argentina, Uruguay, Paraguay, and a great part of central-south Brazil. The cyclonic circulation at surface associated with this extratropical cyclone intensifies the convergence of moist air, favoring the most significant precipitation occurrence over this affected area. This synoptic pattern is usually associated with snowfall episodes along the mountains of RS and SC states (Escobar et al., 2006; Dolif et al., 2015).
The cold air advection related to this synoptic pattern advances to the southern part of the northern region of Brazil during the three analyzed months, determining a typical friagem episode.
This baroclinic wave is also related to the synoptic pattern identified by Escobar (2007) and Escobar et al. (2019b) when they carried out a synoptic climatology associated with cold surges in SP city and friagens in central-west Brazil, respectively.
Through these obtained results, experienced forecasters can rapidly identify the temporal evolution of the three main conceptual models of baroclinic systems that occur during winter. First, the most frequent synoptic pattern sequence (SPS), determined by the synoptic patterns CMF, CF_SUL, CF_SE, and CMF, should be mentioned. This SPS is related to the typical passage of a cold front during the winter in Brazil. At the beginning of the sequence, the cold front appears over southern Argentina (out of the study area) and a great part of Brazil is affected by the SASH (CMF pattern). Next, the cold front advances, in sequence, to the southern (CF_SUL pattern) and southeastern (CF_SE pattern) regions of Brazil. Finally, the sequence ends when the post-frontal anticyclone acquires subtropical characteristics and becomes the SASH (CMF pattern). There is another SPS determined by the synoptic patterns CMF, CF_SUL, CG, CF_SE, CMF. In this case, the SPS shows a cyclogenetic process when the CG pattern appears after the CF_SUL pattern. This is the only difference in relation to the previous SPS.
Finally, the last SPS is also associated with the passage of a cold front; however, with slower displacement concerning the first SPS pattern. In this case, the SPS is determined by the synoptic patterns CMF, CF_SUL, BAn, CMF. The cold front moves slowly eastward and stays stationary close to the coast of the southern BA for some days (BAn pattern). The sequence ends when the post-frontal anticyclone (with blocking characteristics) becomes the SASH (CMF pattern).
4. Conclusions
A synoptic classification at surface and at 500 hPa during winter over Brazil for the period 1979-2020 was performed in this study to identify the main synoptic meteorological systems that influence the weather during this period.
Since atmospheric circulation in the middle levels is smoother with respect to low levels, three PCs accounted for most of the total variance at 500 hPa, while at surface six PCs were needed.
Both levels (SLP and GH500) show that the total variance explained by all the PCs is similar over the analyzed period. This means that there are no significant differences in synoptic variability between each of the three months analyzed.
The combination of both levels identified five main atmospheric circulation patterns during the winter.
The most frequent synoptic pattern identified in the three analyzed months is associated with the CMF (Marengo et al., 2012), which shows the two most important systems of this pattern: the SASH and the NAL.
The other four synoptic patterns that represent the variability related with the CMF pattern, were associated with a cold front in the southern (CF_SUL pattern) and southeastern (CF_SE pattern) regions of Brazil, a post-frontal anticyclone with blocking characteristics (BAn pattern), and an extratropical cyclone over the Atlantic Ocean (CG pattern).
In August, the CMF pattern is more frequent than in June and July because it entails more total variance. This means that the synoptic variability represented by the other patterns is higher during June and July because the CMF pattern in these months represents less total variance.
The CMF pattern shows the SASH over the Atlantic Ocean, over its climatological position, around 30/35ºS, 30ºW. This high-pressure system is reflected by an intense ridge in the mid-troposphere (500 hPa) that generates subsidence over a wide area in the continent, determining the dry season over the southeastern and central-west regions and part of the north and northeast regions of Brazil. In addition, the SASH intensifies the easterly winds over the eastern part of the northeastern region of Brazil and favors the formation of easterly wave disturbances usually associated with flash floods and landslides (Gomes et al., 2015).
This synoptic pattern also shows the presence of the NAL through a continental trough extending from the south of Bolivia towards the center of Argentina. During winter, this low-pressure system usually forms when a trough at 500-hPa geopotential height begins to cross the Andes from the Pacific Ocean toward the continent (Escobar and Seluchi, 2012).
In August, the NAL can also develop due to the increase in intensity of the solar radiation over the central and northern parts of Argentina. Thus, this low-pressure system acquires thermic characteristics (Escobar and Seluchi, 2012).
The BAn pattern is related to the presence of an intense high-pressure system over a wide area of the Atlantic Ocean. This system is usually associated with a post-frontal anticyclone with a slight displacement to the east. The 500-hPa geopotential height chart related to this surface pattern shows an amplified baroclinic long wave with an associated ridge and trough, establishing a blocking configuration.
With such a synoptic pattern, a significant southeasterly flow is determined over a great part of central-south and the southern part of north Brazil, determining one of the principal synoptic patterns of cold waves with friagens episodes over Brazil (Escobar, 2007; Ricarte, 2012; Reboita et al., 2015; Lanfredi and Camargo, 2018; Escobar et al., 2019b).
In the same way as the previous synoptic pattern, the subtropical front associated with this surface atmospheric circulation can also contribute to the formation of easterly wave disturbances between southern BA and AL (Fedorova et al., 2016).
The CF_SUL and CF_SE synoptic patterns are associated with the presence of a cold front over the southern and southeastern regions of Brazil, respectively. Both of them show an important trough at a 500-hPa geopotential height, located to the west with respect to the frontal system at surface. When the cold front is over southern Brazil, the frontal trough appears with a slightly northwestward inclination, extending approximately from northern Argentina toward the south Atlantic Ocean. On the other hand, when the cold front is over the southeastern region of Brazil, the trough is over the Atlantic Ocean, extending approximately with a meridional orientation close to 40º W.
The CF_SUL pattern shows a cold front at surface, approximately between RS and Bolivia and the CF_SE shows the frontal system approximately between RJ and ES. The post-frontal anticyclone shows a more meridional penetration when the cold front is over southern Brazil than when it appears over southeastern Brazil.
The CF_SE pattern during winter is similar to those found by Escobar (2007) and Escobar et al. (2019b) when they made a synoptic classification associated with cold waves over São Paulo (SP) city and friagem episodes over Cuiabá (MT) city, respectively.
The last important synoptic pattern (CG pattern) during winter is also related to a cold front over southeastern Brazil, however, accompanied by a cyclogenetic process over the Atlantic Ocean.
Despite being a much less frequent synoptic pattern than the previous ones, it is very important regarding its strong impacts on population. The extratropical cyclone associated with this pattern is located over the Atlantic Ocean close to the coast of Uruguay and RS state. The post-frontal anticyclone covering a great part of central and northern Argentina, Paraguay, and southern Bolivia appears to the west of this low-pressure system. Both systems (the cyclone and the anticyclone) determine strong southerly winds principally over Uruguay and RS state, contributing to an intense cold air advection over the continent.
The baroclinic wave related to this synoptic pattern is also associated with another of the most important synoptic pattern of cold waves in South America (Garreaud, 2000; Escobar, 2007; Escobar et al., 2019b). On the other hand, the cyclonic circulation at low levels, associated with this extratropical cyclone, is usually related to snowfall episodes along the mountains of RS and SC states (Escobar et al., 2006; Dolif et al., 2015).
The 500-hPa geopotential height pattern shows a deep and amplified baroclinic wave trough with an intense cyclonic vortex centered over the Atlantic Ocean slightly to the west concerning the extratropical cyclone at surface.
Finally, it is noteworthy that the results obtained in this study are useful for weather forecasters working in operational weather centers who predict the different synoptic patterns that produce several impacts during winter in Brazil.

