


 nueva página del texto (beta)
 Inglés (pdf)
 Artículo en XML
 Referencias del artículo
 Enviar artículo por email
 Citado por SciELO
  Similares en
SciELO
Similares en
SciELO 
 Permalink
1. Introduction
Climate is the most important factor determining the successful production of deciduous fruit trees. Plants react to climate conditions by triggering different stages of development throughout the annual cycle. The most important one among them is the winter rest period. Deciduous fruit trees temporarily stop or slow their growth to survive under severe winter conditions and avoid cold damage. These trees must be exposed to cold winter temperatures for a certain period of time to break dormancy and resume normal growth in spring. The amount of cold needed, known as the chilling requirement, varies depending on the cultivars in a species. Insufficient exposure to chilling temperatures can cause erratic bud break, poor fruit development, small fruit, and uneven ripening.
In response to global climate change, temperatures have increased in many regions of the world and will continue to increase in the future (IPCC, 2007). As a result, it is predicted that the probability of inadequate chilling for deciduous species in several regions of the world will increase (Darbyshire et al., 2011). A decrease in chilling accumulation in 82 different regions of the world has been shown in some studies (Baldocchi and Wong, 2008; Luedeling et al., 2009a, b, c). Nicholls and Collins (2006)) reported warming trends of 0.12 and 0.06 ºC/decade for minimum and maximum temperatures, respectively, observed from 1910 to 2004 across much of Australia. In contrast, Darbyshire et al. (2011) examined the historical change of the winter chilling of major fruit-growing regions of Australia and found that although the results changed depending on locations and chill model choice. The chilling accumulation generally remained stable or declined.
When a grower decides to choose a cultivar, it is important to consider whether its chilling requirement is appropriate for the location. Additionally, due to the longevity of most fruit trees, chilling accumulation at a given location must be suitable for them over a long period, usually more than 25 years. This situation has increased the interest in studies on how global warming would affect chilling accumulation. To select appropriate cultivars in terms of the chilling requirement, it is necessary to correctly measure the chill accumulation of the region and the chilling requirement of cultivars. There are many chill models developed for this purpose. The earliest one, which farmers are most familiar with, is the 0-7.2 ºC model (Weinberger, 1950). This model has been used to determine the chill requirement for many years. The understanding of the negative effects of warm temperatures and differential weighting of temperature ranges on chill accumulation led to Utah model (Richardson et al., 1974). Then, several modifications were made to the Utah model to enhance its results with species other than peach and areas with climatic conditions different from those in Utah. Fishman et al. (1987) developed the dynamic model, which has a different fundamental structure. Based on the assumption that cold accumulation occurs in two steps, it is considered to be a milestone in dormancy modeling. The first step is the accumulation of an intermediate product promoted by low temperatures. However, once a certain amount of the intermediate product has accumulated, it converts to a chill portion which is permanent and cannot be reversed by warm temperatures.
According to Luedeling et al. (2009d), models differ greatly in their sensitivity to climate change. In this study, historical winter chill accumulations of some temperate regions of horticultural importance in Turkey have been studied using the 0-7.2 ºC, Utah, Positive Utah (PU) (Linsley-Noakes et al., 1994), Modified Utah (MU) (Linvill, 1990), and Dynamic (Fishman et al., 1987) chill models. It has been reported that the Mediterranean basin, which includes Turkey, is one of the most fragile regions against climate change (Giorgi, 2006). Temperatures in Turkey, according to the values observed between 1970 and 2011, have increased significantly (Şen et al., 2013). Until the end of the century, the average annual temperature in Turkey is expected to increase by 1.5-5 degrees (Demircan et al., 2017). It is not known whether climate change has affected or not winter chilling accumulation in Turkey. This is the first study examining the historical changes in winter chilling in Turkey.
2. Materials and methods
2.1. Study data
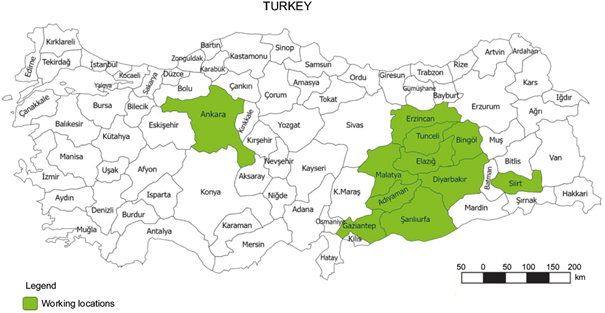
Twelve important production sites of temperate trees were selected from Turkey for determining the historical chilling (Fig. 1). Hourly temperature values from 1971 to 2020 for 12 studied sites were taken from the Turkish State Meteorological Service. Using five different models (0-7.2 ºC, Utah, MU, PU and Dynamic) the cold accumulation between 1971 and 2020 for 50 years was calculated.
2.2. Methods
The equations for each model are given below. In these equations, T t represents temperature (ºC) at a given hour t, st and en represent the start and end time of the chilling period to estimate total chill, respectively. The 0-7.2 ºC model sums the number of hours with temperatures between 0 and 7.2 ºC. Utah models transfer temperate chill units.
2.2.3 Utah model
2.2.4 PU model
The dynamic model calculates chilling accumulation differently from the other models, considering the interactions between temperatures. Firstly, an intermediate product promoted by cold temperatures is created. This intermediate product can then be destroyed by subsequent warmer temperatures. When this product reaches a certain amount, it becomes a stable form that cannot be destroyed regardless of subsequent temperatures. This irreversible product is expressed as a chill portion (CP):
In the model, the constants referred to as a 0 , a 1 , e 0 , e 1 , slp and tetml were set to 1.395 × 10⁵, 2.567 × 10¹⁸, 4153.5, 12 888.8, 1.6 and 277, respectively. Although the developers of the model suggested that constants should be adjusted for each cultivar, this is not often considered in practice. Therefore, the extensively preferred values in literature were used in this study (Erez et al., 1990; Darbyshire et al., 2011; Luedeling and Brown, 2011).
The monotonic trend in the outputs from the five chill models was investigated for each studied site to assess the possible impact of global climate change on chill accumulation.
Although the parametric or non-parametric approaches to test whether the climate-based time series have the existence of the upward or downward trends are prominent in the literature, the Mann-Kendall (MK) technique has been widely used in detecting monotonic trends associated with a hydro-meteorological data set. The reason for this choice is that while applying this method, there is no obligation for existing data to fit a certain frequency distribution and the presence of its low sensitivity to abrupt breaks. Additionally, the approach has a higher success power than other widely used approaches in revealing the change in the data (Hess et al., 2001; Jaagus, 2006; Sunley et al., 2006).The null hypothesis (Ho) related to the MK test points out that the relevant time series are independent and identically distributed, whereas the alternative hypothesis (H1) emphasizes that the data set has a monotonic trend. This approach is conducted on the S statistic whose relation is given below:
In Eq. (6), where n is the number of observations, x j and x i are the j th and i th observations, respectively. The sgn(·) is the sign function that takes the following values:
In Eq. (7), a positive S value designates an upward trend in the data set, whereas a negative S value corresponds to a downward trend. The statistic S is assumed to be approximately normally distributed with the mean zero and one standard deviation. In the case where the sample size (n) is bigger than 10, the relevant variance is obtained by:
From Eq. (8), t i indicates the number of ties of extent i, and m is the number of tied groups. The MK test statistics, symbolized by Z MK is achieved as:
The Z MK test statistic obtained from Eq. (9) conforms to the standard normal distribution. The Z MK value is compared to the value of Z 1-α/2 from the two-tailed Z table at a certain significant level. The null hypothesis expressed as no trend is rejected if the calculated Z MK value is greater than the critical table value at the significance level. A positive Z MK value indicates an increasing trend; a negative Z MK value indicates a decreasing trend.
Theil-Sen’s estimator (Theil, 1950; Sen, 1968) has been widely used to measuringe the slope of the trend line of hydro-meteorological time series. This non-parametric statistical method has the ability to robustly estimate the magnitude of the trend. The brief descriptions of this method are as follows:
1. The slope estimates (Q k ) of N pairs of time series are first computed after sorting data in ascending order:
where x j and x i are the data values at times j and i (j > i), respectively.
2. According to condition that N is odd or even, the median concerning with total N values of Q k is calculated by:
3. Results and discussion
Mean chill accumulation and coefficient of variation (CV) for the period 1971-2020 in the studied location are shown in Table I. The dynamic model had a lower CV than other models for all locations. This result showed that this model was least affected by the annual climate difference. Several authors have claimed that the dynamic model is the most plausible among the common models due to its homogenous rate of chill accumulation (Erez et al., 1990; Pérez et al., 2008; Alburquerque et al. 2008; Luedeling et al., 2009a; Darbyshire et al., 2011; Luedeling and Brown, 2011). In some previous studies examining the change of chill requirement of individual cultivars according to site and year, it was reported that the dynamic model had the lowest coefficient of variation (Ruiz et al., 2007; Viti et al., 2010; Campoy et al., 2012). For the Utah, MU and 0-7.2 models, the greatest variability was observed in chill accumulation at Şanlıurfa. On the other hand, the PU model had one of its lowest coefficients of variation at the same location. This province has warmer winter conditions than others. This support the finding of Linsley-Noakes et al. (1994) regarding the fact that PU model was shown to perform better in mild winter conditions.
Table I Mean cold accumulation and coefficients of variation of the studied locations.
| Locations | 0-7.2 ºC | Utah | MU | PU | Dynamic | |||||
| Mean | CV | Mean | CV | Mean | CV | Mean | CV | Mean | CV | |
| Adıyaman | 1615 | 18.0 | 1669 | 23.1 | 1802 | 20.5 | 2325 | 13.9 | 107 | 8.8 |
| Ankara | 1914 | 13.9 | 1774 | 18.9 | 1724 | 18.4 | 2128 | 15.2 | 122 | 8.6 |
| Bingöl | 1906 | 17.5 | 1602 | 22.8 | 1592 | 21.9 | 1816 | 21.8 | 115 | 9.2 |
| Diyarbakır | 1794 | 12.9 | 1646 | 20.5 | 1740 | 18.7 | 2195 | 16.2 | 108 | 8.6 |
| Elazığ | 1967 | 15.4 | 1756 | 20.5 | 1799 | 19.5 | 2117 | 17.6 | 116 | 8.8 |
| Erzincan | 1793 | 16.7 | 1585 | 21.8 | 1590 | 20.7 | 1867 | 19.2 | 120 | 9.7 |
| Gaziantep | 1915 | 13.0 | 1894 | 18.3 | 2013 | 16.3 | 2494 | 10.3 | 114 | 7.9 |
| Malatya | 1987 | 13.5 | 1749 | 21.5 | 1797 | 20.0 | 2129 | 17.3 | 115 | 8.5 |
| Siirt | 1865 | 15.4 | 1813 | 20.6 | 1940 | 19.2 | 2335 | 12.0 | 112 | 8.1 |
| Şanlıurfa | 1356 | 23.3 | 1348 | 31.9 | 1621 | 24.9 | 2253 | 10.6 | 97 | 9.2 |
| Tokat | 1806 | 13.0 | 1615 | 20.3 | 1702 | 19.5 | 2063 | 16.8 | 116 | 8.6 |
| Tunceli | 1948 | 16.0 | 1664 | 21.2 | 1634 | 19.6 | 1916 | 17.9 | 113 | 9.1 |
CV: coefficient of variation.
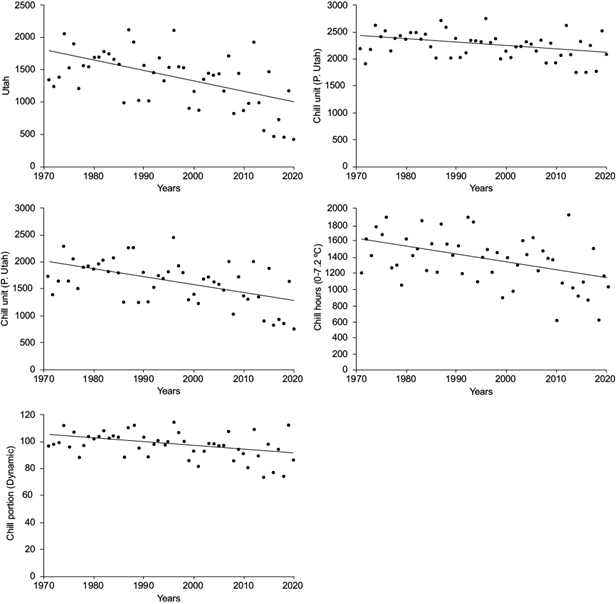
The Z MK test statistics has shown that there were no significant trends in the chill accumulations calculated by using five different models for Ankara, Bingöl, Diyarbakır, Malatya, and Tunceli. On the other hand, according to all five models used in the study, significant decreases (P < 0.001 for Utah and MU, and P < 0.01 for other models) were observed for Şanlıurfa in winter chill accumulation from 1971 to 2020 (Table II). Decreases in cold accumulation for Şanlıurfa over the years are further illustrated by the line in Figure 2. The decreasing trend observed in Şanlıurfa (which is located in southern Turkey and has warmer winter) is in agreement with review assessments by Luedeling (2012), who reported that chill losses are more severe in regions with warmer winters.
Table II Mann-Kendal test statistics and slopes for each location.
| Locations | 0-7.2 ºC | Utah | MU | PU | Dynamic | |||||
| Q | Z MK | Q | Z MK | Q | Z MK | Q | Z MK | Q | Z MK | |
| Adıyaman | -6.5 | -2.49* | -11.9 | -3.01** | -6.3 | -1.41 | 6.0 | 1.85 | -0.3 | -2.83** |
| Ankara | 0.3 | 0.12 | 0.9 | 0.13 | 3.0 | 0,66 | 4.8 | 1.57 | -0.2 | -1.51 |
| Bingöl | 3.1 | 0.73 | 2.4 | 0.51 | 2.1 | 0.59 | 7.1 | 1.80 | 0.0 | 0.03 |
| Diyarbakır | -3.1 | -1.22 | -3.0 | -0.70 | -3.2 | -0.99 | 4.3 | 1.33 | 0.0 | -0.38 |
| Elazığ | 3.2 | 0.92 | 1.1 | 0.47 | 5.2 | 1.30 | 9.5 | 2.11* | -0.0 | -0.28 |
| Erzincan | 6.9 | 1.89 | 7.5 | 2.16* | 7.8 | 2.21* | 11.3 | 2.88** | 0.1 | 0.75 |
| Gaziantep | -7.6 | -3.41*** | -6.8 | -1.92 | -3.9 | -1.1 | 1.1 | 0.50 | -0.3 | -3.16** |
| Malatya | 1.3 | 0.50 | -1.3 | -0.3 | -0.1 | -0.05 | 8.2 | 1.93 | -0.1 | -0.97 |
| Siirt | -7.1 | -2.51* | -8.0 | -2.06* | -6.9 | -1.79 | -0.7 | -0.27 | -0.2 | -1.94 |
| Şanlıurfa | -9.6 | -3.13** | -16.1 | -3.86*** | -14.4 | -3.33*** | -6.5 | -2.64** | -0.3 | -2.87** |
| Tokat | 0.7 | 0.23 | -1.2 | -0.38 | 1.9 | 0.45 | 7.0 | 2.00* | -0.1 | -1.22 |
| Tunceli | 3.1 | 0.74 | 2.2 | 0.42 | 1.2 | 0.28 | 4.8 | 1.27 | 0.1 | 0.37 |
*,** and *** indicate significant monotonic trend at the 0.05, 0.01 and 0.001 levels, respectively.
Considering other locations, significance, magnitude, and direction of the chilling trend differed according to location and the model used. For example, Z MK test statistics indicated that there was a significant decreasing trend according to the Utah, dynamic, and 0-7.2 models while no significant trends were observed according to PU and MU models in chill accumulation of Adiyaman. The chill accumulation data set of Gaziantep showed a statistically significant decreasing trend at 0.01 and 0.001 levels for dynamic and 0-7.2 models, respectively. No significant trend was detected in the chill accumulations of this province calculated according to other models. In Siirt, while Utah and 0-7.2 models showed significant decreasing trends at a 0.05 significant level, it was found that there was no statistically significant change in the data sets from other models. Similar to the findings in this study, Darbyshire et al., (2011) also reported that the magnitude and direction of chilling trends differed between the chill models and the sites.
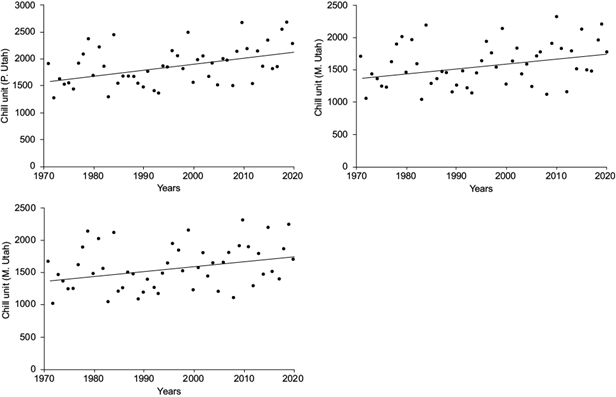
A different situation has been identified in the chill accumulation of Erzincan, which has relatively cold winters compared to other provinces. In this province, the data sequences belonging to the Utah, MU, and PU models indicated an upward trend in chill accumulation. These increasing trends are further illustrated by the line in Figure 3. These results are in agreement with the findings of Luedeling et al. (2011), who reported that while the warm region had major chilling losses (and will continue to have them in the future), the cold region experienced little change, or even increases in winter chill, as a greater numbers of days become frost-free. Similarly, as a result of their investigations in different regions of Germany, Luedeling et al. (2009e) documented that warming might lead to more winter chill accumulation if frost hours become non-freezing or lead to less chill accumulation if cold hours become too warm to be effective.
Unlike other models, the PU model showed positive trends in the chill accumulation of Elazığ and Tokat, as well as Erzincan. This positive trend probably stems from the mathematical structure of this model, which does not negate previous chilling due to the influence of high temperatures.
The Q values indicating magnitude of chilling trends differed depending on the sites and the chill models. Calculated Q values showed that the highest decreases in chill accumulation using the 0-7.2 ºC (average 9.6 CB year-1), Utah (average 16.1 CU year-1), or MU (average 14.1 MCU year-1) models were found in Şanlıurfa. When Q values determined for the PU model are evaluated, it is seen that the cold accumulation in Erzincan increased by an average of 11.3 PCU year-1. The q values of the dynamic model indicated that chill accumulations in Adıyaman, Gaziantep and Şanlıurfa decreased by an average around of 0.3 CP p year-1 (Table II).
4. Conclusions
In the context of possible impacts of global climate change, historical trend analyses for winter chilling of some temperate fruit growing regions of Turkey were carried out using a statistical approach and different chilling accumulation models. It was determined that the magnitude and direction of the monotonic trend changed in relation to locations and the model used. For this reason, in order to determine the presence of an increasing or decreasing trend for winter chill accumulation series in the studied sites, the most suitable model for the relevant site should be correctly determined first. The results of the study indicat that while cold regions might experience non-significant changes in winter chill accumulation or even positive ones, regions with mild winters such as Şanlıurfa might experience serious chilling losses. If the growers are aware of this fact when planning their orchards, the risks of serious losses will be reduced, and they may offer healthy and good quality fruits to the consumers.

