


 nueva página del texto (beta)
 Inglés (pdf)
 Artículo en XML
 Referencias del artículo
 Enviar artículo por email
 Citado por SciELO
  Similares en
SciELO
Similares en
SciELO 
 Permalink
1. Introduction
Occurrence of severe thunderstorms (TS) during pre-monsoon season (March-June) over Indian subcontinent is a matter of serious concern in terms of the extent of damage caused by strong surface winds and lightning associated with them. Until a few decades ago, the detection of these severe weather producing convective systems was purely based on their visual appearance. The technological advancements in terms of observational tools have made it possible to objectively ascertain the presence of severe TS. Lightning Detection System (LDS) is one such tool, being used worldwide to ascertain the location and intensity of area of severe convection. Indian Air Force (IAF) has installed an LDS network comprising 63 ground-based sensors. In this research work, an attempt has been made to create lightning climatology in terms of spatial distribution and temporal variation of the average number of lightning flashes across the Indian subcontinent using IAF LDS network data, and formulate location-specific TS guidance for 12 Indian airports.
There is a rapid increase in total lightning activity preceding severe and tornadic thunderstorms (Williams et al., 1999; Goodman et al., 2005). These events of rapid increases in the total flash rate are found to precede severe weather at the ground and have been termed as “lightning jumps” (Williams et al., 1999). This trend in lightning activity is believed to be the electrical response to updraft activity during thunderstorm evolution, which is supported by both theoretical and observational studies relating updraft evolution and total lightning flash rate (Baker et al., 1999; Deierling et al., 2008).
In order to objectively use the observation data of IAF LDS for nowcasting, this study attempts to ascertain the efficacy of “lightning surges” in nowcasting the occurrence of strong surface winds (SSW) associated with moderate to severe TS events over Delhi National Capital Region (NCR) during pre-monsoon season. Therefore, the first objective of the study is to prepare climatological plots of spatial distribution and temporal variation in the occurrence of lightning over India. The second objective is to formulate location-specific thunderstorm guidance based on the average spatial and temporal distribution of lightning, for 12 airports of India. And the third and the last objective is to study variation in the number of lightning flashes prior to the occurrence of SSW associated with moderate to severe thunderstorm over Hindan Airport, Delhi.
2. Lightning climatology
Lightning climatology prepared for any region is dependent on the kind of data set and the type of lightning detection sensors used. The lightning imaging sensor on the International Space Station (ISS LIS) has been operating on-orbit since February 2017. The instrument is serving as a standard for comparison to other spaceborne lightning sensors, such as the Geostationary Lightning Mapper (GLM) (Blakeslee et al., 2020). Studies indicate that continental results display strong diurnal variation, with a lightning peak in the late afternoon and a minimum in late morning. In geographical regions dominated by large mesoscale convective systems, the peak in the diurnal curve shifts toward late evening or early morning hours. The maximum seasonal diurnal flash rate occurs in June-August, corresponding to the Northern Hemisphere summer, while the minimum occurs in December-February. Summer lightning dominates over winter activity and springtime lightning dominates over fall activity at most continental locations (Blakeslee et al., 2014). Gridded climatologies of total lightning flash rates observed by the spaceborne Optical Transient Detector (OTD) and Lightning Imaging Sensor (LIS) on Tropical Rainfall Measuring Mission (TRMM) satellite suggest that the peak monthly average flash rate at 2.5º scale is 18 fl km−2 month−1 from early April to early May in the Brahmaputra Valley of far eastern India. Lightning decreases in this region during the monsoon season, but increases further north and west. An August peak in northern Pakistan also exceeds any monthly averages from Africa, despite central Africa having the greatest yearly average (Cecil et al., 2014).
3. Instrumentation and methodology
3.1 Instruments over the experimental area
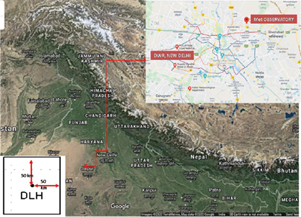
Sixty-three ground-based lightning sensors of LDS IAF network spread across Indian subcontinent recorded continuous and real time measurements of lightning strikes. The LDS detects millions of cloud to ground and cloud to cloud lightning flashes each day, utilizing time-of-arrival methodology over a broad frequency range of 1-12 MHz and employing adaptive digital filtering. The system provides 100-200 m location accuracy with up to 95% detection efficiency (this is the claim of the equipment manufacturer and has not been verified). LDS data for a 5-year period (2013-2017) has been utilized to study the spatial and temporal distribution of lightning across the country and formulate location-specific TS guidance. To study the efficacy of lightning surges in predicting SSW associated with moderate to severe TS, 40 TS events during the pre-monsoon season (March to June) from 2013 to 2017, associated with strong downdrafts of more than 60 km h-1 persistent or in the gust, observed over Delhi NCR (Hindan airport) have been considered. The Delhi NCR covers an area of about 34 144 km2 in the territorial jurisdictions of four state governments, namely National Capital Territory (NCT) of Delhi, Haryana, Uttar Pradesh, and Rajasthan (Tyagi et al., 2016). Delhi NCR’s LDS data and meteorological observation like wind direction, wind speed, horizontal visibility, clouds were recorded at meteorological observatory located at Hindan. Hindan airport (VIDX) is located near Ghaziabad, Uttar Pradesh (Fig. 1). However, Doppler weather radar (DWR) images for Delhi NCR were studied using the DWR (C band) located at India Meteorological Department (Mausam Bhavan), Lodhi road, New Delhi (28.58º N, 77.22º E). The distance between Hindan airport and Lodhi road DWR is approximately 23 km.
3.2 Methodology for climatological plots
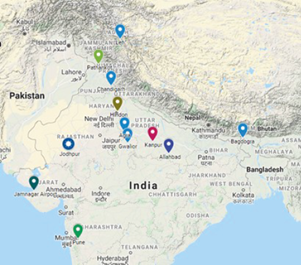
To study the spatial distribution of lightning (climatological plots) across Indian subcontinent and location-specific TS guidance, the following methodology was adopted: lightning flash data in .csv format was collected for a period of 5 years (2013-2017). Data was segregated grid-wise for grids of 0.5º × 0.5º latitude/longitude. The average number of lightning flashes in each grid, at the 2-hourly interval, for one week (for five years) starting from January 1-7 (00:00-02:00 UTC) to December 22-31 (22:00-24:00 UTC) was calculated. The segregated data was converted into .cdl format and subsequently into netCDF format for visualization using GrADS application. For location-specific TS guidance over 12 airports of India (Fig. 2), the average number of lightning flashes at the 2-hourly interval were plotted on a polar diagram keeping aerodrome at the center.
3.3 Methodology to study lightning surges
To study the variation in lightning activity in terms of “lightning surges” before the occurrence of SSW on the ground, the following methodology was adopted: severe weather on the ground is defined as the observation of strong surface winds > 60 km h-1 persistent or in gust over Hindan Meteorological Observatory. The time at which severe weather has commenced is termed as the T hour. Number of lightning flashes, within a box of 100 × 100 km keeping Delhi (Hindan airport) at the center (Fig. 1), is calculated at 5 min intervals from T - 60 to T + 15. The study of a number of lightning flashes aims to track trends in the total flash rate and objectively identify lightning surge if there is any. In this context, flash rate f is defined as the number of flashes occurring per minute. Flash rate is calculated starting from T - 60 to T + 15. To determine the trend and quantify the lightning surge, the time rate of change of the total flash rate, f’, is calculated as
where f is the total flash rate and its derivative is estimated via finite difference (∆t being 5 min). This approach treats the lightning surge as an anomaly relative to the average total flash rate. Thus, to identify this anomaly, the total flash rate f’ must become significantly larger than average during an episode. Hence, the lightning surge threshold f’ thres is defined as
where σ(f’) is the standard deviation of f’ and f̅ ’ is its moving average with a sampling rate of 5 min. Since the lightning surge is an increase in total flash rate, to qualify it to be a lightning surge it must exceed two standard deviations of the average. A lightning surge occurs when f’ exceeds the surge threshold (sample calculation for one case is given in Table I) (Gatlin et al., 2010), lightning jumps precede 90% of severe weather events with as much as 27-min advance notification of impending severe weather on the ground. However, 37% of lightning jumps are not followed by severe weather reports.
Table I Calculation of lightning surges (data of May 21, 2017 has been shown when the mean and maximum wind speed recorded was 70 and 94 km h-1, respectively, in a gust over Delhi NCR at 12:30 UTC).
| Time | Number of counts | f | d/dt (f) = f' | f̅' | σ(f') | f'thres |
| T - 55 | 2 | 0.4 | ||||
| T - 50 | 2 | 0.4 | 0 | |||
| T - 45 | 14 | 2.8 | 0.48 | 0.24 | 0.339411255 | 0.91882251 |
| T - 40 | 12 | 2.4 | -0.08 | 0.2 | 0.395979797 | 0.99195959 |
| T - 35 | 9 | 1.8 | -0.12 | -0.1 | 0.028284271 | -0.0434315 |
| T - 30 | 9 | 1.8 | 0 | -0.06 | 0.084852814 | 0.10970563 |
| T - 25 | 24 | 4.8 | 0.6 | 0.3 | 0.424264069 | 1.14852814 |
| T - 20 | 27 | 5.4 | 0.12 | 0.36 | 0.339411255 | 1.03882251 |
| T - 15 | 20 | 4 | -0.28 | -0.08 | 0.282842712 | 0.48568542 |
| T - 10 | 15 | 3 | -0.2 | -0.24 | 0.056568542 | -0.1268629 |
| T - 05 | 14 | 2.8 | -0.04 | -0.12 | 0.113137085 | 0.10627417 |
| T | 13 | 2.6 | -0.04 | -0.04 | 6.39734E-17 | -0.04 |
| T + 05 | 9 | 1.8 | -0.16 | -0.1 | 0.084852814 | 0.06970563 |
| T + 10 | 18 | 3.6 | 0.36 | 0.1 | 0.367695526 | 0.83539105 |
| T +1 5 | 9 | 1.8 | -0.36 | 0 | 0.509116882 | 1.01823376 |
ƒ: flash rate, number of flashes occurring per minute; ƒ': time rate of change of the total flash rate; f̅': moving average of ƒ’ with a sampling rate of 5 min; σ(ƒ'): standard deviation of ƒ'; ƒ' thres : lightning surge threshold (ƒ' + 2 σ [ƒ']).
To determine the extent to which the conceptual lightning surge framework can be solely used as a predictor for severe weather onset, the probability of detection (POD) is used to conduct a categorical verification (Cummins et al., 1998) and is calculated as follows:
A hit occurs when a lightning surge occurs within T - 15 to T - 45 min, a miss occurs when a lightning surge occurs within T - 15 min or a lightning surge does not occur. This 45-min constraint has been taken so that the time constraint should allow for sufficient warning and should be able to capture lightning surge, if any, before the occurrence of strong surface winds.
4. Results and discussion
4.1 Lightning climatology: Spatial and temporal distribution
Weekly spatial distribution of lightning at the 2-hourly interval for representative months of each season is shown in Figure 3a-d. Plots depict both the spatial distribution and temporal variation. It is revealed that January is the least susceptible month for the occurrence of lightning across India. As the year progresses lightning activity increases over the country and is highest during May. Significant increase in activity is seen along the Kerala coast. The highest number of lightning flashes is observed over Gangetic West Bengal between 12:00 and 14:00 UTC, whereas over Kerala it is between 18:00 and 20:00 UTC. During August (SW monsoon) the lightning activity is least over southern peninsular India as compared to other parts of the country. Effect of NE monsoon over southern peninsular India can be well appreciated when maximum lightning is seen over this region between 12:00 and 14:00 UTC in October. The peak period of occurrence of lightning over most of the parts of the country during all the seasons is between 12:00 and 14:00 UTC.

4.2 Location-specific thunderstorm guidance
Location-specific TS guidance for a total 12 Indian airports has been prepared and shown in Figure 4a-l. The study reveals that location-specific thunderstorm guidance can be effectively used for nowcasting TS movements along with real-time observations from LDS. Location-specific TS guidance brings out the week wise average of occurrence of lightning flashes for a particular location. The guidance signifies the most probable direction of occurrence of lightning, and thus TS with respect to the aerodrome. For example, it is evident from the plot of the average number of lightning flashes around Delhi for the period May 15-21 (pre-monsoon season), that the highest number of lightning flashes occurs SW of aerodrome between 08:00 and 10:00 UTC whereas between 10:00 and 12:00 UTC it occurs in NW direction. The second most probable time of occurrence of TS over the aerodrome is between 20:00 and 22:00 UTC. Over Jodhpur (Rajasthan), during the same period, maximum lightning activity occurs between 12:00 and 14:00 UTC in the northern sector the most probable time of occurrence of lightning over base is between 22:00 and 24:00 UTC. Over Pune (Maharashtra), within 100 km there is no lightning activity between 20:00 and 08:00 UTC. Of all the four aerodromes depicted, the highest number of lightning flashes is observed near Bagdogra (West Bengal) with a peak period of occurrence between 16:00 and 20:00 UTC.

4.3 Lightning surges
Studies by Reap and MacGorman (1989), Williams (1989), Williams et al. (1999), and Goodman et al. (2005) indicate that updraft is the main factor governing the lightning flash rate. The updraft provides water, which is the fundamental ingredient needed for a cloud to build up enough electrical charge for lightning occurrence. Thus, an intense updraft supplies the cloud with ample water vapor, which leads to more condensation. The greater supply of condensate, in turn, leads to more ice particle collisions and thus greater charge separation and lightning (Williams, 2001). It is also the updraft which governs storm severity. So, it is necessary to examine the updraft evolution concerning both lightning activity and storm strength (i.e., severe or not). To objectively ascertain the occurrence of lightning surge, f’ thres is calculated for 40 cases of moderate to severe thunderstorm cases over Delhi NCR. The efficacy of the lightning surge concept based on f’ thres in nowcasting severe weather associated with a TS event occurred over Delhi NCR on June 9, 2018 is discussed subsequently.
4.4 Case study of an event of severe weather occurrence
On June 9, 2018 a TS accompanied by a dust storm and SSW of 78 km h-1 in gust affected Hindan airport at 12:00 UTC. Table II shows the sequence of weather associated and Figure 5a-e the time-height evolution of radar reflectivity associated with the strong surface wind producing TS. The observatory is located approximately 23 km east-northeast of the center of the Delhi NCR Doppler DWR.
Table II Sequence of weather on June 9, 2018.
| Time (UTC) | Surface wind (km h-1) | Visibility (m) | Weather | Clouds |
| 10:30 | 09020 | 6000 | Cloudy | SCT030 FEW035CB SCT090 |
| 11:00 | 05024 | 6000 | Cloudy | SCT030 FEW035CB SCT090 |
| 11:30 | 01024 | 6000 | Mainly overcast | SCT030 FEW035CB SCT090 |
| 12:00 | 29058G78 | 0000 | TS with DS | SCT030 FEW035CB BKN090 |
| 12:15 | 25038G58 | 0800 | TS with rain | SCT010 SCT030 FEW035CB BKN090 |
| 12:30 | 26024 | 0800 | TS with rain | SCT010 SCT030 FEW035CB BKN090 |
TS: thunderstorm; DS: dust storm.
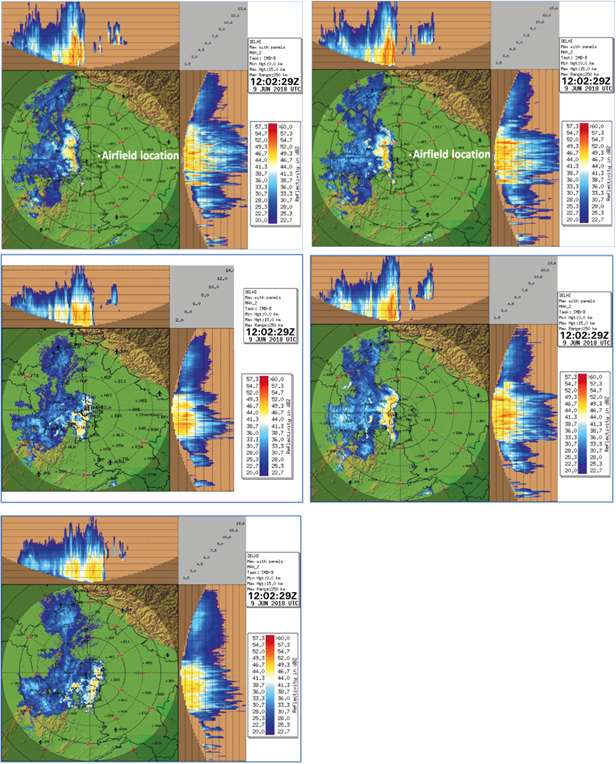
Fig. 5 Doppler weather radar maximum reflectivity at: (a) 11:02 UTC, (b) 11:12 UTC, (c) 11:32 UTC, (d) 12:02 UTC, and (e) 12:22 UTC.
A north-south oriented squall line was observed by the DWR ~70 km west of the observatory at 11:02 UTC. At this time the 44-49 dBZ reflectivity echo was seen extending up to 8-9 km. The storm was seen as maintaining the intensity until 11:32 UTC. Thereafter, at 12:02 UTC the 44-49 dBZ reflectivity values were seen extending up to 6-7 km. This indicates that the storm was at its peak intensity between 11:12 to 11:32 UTC, implying that precipitate on sized particles had grown and become more numerous, which in turn suggests intense updraft growth through the mixed-phase region, which favors the growth of large hailstones. The updraft growth resulted in enhanced lightning activity (Gatlin et al., 2010). The flash rate increased from 7.6 to 19.6 and to 57 between 11:10 to 11:25 UTC. The lightning surge was also observed at 11:25 UTC (35 min before the occurrence of severe weather). After 11:25 UTC the flash rate continued to increase until 11:45 UTC, but the lightning surge was not observed (refer Table III). Thirty-five minutes after the lightning surge, 78 km h-1 winds in gust were reported.
Table III Lightning surges on June 9, 2018.
| Time | Number of counts | f | d/dt (f) = f' | f̅' | σ(f') | f' thres |
| T - 55 | 0 | 0 | ||||
| T - 50 | 3 | 0.6 | 0.12 | |||
| T - 45 | 38 | 7.6 | 1.4 | 0.76 | 0.90509668 | 2.57019336 |
| T - 40 | 98 | 19.6 | 2.4 | 1.9 | 0.707106781 | 3.31421356 |
| T - 35 | 285 | 57 | 7.48 | 4.94 | 3.592102448 | 12.1242049 |
| T - 30 | 295 | 59 | 0.4 | 3.94 | 5.006316011 | 13.952632 |
| T - 25 | 319 | 63.8 | 0.96 | 0.68 | 0.395979797 | 1.47195959 |
| T - 20 | 337 | 67.4 | 0.72 | 0.84 | 0.169705627 | 1.17941125 |
| T - 15 | 303 | 60.6 | -1.36 | -0.32 | 1.470782105 | 2.62156421 |
| T - 10 | 236 | 47.2 | -2.68 | -2.02 | 0.933380951 | -0.1532381 |
| T - 05 | 225 | 45 | -0.44 | -1.56 | 1.58391919 | 1.60783838 |
| T | 161 | 32.2 | -2.56 | -1.5 | 1.499066376 | 1.49813275 |
| T + 05 | 146 | 29.2 | -0.6 | -1.58 | 1.385929291 | 1.19185858 |
| T + 10 | 133 | 26.6 | -0.52 | -0.56 | 0.056568542 | -0.4468629 |
| T + 15 | 104 | 20.8 | -1.16 | -0.84 | 0.45254834 | 0.06509668 |
ƒ: flash rate, number of flashes occurring per minute; ƒ': time rate of change of the total flash rate; f̅': moving average of ƒ’ with a sampling rate of 5 min; σ(ƒ'): standard deviation of ƒ'; ƒ' thres : lightning surge threshold (ƒ' + 2 σ [ƒ']).
4.5 Efficacy of lightning surges in capturing occurrence of strong surface winds associated with moderate to severe thunderstorm over Delhi NCR within T - 15 to T - 45 min
The lightning surge methodology described above was tested on 40 TS cases that resulted in strong surface winds > 60 km h-1 over Delhi NCR. Table IV shows the peak flash rate attained per minute in each case, f’tres, and occurrence of lightning surges concerning the time of occurrence of severe weather. Out of 40 TS events considered, in 31 events lightning surge, defined as per the criteria explained earlier, preceded the occurrence of severe weather within 45 minutes (Table IV). The highest flash rate attained during various events varied from 0.2 to 75.4 fl min-1. In 28 TS events, the occurrence of lightning surge preceded severe weather occurrence from 15 to 45 min (there are nine events during which the surge was observed twice; the second surge, however, was within 15 min of the occurrence of the severe weather). These 28 TS events have been categorized as hits whereas in three of them the lightning surge preceded TS within 15 min and in another nine TS events there was no lightning surge. These 12 TS events have been categorized as a miss. The POD (Table V) and hence the efficacy of lightning surge to nowcast SSW associated to severe TS 15 to 45 min before the occurrence of SSW is 71.79%.
Table IV Peak flash rate attained per minute in each case, f’ tres and occurrence of lightning surge with respect to time of occurrence of severe weather
| Date | Peak flash rate attained (fl min-1) | Lightning surge observed within a given time frame (yes/no) | ||||
| Occurrence of surge | T - 35 to T - 45 | T - 25 to T - 35 | T - 15 to T - 25 | T - 15 to T | ||
| 28 Jun 14 | 1.40 | No | - | - | - | - |
| 02 Apr 14 | 3.80 | Yes | - | - | Y | - |
| 29 Jun 14 | 23.0 | Yes | Y | Y | - | |
| 13 May 15 | 54.6 | Yes | - | Y | - | Y (second surge) |
| 19 May 15 | 2.80 | Yes | - | Y | - | Y(second surge) |
| 19 May 15 | 7.60 | Yes | Y | - | - | Y(second surge) |
| 01 Jun15 | 1.60 | Yes | - | - | - | Y |
| 14 Jun 15 | 4.80 | Yes | Y | - | ||
| 13 Jun 15 | 1.80 | Yes | Y | - | ||
| 22 Jun 15 | 22.2 | Yes | Y | Y(second surge) | ||
| 12 Mar 16 | 35.6 | No | - | |||
| 13 May16 | 1.60 | Yes | Y | - | ||
| 23 May16 | 11.2 | Yes | Y | Y | Y(second surge) | |
| 23 May16 | 0.20 | Yes | - | - | Y | - |
| 29 May16 | 3.80 | Yes | - | Y | - | |
| 29 May16 | 0.80 | Yes | - | Y | - | |
| 10 Jun 16 | 25.2 | No | - | - | ||
| 13 Jun 16 | 4.40 | Yes | - | Y | - | |
| 13 Jun 16 | 6.60 | Yes | Y | - | - | - |
| 03 May 17 | 5.40 | Yes | - | Y | - | |
| 21 May 17 | 30.6 | Yes | Y | - | ||
| 19 Jun 17 | 6.60 | No | - | - | ||
| 06 Apr 18 | 5.60 | Yes | Y | Y(second surge) | - | |
| 06 Apr 18 | 9.00 | No | - | - | ||
| 06 Apr 18 | 9.60 | No | - | - | ||
| 02 May 18 | 1.40 | Yes | Y | Y(second surge) | ||
| 07 May 18 | 0.60 | No | - | - | ||
| 08 May 18 | 59.2 | Yes | Y | - | ||
| 13 May 18 | 12.6 | No | - | - | ||
| 13 May 18 | 3.20 | Yes | Y | |||
| 16 May 18 | 75.4 | Yes | - | Y | ||
| 17 May 18 | 0.40 | No | - | - | ||
| 30 May 18 | 0.80 | Yes | Y | Y(second surge) | ||
| 01 Jun 18 | 110 | Yes | Y | - | ||
| 09 Jun 18 | 67.4 | Yes | Y | - | - | |
| 15 Apr 19 | 0.60 | Yes | Y | - | ||
| 13 May 19 | 2.80 | Yes | Y | - | ||
| 17 May19 | 33.6 | Yes | Y | - | ||
| 23 May 19 | 23.6 | Yes | Y | |||
| 12 Jun 19 | 2.40 | Yes | Y | - | ||
Table V Probability of detection.
| Total cases considered | Lightning surges observed | Lightning surges not observed |
| 40 | 31 | 9 |
| Hits Lightning surge observed within T - 15 to T - 45 | Miss Lightning surge observed within T to T - 15 | Miss (events with no lightning surge) |
| 28 | 3 | 9 |
| Probability of detection (%) | ||
| Overall | Considering the events during which lightning surge did not occur or occurred within 15 min of occurrence of severe weather | |
| 77.5 | 71.79 | |
5. Conclusion
Lightning is one of the earliest visible manifestations of a TS cloud. Observational tools like LDS have made it possible to refine and develop the TS climatology based on the number of lightning flashes even over areas where human observations are not available. Climatology of lightning over India clearly brings out features like the dominance of TS occurrence during the pre-monsoon season, increase in TS activity along Kerala coast before the onset of SW monsoon, etc. Location-specific TS guidance can emerge as an excellent tool for nowcasting along with actual observations from LDS. It does not only identify the most probable zone of lightning activity with respect to the aerodrome but also indicates the climatological pattern of movement of TS with respect to time.
Since total lightning activity tends to follow the trend in the updraft, an increase in the total flash rate is indicative of updraft intensification and associated severe weather. As revealed during the study, the increase in the number of flash counts can be used to diagnose TS intensity in terms of associated SSW. These rapid increases in total flash rate, termed as lightning surges can be used to diagnose TS intensity (severe or non-severe). The lightning surge threshold defined in this study can be used objectively to diagnose TS intensity and to predict the potential for severe weather. However, additional testing of these results is warranted, especially on a dataset including cases of non-occurrences. Refinement in calculation methodology of lightning surges based on the region-specific climatology will certainly enhance the accuracy of time and intensity specific TS forecast and warning lead time.

