


 nueva página del texto (beta)
 Inglés (pdf)
 Artículo en XML
 Referencias del artículo
 Enviar artículo por email
 Citado por SciELO
  Similares en
SciELO
Similares en
SciELO 
 Permalink
1. Introduction
The relationship between radiation and temperature was firstly described by Josef Stefan in 1879 and later presented as a law by Ludwig Boltzmann in 1884, thus receiving the name of Stephan-Boltzmann law. It states that the energy emitted by a body is proportional to a constant (named after the authors) multiplied by temperature to the fourth power (Eq. [1]). The year after proposing the law, Stefan used it to calculate the temperature from the Sun’s surface for the first time, with a difference of only 2% compared to current estimates (5700 K originally vs. 5778 K current estimate).
The former is the original equation for the Stephan-Boltzmann law, where E is the radiative energy emitted, T is the temperature and σ is the constant named after the authors. Eq. (1) implies that our planet will heat because of incoming radiation from the Sun. Thus, if we know the temperature of the Sun (or its irradiance) and the distance to Earth, the global surface temperature could be computed. However, for the original law to work, Earth would need to behave as a blackbody (absorbing and reflecting all incoming radiation), which is untrue. Earth’s radiation budget is modified by three key aspects: the planetary albedo, its atmospheric chemical composition, particularly its greenhouse gases (GHG) concentration, and internal climate feedbacks (Stephens et al., 1981, 2012; Forster et al., 2007). Hence, Earth’s surface temperature an any moment during its history could be approximated based on these three factors: incoming solar radiation, albedo and GHG concentration (Eq. 2).
where T e is the effective planetary temperature approximated by the product of incoming solar radiation (S), the planetary albedo (A) and the concentration of greenhouse gases in the atmosphere (GHG). The real temperature is also affected by internal climate feedbacks.
By combining these two key concepts (the Stephan-Boltzmann law described in Eq. [1] and the drivers of Earth’s radiation budget presented in Eq. [2]) I present a relatively simple equation (Eq. [3], with full explanation on section S.1 of the supplementary material) to quickly compute an approximation to the global surface temperature in any given time period and, particularly, to understand the influence that solar radiation, planetary albedo and GHG had in the past and could have in the future of our planet’s history.
With the computation of these flows of energy we can understand long-term, oscillatory, and near-term changes in global climate. Yet, it is fundamental to notice that it represents an ideal physical model, helpful to understand the nature of the Earth’s system but unlikely to yield accurate results for making climate change predictions. Another key limitation of this approximation is that all three factors always interact with each other, thus it is difficult to separate them as individual components; nonetheless, they are presented as such. Finally, several sudden climatic changes have occurred in the history of the planet, forced by planetary catastrophes (most notably meteor impacts, e.g., Chicxulub), which cannot be accounted for in this model and thus, are outside of the scope of this work.
The former is the simple energy balance using the Stephan-Boltzmann law to calculate Earth’s temperature (T e ). For any given period, global temperature is equal to the product of three elements: (1) incoming solar radiation, which in turn depends on the Sun’s temperature (T s ), the radius of the Sun (R s ), and the distance between the two (D s ); (2) Earth’s planetary albedo (A e ), and (3) emissivity of the atmosphere (), which depends on the GHG concentration.
In this work, I employed the above-mentioned equation to compare the magnitude and rates of change of temperature caused by its drivers. The fundamental idea of this work, which is developed further in the next sections, is to show the global surface temperature variability caused by the impact of solar evolution, orbital changes, solar activity, snow and vegetation albedo, and greenhouse gases concentration (Fig. 1). To simplify the analysis and calculations, I split the drivers according to their temporal-scale of influence, from decades to billions of years. This method is useful for the contextualization of current man-made climate change in terms of absolute change and its speed but does not address the large uncertainty inherent to comparing such vast multiple timescales. It should also be noticed that by splitting the study of Earth’s temperature in individual drivers, a large fraction of the internal variation driven by climate feedbacks is not accounted for. Nevertheless, this approach allows for large comparisons of Earth’s temperature drivers and key historical events.
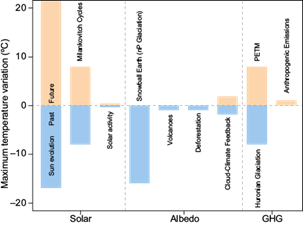
Fig. 1 Influence of different drivers on the variability of global surface temperatures throughout Earth’s history (ºC). The impact of incoming solar radiation, albedo, and greenhouse gas concentrations is contextualized in terms of total magnitude and subdivided into their respective processes as described in the different sections. The calculation for each bar is presented in Table SI in the supplementary material. Changes represent the maximum recorded impact. (PETM: Paleocene-Eocene thermal maximum; nP: Neoproterozoic.)
2. Incoming solar radiation
Incoming solar radiation through Earth’s history has been modified by two drivers: solar irradiance and the distance between our planet and its star. On the one hand, the Sun’s temperature and irradiance have two major sources of variation: the evolution of the star, driven by the conditions of its core, and variations in its magnetic field, leading to cycles of varying solar activity (Solanki, 2002). On the other hand, Earth’s orbital moves also affect the amount of solar radiation received, by altering the distance between the two. These changes have impacted global temperature at different time scales from tens of millennials to millions of years and will continue to do so. To understand how they regulate the planetary climate it is fundamental to separate their processes based on their temporal scale of influence.
2.1 Billions of years: Sun evolution
As any other yellow dwarf star, the Sun’s evolution implies a slow increase in irradiance as hydrogen is converted to helium in its core. As a result, during Earth’s origins (4.5 Ga), Sun’s irradiance and incoming radiation was 30% lower than today (Sackmann et al., 1993). It has slowly raised to current levels and will further increase by an additional 50% until the end of its life in 7.5 Ga, before transforming into a white dwarf (where it will have an estimated irradiance 5000 times larger than today) (Solanki, 2002). Theoretically, this would mean that Earth’s temperature in its origins would have been ~16 K lower than today (Fig. 1), well below the freezing point (this is known as the young Sun paradox (Sagan and Mullen, 1972). However, it is likely that a combination of higher GHG concentrations and a much lower albedo, due to lack of clouds, maintained global temperatures to allow liquid water (Haqq-Misra et al., 2008; Goldblatt et al., 2009; Rosing et al., 2010; Goldblatt and Zahnle, 2011). This has a second implication, which is the impact of a brighter Sun on global future temperatures. As stated, the star will continue to increase in irradiance, leading to a higher radiation and warming our planet. This has the potential to increase global temperatures by up to 10 ºC every Ga (Solanki, 2002), probably killing all life on Earth. Yet, when translated to our timeframe it only represents an increase of 0.000001 ºC every century (Fig. 2). Thus, on its own, increased brightness has no impact on near-term climate change.
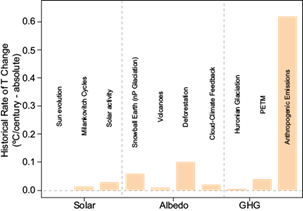
Fig. 2 Maximum historical rate of absolute temperature change (ºC century-1) throughout the history of Earth. While the absolute magnitude of present climate change so far may not be novel in the paleorecord (Fig. 1), it is unlikely that the rate of change has ever been so fast. Present man-made climate change is 10 times faster than the fastest warming periods in the past. (PETM: Paleocene-Eocene thermal maximum; nP: Neoproterozoic.)
2.2 Hundreds of thousand years: Earth’s orbital movements
The second important component that modifies the amount of radiation received by Earth is the distance to the Sun, modified by periodical changes in the Earth’s orbit. These cycles were firstly described by Milankovitch (1920), who showed that Earth’s rotation and revolution is altered by its gravitational interaction with other bodies in the Solar System. As a result, three different variations in our planet’s orbital movements occur: changes in the orbital shape, tilt of the axis and the point of rotation. These cycles are the main driver of slow millennial changes in Earth’s temperature (Huybers and Curry, 2006) and are responsible for glacial and interglacial periods (Hays et al., 1976). The change is not related to the energy received from the Sun, which is stable despite these movements (it varies by less than 0.1 Wm-2), but on how it impacts regional summer insolation, mostly in high latitudes, which triggers internal albedo and carbon cycle feedbacks that lead to the glacial cycles (IPCC, 2013).
The first cycle receives the name of eccentricity, which is a change in the shape of Earth’s orbit from nearly circular to slightly elliptical. This is caused by the gravitational pull from Jupiter and Saturn, leading to a recurrent cycle of 100 000 years where Earth’s eccentricity varies from 0.0034 (almost circular) to 0.058 (slight ellipse). As a result, the distance from our planet to the Sun varies by 11.2%, which means that during the most extreme points of the cycle, the Earth receives 23% more (or less= radiation from the Sun. This is particularly important over the Northern Hemisphere, where it leads to longer winters and shorter summers; as a result, it favors the presence of ice, increasing albedo and leading to a positive cooling feedback. This translates into an overall amplitude in global temperature of 3-6 ºC (Shakun et al., 2012; Tierney et al., 2020) with regional amplifications up to 12 ºC (Fig. 1, Milankovitch cycles) (Petit et al., 1999).
The second motion of the orbit is obliquity or tilting, which is a variation of Earth’s axis of rotation, also known as nutation. This was likely caused by the impact of an exoplanet, which lead to the formation of the Moon. The cycle lasts 41 000 years, altering the axis from 22.1 to 24.5º perpendicular to Earth’s orbital plane (Berger, 1976). Although on its own it has little impact on the global radiation received, it has important implications for climate seasonality, with larger tilting favoring deglaciation and vice versa. In turn, this has a large impact on albedo and GHG concentrations, which means it can lead to changes in global temperature by ~2 ºC (Berger, 1976).
The final orbital variation is precession, which consists of a “wobbling” of Earth’s rotation axis caused by the gravitational pull of the moon and the Sun. The cycle has a period of 23 000 years and while its effects on global temperature are less evident than the previous two, it moderates the length and strength of the seasons in the hemispheres. Axial precession slowly alters the seasonal beginning and ending, leading to regional glaciation/deglaciation cycles. Its net effects on global temperature are 10 times smaller than eccentricity, but still imply it can shift global climate by ~1 ºC (Berger, 1978).
The combination of the three cycles is the primary driver of Earth’s long-term cryosphere dynamics (Hays et al., 1976) and has large implications for all life and biogeochemical cycles (Petit et al., 1999). However, they have no impact on current climate change. Currently, Earth is halfway between its axis extremes and its precession favors stable seasons in the Northern Hemisphere, meaning Earth’s climate is likely in its most stable possible state. Moreover, even in the most extreme case, the combined impact of all cycles leads to a maximum change of 0.012 ºC per century (Fig. 2, Milankovitch cycles).
2.3 Hundreds and thousands of years: solar cycles
As previously stated, the second important contribution to variation in solar irradiance is the Sun’s magnetic field, which manifests as the number of sunspots in any given period. It has been well established that solar magnetic activity has a recurrent 11-year cycle, where its irradiance varies by 0.1% (Willson, 1997). In addition, longer-term fluctuations have been observed since the invention of the telescope, having periods of minimum activity (spotted in 1900, 1810 and 1690) (Eddy, 1976) and maximum activity (observed in 1970). Reconstructions for the last 500 years using historical telescopic records showed a variation of total solar irradiance ranging from 1359 to 1369 Wm-2 or about 0.3% from the mean (Bard et al., 2000). This small fluctuation has little impact on global temperature (0.15-0.3 ºC) but has been recorded to largely modify regional climate, for example over Europe (Ilyashuk et al., 2019) (Fig. 1, Solar activity).
The record of solar activity has been greatly extended recently using carbon and beryllium isotopes in ice cores and tree rings (Solanki et al., 2004; Muscheler et al., 2005; Steinhilber et al., 2012). For the past 10000 years, solar activity, measured as sunspots, has been shown to vary between 0 and 100, with an average of 28.7 ± 16.2 for any given moment (Solanki et al., 2004). Interestingly, during 1940-1980 the number of spots surged to an average of 75, likely increasing global temperature. However, despite stronger recent solar activity, its impact on global temperature pales in comparison to anthropogenic climate change, contributing to at most 0.06 to 0.1 ºC of warming per century (Jones et al., 2012). Moreover, solar irradiance has been decreasing thereafter, potentially meaning we are heading to a new period of minimal solar activity, which in turn could mean a reduction in global temperatures of -0.3 ºC in the 21st century (Feulner and Rahmstorf, 2010; Anet et al., 2013) (Fig. 2, Solar activity).
3. Planetary albedo
The second factor that affects the global energy budget is Earth’s brightness, known as albedo, which alters the proportion of radiation absorbed and reflected to space. Terrestrial albedo varies from 0.04 for asphalt (meaning 99.6% of the incoming solar radiation is absorbed) to 0.8 for fresh snow (20% absorption). Thus, the type of surface has a large impact on global temperature, for example, based on Eq. (3), a 1% decrease in terrestrial albedo translates into 1.5 ºC of warming, hence a 0.05 change in albedo would have a similar impact to all anthropogenic warming so far. Luckily, in the short-term this physical property of the Earth is remarkably stable (Stephens et al., 2015). Current global albedo has been calculated at 0.29 with no interannual variation and with a small seasonal variation of 0.02 (Stephens et al., 2015), driven mostly by changes in land surface snow cover. However, when analyzing larger time scales and selected moments in Earth’s history, a different pattern emerges.
To understand terrestrial albedo’s variation, it must be split into its different components. Four different surfaces intervene to regulate global albedo: the oceans, cryosphere, atmosphere, and land surface. Ocean albedo is mostly constant at 0.06 (although it can vary widely if covered by ice), but the rest of the components display large spatiotemporal variation: ice albedo varies between 0.5 and 0.8, the atmosphere displays a range of 0.15 to 0.40 and land’s albedo varies from 0.05 to 0.4 (Stephens et al., 2015; Wang et al., 2017). Additionally, they are governed by snow-ice, cloud, and tree coverage at any given time, and the fluctuation on these three aspects has been mainly responsible for modifying global albedo for millions of years to centuries.
3.1 Millions of years: Cryosphere and snowball Earth
The brightest moments of our planet (when the least amount of radiation was absorbed) are known as snowball Earth (Kirschvink, 1992). This term has been used to explain the conditions that governed our planet on several occasions, although it usually refers to events during the Neoproterozoic (nP) era (750-500 Ma). This period is characterized by the occurrence of a global glaciation, which meant that the ice- and snow-covered area expanded from the poles into the tropics, albedo surged, and global absorbed radiation plummeted (Hoffman and Schrag, 2002). This created a positive feedback: more ice led to a decrease in temperature, which in turn lead to more ice, a process that lasted for at least 3 million years, but likely 12 (Bodiselitsch et al., 2005). The exact causes of this glaciation are still under debate, but our current understanding suggests that the rise of a new continent (named Rodinia) produced an excessive weathering of rocks, triggering atmospheric CO2 levels to fall, decreasing temperature, and starting the abovementioned feedback (Hoffman et al., 1998). Despite the uncertainty of the mechanisms behind its origin, the nP era represents an ideal case study to show the impact of ice on planetary albedo, therefore on its temperature.
Recent estimates suggest that global albedo was as high as 0.6 during that period (Lewis et al., 2006). Based on Eq. (3), this would translate into a global temperature 35 ºC lower than the current. As a result, tropical ice layers would have been more than 100 m deep, making conditions impossible for life to persist, particularly for photosynthetic organisms (Warren et al., 2002). However, several other processes may be occurring, such as the presence of melt ponds (Wu et al., 2021) and regions of net sublimation (Warren et al., 2002), particularly around the tropics, which suggests albedo may not have been greater than 0.4, which still translates into a global temperature 16 ºC lower than today’s (Fig. 1, Ice-snow).
This has a key implication for current climate change, but on the opposite direction. If warming continues, the ice-covered regions of our planet will melt, revealing the soil that lies below, which has a lower albedo. This will lead to higher radiation absorption and higher local temperatures, accelerating the thawing of surrounding ice, a mechanism known as surface albedo feedback that has already led to a decrease in surface albedo over the Artic of -0.07 to -0.035 per month during the last four decades (Riihelä et al., 2013). If the pattern continues, it could lead to a net decrease of -0.004 over the next century in global albedo (Li et al., 2018), which in turn could mean an additional 0.6 ºC of warming (Fig. 2, Ice-snow).
3.2 Decades to centuries: Atmospheric chemical composition and cloudiness
The second large controller of global planetary albedo in the atmosphere is aerosols. Currently, aerosol particles reflect 22% of the incoming solar radiation back to space, however this number undergoes large decadal variation driven by two processes: volcanoes and human activities (Mishenko et al., 2007). Both processes modify the chemical composition of the atmosphere injecting large concentrations of particulate matter and gaseous precursors of secondary particles (Seinfeld and Pankow, 2003) and, as a result, altering the radiation budget of our planet.
In the short-term, volcanoes are random events, particularly those with an eruption large enough to alter the chemical composition of the atmosphere (those with a volcanic explosivity index above 4). However, on a geological time frame they represent a key driver of climate variability (Robock, 2000). By releasing large amount of sulfur dioxide, they dim global sunlight and reduce solar radiation by 1.5-2% (Stenchikov et al., 1998). As a result, global temperatures decrease by 0.5-1 ºC, an effect that lasts for 1-3 years (Fig. 1, Volcanoes). Although they represent a transitory pulse and their effect disappears after a short time, the constant appearance of large eruptions (about five-seven per century) means they are constantly reducing global temperatures at the geological scale, an effect calculated to be -0.02 ºC per century (Cole-Dai, 2010) (Fig. 2, Volcanoes). Nonetheless it should also be noticed that in the shorter term (e.g., at the human scale) they are isolated events whose impact is negligible after a few years.
The anthropogenic effect on atmospheric albedo is driven by the emission of sulphate aerosols and black carbon into the atmosphere (Ramanathan and Carmichael, 2008). These compounds are the result of an incomplete combustion of coal, diesel, and biomass (e.g., crop residues and biofuels) and lead to dimming of incoming sunlight (Andreae and Crutzen, 1997; Andreae et al., 2005). These compounds are emitted worldwide across both hemispheres and, although they locally heat the atmosphere by absorbing additional radiation, their dimming effect has been responsible for reducing global warming trends during the 1950-1980s by up to 0.07 ºC per decade (based on the trends from Wild et al. [2007]). However, changes in global pollution laws have since led to a decrease in the load of such components into the atmosphere. In turn, Earth experiences a global brightening since the 1990s and then a period of general stabilization since the 2000s (Wild et al., 2009). Thus, when averaged over the last century, anthropogenic impact on planetary albedo throughout these processes has been almost null.
Another key element of Earth’s planetary albedo is clouds. Planetary albedo increases along with cloudiness, since less solar radiation enters the climate system and global temperature drops. Clouds and climate interact in two opposite feedbacks. On the one hand there is a positive cold-cloud feedback, where cold climate favors the formation of tropical stratocumulus that leads to high planetary albedo, reducing temperature and favoring conditions for additional condensation. On the opposite, while warmer climate favors evaporation, leading to greater cloud formation and in turn to decreased planetary albedo (Klein et al., 2017), it also leads to the breaking of stratocumulus clouds into scatter clouds, decreasing their natural shading effect, thus increasing global planetary temperature (Schneider et al., 2019). As a result of these complex processes, cloud-climate feedbacks remain as one of the major sources of uncertainties in current climate models (Brient, 2020).
However, it seems that the second effect is larger, with warmer climates leading to lower planetary albedo. In a recent paper, using state of the art climate models, Zhu et al. (2019) showed that temperature during the early Eocene (~50 Ma ago) was likely much greater than previously anticipated, due to climate-cloud feedbacks. That period is characterized by a high concentration of GHG in the atmosphere, which lead to estimate a temperature 5-9 ºC warmer than the current (Anagnostou et al., 2016) (Fig. 1, Cloud-climate feedback); nevertheless, when adding the effect of cloud feedback, the values were on average 2 ºC higher. These results highlight the potential role of small-scale cloud feedbacks on global climate, with important implications for climate change (Fig. 2, Cloud-climate feedback).
3.3 Decades to centuries: Deforestation and land cover change
The last driver of planetary albedo is the terrestrial vegetation cover, particularly affected by anthropogenic activities. Over the course of our existence, humans have diminished the forest area with many activities: deforestation, fire, transformation to agricultural land, urbanization, to mention a few. As a result, humans have impacted 60% of all land surface and primary forest land has decreased by at least 25% over the last 300 years (Hurtt et al., 2011). In addition, climate warming has also led to an increase in global dryland area and desertification (Reynolds et al., 2007).
Dense forest cover has a typical albedo of 0.1, which is typically lower than any other cover, with the exception of asphalt. Thus, by clearing forests, we have actively increased global albedo. Sagan et al. (1979) estimated that over the course of the last 400 years, desertification and deforestation have caused an increase of 0.05 in global albedo, which translates as a 0.5 ºC decrease in temperature (Fig. 1, Deforestation). From this, a decrease of 0.2 ºC occurred in the period 1950-1975 (Sagan et al., 1979), where the largest deforestation rates occurred in most of the Northern Hemisphere (Hurtt et al., 2011). Since then, global albedo, has remained mostly stable, due to a balance between an increase of albedo in the Southern Hemisphere and a reduction over the Northern Hemisphere, driven by opposite land cover transitions (Fig. 2, Deforestation).
4. Greenhouse gases
The last factor driving global temperatures is the concentration of GHG in the atmosphere. Human activities have almost doubled CO2 concentrations and tripled CH4, which undoubtedly has led to an increase in global temperature and will continue to do so. Although large uncertainty remains on how substantial the warming will be (ranging from 1.2 to 4.8 ºC in the latest IPCC estimates [IPCC, 2013]), our approach to radiation and the planet’s history can bring insight into the matter (Tierney et al., 2020).
Based on Eq. (3), the potential range of warming goes from zero in a GHG-free atmosphere to an increase in temperature of 41.42% if no radiation from the planetary surface escapes to space. Under current solar and albedo conditions, this translates into a range of -18.5 to 30 ºC in the mean global temperature based on both potential emissivity (ε) extremes (-34 to 15 ºC compared to current global temperature, if ε = 0 or ε = 1). Current estimates situate emissivity from GHG at 0.78, which means these gases can increase global temperature by 15 ºC when compared to an atmosphere-free Earth (based on ε = 0.78) (Forster et al., 2007). However, GHG absorption has varied greatly throughout the history of our planet, and extremes are particularly important to understand their role in regulating global climate.
4.1 Millions of years: The Huronian glaciation
There have been several episodes of low temperature in the history of our planet, but the two most important ones possibly were the Neoproterozoic snowball Earth (discussed in the previous section) and the Huronian glaciation (also known as Makganyene). The latter was the longest cold period of our planet, lasting from 2.4 to 2.1 Ga and was related to a drop in GHG concentrations. Current studies pinpoint to two potential causes: a decrease in atmospheric CH4 concentration due to the rise of oxygen (Kopp et al., 2005) and a decrease in CO2 concentration resulting from accelerated weathering due to increase accretion in plate tectonics (Young, 1991). I will discuss both hypotheses and explain how they could have altered Earth’s energy budget. In any case, just with the abovementioned freezing event a plethora of factors influence the period, but I will use it to exemplify the impact of GHG concentration on global temperatures.
The most abundant organic compound regulating climate is CH4. From our planet’s history to modern day, its concentration in the atmosphere has varied greatly, from 5% in early Earth, to 300-1000 ppm during the Proterozoic (2.3 Ga) (Pavlov et al., 2000; Kasting, 2005) to 800 ppb before human industry and to 1.8 ppm today (Saunois et al., 2020). This large variation has been the result of life activity and CH4 interaction with the atmosphere. The largest drop in atmospheric CH4 occurred 2.4 Ga ago because of the surge of photosynthesis, which led to a shift from reduction to oxidation conditions in the atmosphere (Kopp et al., 2005). At first and for the first 900 million years after oxygenic cyanobacteria appeared, free oxygen reacted with suspended oceanic minerals, such as iron and magnesium; however, at some point the mineral oceanic pools were exhausted and atmospheric oxygen began to accumulate. As a result of oxidation, CH4 started to disappear from the atmosphere, and while life continued to produce this gas through fermentation, its concentration plummeted to a tenth of its previous levels (Kasting, 2005), resulting in a decrease of global radiation absorption of 13-25% (ε = 0.59-0.68), leading to a temperature 8-15 ºC lower than the current (Fig. 1, Huronian glaciation).
The second possible explanation for the Huronian glaciation is a reduction of CO2 concentration because of plate tectonics motion. Before the event (2.4 Ga) a record subduction and surface erosion event occurred that lead to the formation of the Columbia supercontinent (Sobolev and Brown, 2019). As a result, increase rock weathering occurred, particularly rock-silicates, which in turn started reacting with atmospheric CO2 (Young, 1991). Atmospheric CO2 went from an estimated 12 000 ppm to levels similar as today (or a 40-fold decrement) (Somelar et al., 2020). Interestingly, on its own this also means a decline in temperature similar to that from CH4 (between 8-15 ºC).
4.2 Hundreds of thousands of years: The Paleocene-Eocene thermal maximum
Just like a reduction in GHG has led to a decrease in temperature with distinctive ice-signatures, an increase is immediately followed by higher temperatures. Due to recent global warming, we are particularly interested in understanding the GHG-climate relationships in the past, and key warm events provide a window to understand possible future scenarios if human emissions continue to rise (Tierney et al., 2020). In that sense, one event has received particular attention for its similarity to the present: the Paleocene-Eocene thermal maximum.
The Paleocene-Eocene transition happened 55.5 Ma and is characterized by a rapid increase in temperature of about 5-8 ºC in less than 10 000 years (Pagani et al., 2006) (Fig. 1, PETM). It was the result of two discrete pulses of C release to the atmosphere, with an average emission rate of 0.2-0.9 PgC year-1 into the atmosphere for 2000 years; thus, it has been studied as an analogy for current climate change (Bowen et al., 2015). The exact reason behind such rapid emissions and warming is still debatable. Hypotheses range from a massive release of oceanic methane hydrates, volcanic eruptions (Gutjahr et al., 2017), a surge in organic carbon oxidation, the rise of an igneous province (Jones et al., 2019), or a meteor impact (McInerney and Wing, 2011). In any case, the result was a surge in atmospheric CO2 concentration that reached a maximum estimate of 55 000 ppm (Pagani et al., 2006; McInerney and Wing, 2011), although the exact value is still under debate and likely close to 3000 ppm (Inglis et al., 2020). It meant an increase in radiation absorption between 11-16% (ε = 0.87-0.91) consistent with at least the quadrupling the current CO2 values (from 400-1600 ppm). The thermal peak lasted about 200 000 years, but it is likely responsible for the high temperatures observed during the whole of the early Eocene (at least 20 Ma). The period is particularly important, as it provides a glimpse of what the climate could be if high-emission scenarios are reached and how long it would take for our planet to re-stabilize afterwards (Tierney et al., 2020). In spite of current doubts around the maximum CO2 concentration and its causes, evidence for temperature increase is clear; however, even if the most extreme warming assumed (8º C over 2000 years) occurs, it would translate into a warming trend of 0.04 ºC per century, which is still 10 times smaller than the current rate (Fig. 2, PETM).
5. Current climate change in the context of Earth’s history
The warming of our planet is occurring. It has been undoubtedly caused by our activities and some of its impacts will last for thousands of years (Solomon et al., 2009). Over the course of the last 400 years, and particularly the last 160, anthropogenic activities have been responsible for emitting enormous quantities of GHG to the atmosphere as the result of fossil fuel burning and land use change. The atmospheric burden from CO2 has increased from 589 to 829 Pg (or from 280 ppm to 415 ppm), while CH4 rose from 2.0 to 4.9 Pg (Friedlingstein et al., 2020). As a result, GHG emissivity has gone up by about 2%, which translates into an increase in global temperature of 0.93 ºC (0.8-1.1º C) since the 1860s (Millar et al., 2017). This translates into a mean temperature increase of 0.62 ºC per century, which could jump to 3 ºC over the next 80 years (IPCC, 2013) (Fig. 1 and Fig. 2, Anthropogenic emissions).
One fundamental aspect to improve our understanding of current climate change is the comparison with previous extreme events (Haywood et al., 2019). In that sense, the conclusions that can be drawn from absolute vs. relative change are remarkably different. When comparing the 1 ºC man-made warming to the variation of other drivers (17 ºC caused by the Sun, 12 ºC by Earth’s orbital movements, or 15 ºC by snow albedo), the former seems negligible (Fig. 1). It is clear that our planet (and the life it contains) has faced more extreme conditions and will likely do the same in the future. Thus, life will undoubtedly prevail this event, but clearly not in all its forms. Nonetheless, the key worrisome aspect of this warming is the speed at which it is occurring.
Despite large variation of solar, orbital, albedo, and GHG concentrations throughout the history of Earth, changes have been relatively slow in comparison to today’s warming. Changes in solar irradiance or Earth’s orbit, while large in absolute values, happen remarkably slow (1000 times slower than current climate change). Even the largest climatic aberrations (fast changes from background climate) such as the Paleocene-Eocene transition, were still 10 times lower that current rates (Tierney et al., 2020) (Fig. 2). Thus, the speed of current warming is possibly unprecedented in our planet (with the exception of climate catastrophes, not addressed in this article).
One key aspect that impeded such rapid changes was the presence of life. The close integration between life and the global biogeochemical cycles, particularly C and N, maintained the rates of temperature change slow for at least the last million years (Petit et al., 1999), but maybe since the dawn of Earth (Lovelock and Lovelock, 2000). Through its impact on albedo, cloud formation and GHG concentrations, conditions have remained remarkably stable for thousands of years (e.g., for the last million years atmospheric CO2 varied from 200 to 280 ppm, a remarkably small range). For life, the current rapid change is something never experienced before (again, not considering climate catastrophes), and its impacts are already evident at multiple biological scales (from genes to biomes) (Scheffers et al., 2016). Most of the current plants and animals, including humans, evolved in a cold period and are adapted better to cold conditions; as a result, between 15-37% of all current species will be at risk of extinction by 2050 (Thomas et al., 2004). The same is true for agriculture, most of which has been domesticated over the last 15 000 years under a relatively stable warm climate (Howden et al., 2007). Our planet has experienced current climate change in terms of absolute magnitude, but in terms of speed it is unprecedent. It is likely the first time in the history of Earth in which such a strong decoupling between life and global abiotic conditions has occurred. This undoubtedly means that life will not be able to mitigate climate change on its own (e.g., through higher CO2 capture in forests or in the ocean, or through additional CH4 consumption by soil microorganisms), and if we do not intervene it will lead to massive extinction and thousands of years of warm climate.
6. Conclusion
The framework presented here proved to be useful when comparing different drivers of global temperature at multiple scales. It allows for a direct comparison of magnitude and rate of climate change, as driven by changes in incoming solar radiation, albedo, and GHG. Furthermore, it provides a unifying framework to compare the Earth’s radiation budget at different time periods, providing interesting insights not only for the past, but for future climate change as well. Nevertheless, several key limitations of this simple approach need to be considered: the lack of interaction between components, the lack of a measurement of internal feedbacks and the impossibility to include external catastrophic climatic events, such as the impact of meteorites.
Nevertheless, it is interesting to note that, with a seemingly simple equation, we can quickly compare the absolute impact of different forcings on global temperature or the rate of temperature change in key historical moments of the paleorecord. In particular, the framework is interesting to situate human-made climate change in the context of previous warming events, to clearly show that the current rate of temperature increase is unlikely to have occurred previously.

