


 text new page (beta)
 English (pdf)
 Article in xml format
 Article references
 Send this article by e-mail
 Cited by SciELO
  Similars in
SciELO
Similars in
SciELO 
 Permalink
1. Introduction
Atmospheric convection is one of the most important processes in Earth’s climate system. It is crucial for the planet’s energy balance due to its vertical transport of energy and moisture and is also responsible for most of the tropical precipitation (Sundqvist, 1978; Zeng, 1998; Betts and Jakob, 2002). Atmospheric convection is extremely complex, since it involves many spatio-temporal scales, and incorporates multiple feedbacks between radiation, fluid dynamics, thermodynamics, and microphysics. Its multiple-scale nature makes it hard to parametrize in climate models and constitutes a challenge for observations (Bretherton et al., 2004).
Convection is especially important in the tropics since it produces two-thirds of the precipitation in this area (Zeng, 1998). Thus, to understand precipitation in the tropics, it is essential to study the convective processes and parameters in this area. Unlike regions at higher latitudes, where strong horizontal temperature and pressure gradients are responsible for the main synoptic systems that determine precipitation, at low latitudes precipitation is mainly produced by local moist convective processes. Therefore, convection plays a very important role in the hydrological cycle of the tropics and is also essential for weather prediction (Sherwood et al., 2010).
Column-integrated water vapor, also often referred to as precipitable water vapor (PWV), has been shown to be a key variable in order to understand convective processes in the tropics (e.g., Bretherton et al., 2004; Holloway and Neelin, 2009, 2010; Adams et al., 2013, 2015). The combination of convergence and moisture is crucial for deep convection to develop since these two can interact to allow for convection to organize into deeper cells. Some authors (e.g., Sherwood et al., 2004) describe how dry layers of air in the mid-troposphere can inhibit the development of convection or can change its intensity. Other studies (e.g., Crook, 1996; Tompkins, 2001; Roberts et al., 2008) note that small variations in surface water vapor fields can produce considerable changes in convection development and intensity. For this reason, monitoring the evolution of PWV during the different stages of convective events can provide useful indications of local relevant processes. However, due to the relatively short time scales involved in atmospheric convection, high temporal resolution observations of PWV are required, which cannot be obtained from typical operational soundings, but rather from other methods such as Global Navigation Satellite System (GNSS) stations. GNSS has a subset called GPS which has geodetic applications that require very precise knowledge of the various delays that an electromagnetic wave is subjected to as it travels through Earth’s atmosphere, and the total amount of water vapor in the atmospheric column is one of them. Since the 1990s, the methodology proposed by Bevis et al. (1992, 1994) provides a very precise estimate of the PWV from the total tropospheric delay of the GPS signal combined with observations of surface air temperature and pressure. The main advantages of this technology, which are of particular use for convection studies, are that it works under all-weather conditions and that it is capable of providing very high temporal resolution (~5 min).
For example, studies by Adams et al. (2011, 2013) use PWV from GPS stations to study fundamental features of convection in the Amazon. In particular, Adams et al. (2013) found two characteristic time scales for the shallow to deep transition of convection in the Amazon: an 8-h time scale of weak water vapor convergence, followed by a more intense 4-h time scale convergence. These results provide important insights into the typical behavior of convection, which can be used as benchmarks for numerical model evaluation. Furthermore, combining such observations with other meteorological variables can be useful to identify the different roles that different processes have within a convective event.
Here we use this approach to investigate the main characteristics of convective events that occur in the Sabana de Bogotá, which hosts the Colombian capital with a population of around 7.5 million (Fig. 1). With a latitude of 4.5º N, it is located on a 2550 m high savanna surrounded by mountains in the tropical Andes. Thus, convection at this location is strongly affected by the mountain ranges, and despite its low latitude, the nature of convection events can be very different from other low-elevation locations such as those studied by Adams et al. (2013). Additionally, topography can change the local wind flow, and by doing so, modify the precipitation patterns (e.g., Fairman et al., 2011; Smith et al., 2011). This makes the Sabana de Bogotá a very particular study area, with very specific convective dynamics, but at the same time very relevant due to its tropical location and high population density. Montoya and Eslava (2000) describe how most storms in Bogotá are produced by diurnal convection. They hypothesize that intense storms in Bogotá develop due to humid and warm air masses transported by early-afternoon westerlies from the Magdalena valley (to the west of Bogotá), which produces convergence, instability, and humidifies the environment. However, there is still no direct observational confirmation of this mechanism.

Fig. 1 (a) Location of the Sabana de Bogotá, Colombia (red star) and its surrounding topography. (b) Close-up of the surroundings of the Sabana de Bogotá. Deep convective events are identified in the blue grid, red stars indicate the locations of the rain gauges used to confirm these events, the red triangle denotes the location of the station used for composite analysis (El Dorado), and the blue triangle shows the location of the International GNSS Service (IGS) BOGT station. The red rectangle corresponds to the area where 3-hourly TRMM precipitation data is considered.
To identify deep convective events in this area we use GOES-13 infrared images, TRMM (3B42) precipitation data every 3, with a spatial resolution of 0.25º (TRMM, 2011), and in situ precipitation data from five automatic rain gauges. To study the atmospheric conditions associated with these events, we use weather information from one of these locations (El Dorado airport), where data has best temporal coverage and quality. The low number of stations with the high temporal resolution required to study isolated convective events provides a limitation to investigate urbanization effects (e.g., Freitag et al., 2018). However, here we are able to describe the atmospheric conditions that predominate when deep convective events develop, and when convection does not develop. This allows us to better understand which are the most favorable atmospheric conditions for the occurrence of deep convective events in the Sabana de Bogotá, leading to a simple conceptual model that describes the most relevant fundamental processes.
2. Data and method
To identify deep convective events (DCE) in the Sabana de Bogotá, we use infrared images from GOES-13 (NOAA OSPO, 1994) between 2011 and 2017, which is the operational time period of this satellite. These images have a native resolution of about 4 km and are available every 30 min for this region. For each image, brightness temperature (BT) is averaged in the four square 16 × 16 km boxes shown in Figure 1b. Following Adams et al. (2013), we consider a convective event whenever the average BT inside one or more boxes is below 230 K, and there is a decrease in average BT of at least 50 K in 2 h, within a 3-h window. Such a rapid decrease in BT constitutes a clear signature of the deepening of a convective system. Additionally, we use precipitation data from five automatic rain gauges at different locations throughout the Sabana de Bogotá (see Fig. 1b). We only consider cases in which a precipitation intensity of at least 5 mm in 30 min is observed at least at one of these rain gauges within the 3-h window of each event. To investigate the atmospheric conditions associated with convective events, we use meteorological data from the automatic weather station from the Instituto de Hidrología, Meteorología y Estudios Ambientales (IDEAM), located at Bogotá’s international airport (El Dorado). This station provides precipitation and wind data every 10 min, as well as hourly surface air temperature (2 m) and pressure data (IDEAM, 2019). Non-convective days (NCD) are identified as days in which the average BT in the four boxes remains above 250 K between 12:00 and 18:00 LT (UTC-5), with no precipitation in any of the rain gauges nor in the 3-hourly TRMM precipitation data (Huffman et al., 2007) between 11:30 and 17:30 LT in the area indicated in Fig. 1b.
An important asset of this study is the use of precipitable water vapor (PWV) from one GPS station. Tropospheric delay is estimated based on GPS data collected and processed by the Space Geodesy Research Group of the Colombian Geological Survey at the International GNSS Service (IGS) BOGT station (see Fig. 1b for the station's location) with the precise point positioning (PPP) strategy using Gipsy-X software (Bertiger et al., 2020). From the tropospheric delay, we estimate PWV following Bevis et al. (1992, 1994) using air pressure and temperature data from the nearest IDEAM weather station, located 900 m away at the same elevation. Unfortunately, this automatic weather station has long periods of missing data (close to 38 months between 2011 and 2017), so in order to have PWV data for as many DCE as possible, we use hourly climatological values of pressure and temperature to compute the entire PWV time series. This is possible because pressure and temperature at this low latitude location have a very consistent diurnal cycle with very little variability. In fact, comparing the more precise PWV calculations when actual surface temperature and pressure data are available, with those used here, results show a mean error of only 0.05 mm, with RMSE = 0.4 mm.
Finally, hourly ERA5 (Hersbach et al., 2019; Muñoz, 2019) reanalysis data with a 0.1º (surface air temperature, surface pressure, surface wind velocity) and a 0.25º (PWV, divergence, vertically integrated moisture divergence [MD] and vertically integrated water vapor flux [WVF]) resolution are used to investigate regional atmospheric patterns associated with convective events at the Sabana de Bogotá.
3. Results and discussion
3.1 Temporal distribution of convective events
Based on the GOES-13 infrared images we identify 536 convective events, which take place in 467 days. Since the entire period 2011-2017 has 2556 days, this indicates that convection occurs in ~18% of the days. However, convection events are not equally distributed throughout the year, nor throughout the day. Events are concentrated in the two rainy seasons and are most frequent during the early afternoon (Fig. 2a, b). If we limit ourselves to the months of February-May and October-November (see below for justification), we find 372 events taking place in 323 days, which corresponds to 26% of the days (red bars in Fig. 2a, b). Nevertheless, as mentioned in the previous section, we only consider events that have a clear intense precipitation signal at one or more of the five rain gauges, which reduces the number of events to 128, most likely for two reasons: first, precipitation may have not fallen exactly at these locations, and second, precipitation data from the rain gauges are not always complete. However, notice that the monthly and hourly distribution of these filtered events (Fig. 2c, d) is similar to the entire population of events, as is also shown by the hourly distribution of the events during the months of interest (red bars in Fig. 2b, d). Given that we require good quality in situ meteorological information for this study, we consider these 128 events as a starting point.

Fig. 2 (a, c) Monthly and (b, d) hourly distribution of deep convective events in the Sabana de Bogotá as identified from GOES-13 infrared images (a, b), and considering only those with a clear precipitation signal in at least one of the rain gauges (c, d). In the four panels, red bars correspond to the number of cases only during the months of interest (February-May and October-November).
Convective events occur mainly between February and May, and between October and November, in the early afternoon hours (Fig. 2). Since we are interested in studying the characteristics of the typical or most frequent convective cases, it is convenient to limit this study to the months where most events occur, which closely match the two rainy seasons at this location. These two seasons (February-May, October-November) may have slightly different large-scale circulation patterns (e.g., Wang and Fu, 2002; Vera et al., 2006), but locally are very similar. In fact, the local wind and moisture fields of these two seasons are very similar (not shown here). This allows us to consider both seasons together, which on the other hand is more convenient to have a larger sample of events. Therefore, we only consider cases during the aforementioned months, which leaves us with 105 deep convective events (red bars in Fig. 2c, d) distributed throughout 102 days. On the other hand, 61 of these events have complete meteorological data available at El Dorado, which is the station we use as a reference to study the atmospheric conditions associated with deep convective events. 43 of these (70%) are associated with westerly winds (wind direction between 202.5º and 337.5º), consistent with observations reported by Montoya and Eslava (2000), who also found that the occurrence of intense storms coincides with an early afternoon change in wind direction from the predominant easterlies to westerlies. Based on GOES-13 infrared images and precipitation data from TRMM, we also identify 1284 NCD, out of which 508 correspond to the months February-May and October-November. Of these days, 152 have wind data, with 39 showing westerly winds between 12:00 and 14:00 LT, which we use in order to compare to DCE with early afternoon westerlies. Table I summarizes all these numbers, together with the corresponding percentages.
Table I Summary of the relevant numbers and percentages related to the convective and non-convective identified days. Percentages are relative to the periods indicated in the first column, except otherwise stated.
| Periods | DCE days | NCD | DCE days with in situ intense precipitation | DCE days with wind data | DCE with westerlies | NCD with wind data | NCD with westerlies |
| Entire period 2011-2017 (2556 days) | 467 (18%) | 1284 (50%) | 125 (27% of DCE days) | - | - | - | - |
| Feb-May, Oct-Nov (1262 days) | 323 (26%) | 508 (40%) | 102 (32% of DCE days) | 61 (60% of DCE days with precip) | 43 (70% of DCE with wind data) | 152 (30% of NCD) | 39 (26% of NCD with wind data) |
DCE: deep convective events; NCD: non-convective days.
These results indicate that convection at this location is mostly diurnally forced during the two rainy seasons in this region, which are primarily a consequence of the latitudinal migration of the Intertropical Convergence Zone (ITCZ), and thus consistent with previous studies (e.g., Montoya and Eslava, 2000; Aragón, 2015). The fact that convection peaks in the early afternoon (14:00-15:00 LT) suggests that the diurnal forcing near the surface is strong, and events have a short developing timescale in comparison with most tropical continental locations where convection peaks later in the afternoon (e.g., Bowman et al., 2005; Liu and Zipser, 2008).
3.2 Behavior of atmospheric variables
In order to identify the atmospheric conditions associated with deep convective events, we construct hourly composites of air temperature, atmospheric pressure, wind direction, wind speed, precipitable water vapor, and for the vertical integration of water vapor flux and moisture divergence. We do this for three sets of cases: AVG (which corresponds to the entire months of February-May and October-November), DCE (which corresponds to deep convective events during these same months), and NCD (which corresponds to non-convective days). We do not find any significant signal in atmospheric pressure related to the convective events. This is not surprising, since at low latitudes the slight pressure perturbations related to deep convective events cannot be detected with hourly data (e.g., Holton, 2004). Therefore, we do not show atmospheric pressure composites here.
Wind direction is predominantly from the northeast during the months of interest (Fig. 4a) but tends to become westerly most of the days between 14:00 and 17:00 LT (Figs. 3 and 4b). Notice that in the early afternoon, winds from the west (including northwesterlies and southwesterlies) are present in 44% of the available data (Fig. 4b). Furthermore, if we count days with afternoon westerlies as those in which the hourly mean of the wind direction is from the west at least during one hour between 14:00 and 17:00 LT (not shown here), we find that this adds up to 78% of the days. On the other hand, the frequency of convective days during the months of interest is 26%, or even less if we only count cases with intense precipitation recorded at any of the five rain gauges (Table I). Therefore, though westerlies are usually present during convective events (in about 70% of cases), most days with westerlies do not necessarily result in DCE. On the other hand, during days with DCE wind direction does turn earlier to the west than in AVG, but in NCD the wind direction is similar to DCE. This indicates that wind direction is probably important but not essential for the generation of convection, and possibly not a reliable predictor.
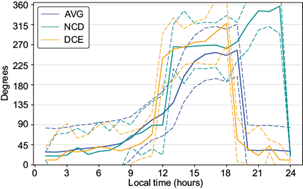
Fig. 3 Wind direction composites in El Dorado. AVG values are in blue, DCE in orange, and NCD in green. Dotted lines represent one standard deviation.
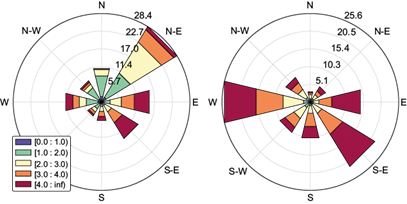
Fig. 4 Average wind direction for El Dorado corresponding to (a) all day and (b) the afternoon hours (14:00 to 17:00 LT), in both cases for February to May and October to November for 2011 to 2017. Colors indicate wind speed (see legend), and numbers at different radii indicate the corresponding percentage of occurrence.
On the other hand, surface air temperature reaches a higher maximum in DCE compared to NCD and AVG around noon, but decreases faster and to lower values during the afternoon, probably due to evaporative cooling (e.g., Park et al., 2017) during and after the convective event (Fig. 5a, b). This is consistent with convection driven by surface heating (e.g., Emanuel 1994). Figure 5c, d show that wind speed has a particular behavior in DCE compared to average conditions. Before noon on deep convective days, wind speed is considerably slower than in AVG and NCD (almost one standard deviation). This could be important because a slower wind speed can facilitate water vapor convergence and a better organization of convective clouds (e.g., Tian and Parker, 2002; Kirshbaum and Wang, 2014; Nugent et al., 2014). In days with DCE, wind speed has a steeper increase than in AVG from 11:00 to 14:00 LT. Afterward, wind speed decreases very rapidly between 14:00 and 15:00 LT, such that it again becomes slower in the late afternoon and at night compared to average conditions. Similar behavior has been reported by Adams et al. (2013), with a rapid increase in wind speed followed by a steeper decrease before and after deep convective events in the Amazon. This feature is clearly depicted with the wind speed tendency in Figure 5d and seems to be a prominent feature of DCE at this location.

Fig. 5 Composites of surface air temperature, wind speed, and PWV (a, c, e) and their corresponding tendencies (b, d, f) in El Dorado. AVG values are in blue, DCE in orange, and NCD in green. Dotted lines represent one standard deviation. (PWV: precipitable water vapor; AVG: February-May and October-November; DCE: deep convective events; NCD: non-convective days.)
One parameter that seems crucial for DCE is PWV (Fig. 5e, f) (Mora-Páez et al., 2020). Throughout the entire day of deep convective events, PWV is significantly higher than during NCD or the average conditions. It also has a steeper increase between 12:00-16:00 LT, consistent with the time of the day when most convective events develop. The behavior of PWV is very similar to that reported by Adams et al. (2011, 2013, 2015), but differs in magnitude (Bogotá has lower values than Manaus mostly due to its high elevation). In Bogotá, PWV has a slow increase during 2 h (9:00 to 11:00 LT) followed by a steeper increase for about 3 h, so the development of convection seems to occur faster in Bogotá (i.e., 3 h) than in Manaus (i.e., 8 h). Another important difference is that in Bogotá, PWV does not decrease rapidly after the precipitation peaks, as it does in Manaus (Adams et al., 2013). This could be because convective events in Manaus produce more intense precipitation than those at the Sabana de Bogotá.
3.3 Regional behavior of atmospheric variables
We construct composites using reanalysis data from ERA5 to investigate the evolution of regional patterns of the relevant atmospheric variables associated with deep convective events in the Sabana de Bogotá. In general, ERA5 composites are consistent with the results from the individual surface stations described in the previous section. For example, temperature increases to higher values in DCE and then decreases to lower values compared to the overall average. Furthermore, the spatial distribution of surface pressure in the afternoon according to ERA5 (not shown here) shows a dipole consistent with the westerly turn of the winds observed at the surface stations. However, the weaker wind speed detected by the surface stations is not visible in the ERA5 data (not shown here). In fact, ERA5 data suggest higher wind speeds during DCE compared to the AVG. This implies that the decrease in wind speed may be a local effect, which the coarser reanalysis data does not capture. On the other hand, composites of ERA5 divergence at 250 hPa (not shown here) are consistent with the occurrence of convection relative to average conditions (higher than average divergence values at 250 hPa are found for DCE). However, 250 hPa divergence values during NCD are higher than during convective days, suggesting that the dynamical forcing may be similar, or even stronger, during non-convective days than during deep convective days. Thus, other processes may be more determining, such as, for example, moisture content and dynamics. Despite this, in general, we argue that the ERA5 data captures the main signals associated with the occurrence of DCE, so we can use it to further investigate the regional patterns that cannot be otherwise investigated with the available surface station data.
Within ERA5 data, PWV exhibits an important behavior related to DCEs (Fig. 6): throughout the afternoon, PWV has higher values in DCE in comparison to NCD and to AVG, but along the Magdalena river valley it clearly has lower values. This, together with higher values of moisture divergence (MD) (Fig. 7) in Bogotá suggests that the high moisture content associated with DCEs is related to local convergence rather than transported from the Magdalena valley, as hypothesized by Montoya and Eslava (2000). Furthermore, the vertically integrated water vapor flux (WVF) from ERA5 (Fig. 8) indicates that moisture is normally advected from the east. During DCE, this flux is lower than in AVG and NCD, suggesting that local convergence plays a more important role. However, higher spatial resolution observations would be needed to confirm this, since reanalysis data is not expected to capture smaller scale circulations, especially with such complex terrain in the deep tropics. All these features suggest that although dynamical processes linked to westerly winds seem necessary, sufficient moisture content is crucial. This also indicates that PWV may be used as an indicator for the formation of deep convection, as shown in other studies (e.g. Crook, 1996; Sherwood et al., 2004; Weckwerth and Parsons, 2006; Keil et al., 2008; Holloway and Neelin, 2009, 2010; Benevides et al., 2015; Liang et al., 2015).

Fig. 6 (a, b, c) composites of DCE-AVG and (d, e, f) DCE-NCD anomalies of precipitable water vapor from ERA-5 reanalysis data at 12:00 (a, d), 13:00 (b, e), and 14:00 (c, f) LT. The dots indicate the location of El Dorado weather station (left) and the GNSS station (right), and contour lines indicate elevations of 500 and 2500 m. (DCE: deep convective events; AVG: February-May and October-November; NCD: non-convective days.)

Fig. 7 Vertically integrated moisture divergence (MD) composites of (a, b, c) AVG, (d, e, f) DCE, and (g, h, i) NCD from ERA-5 reanalysis data at 12:00 (a, d, g), 13:00 (b, e, h), and 14:00 (c, f, i) LT. The dots indicate the location of El Dorado weather station (left) and the GNSS station (right), and contour lines indicate elevations of 500 and 2500 m. (AVG: February-May and October-November; DCE: deep convective events; NCD: non-convective days.)

Fig. 8 Vertically integrated water vapor flux (WVF) composites for (a, b, c) AVG, (d, e, f) DCE, and (g, h, i) NCD from ERA-5 reanalysis data at 12:00 (a, d, g), 13:00 (b, e, h), and 14:00 (c, f, i) LT. The dots indicate the location of El Dorado weather station (left) and the GNSS station (right), and contour lines indicate elevations of 500 and 2500 m. (AVG: February-May and October-November; DCE: deep convective events; NCD: non-convective days.)
4. Conclusions
Here we study the characteristics of deep convection events (DCE) in the Sabana de Bogotá between 2011 and 2017 to better understand this phenomenon. Since this is a low-latitude location, convection is the main precipitation-producing process, and it is also the main cause for extreme rainfall events that may affect this densely populated area. Furthermore, the region’s high elevation (~2550 m) and surrounding topography create specific conditions that determine the local dynamics of convection and make it difficult to study without in situ observations of high temporal resolution. A better understanding of the main convective drivers in this region is extremely valuable to improve short-term weather forecasting, to provide better input for local risk management, and to improve our understanding of tropical convective processes in mountainous areas.
Using GOES-13 infrared images we identify 430 DCE, of which 128 caused precipitation at one or more of the five in situ stations we considered. These events occur mostly during the two rainy seasons and between 14:00 and 16:00 LT, so we limit our study to these periods of time. In order to identify the atmospheric patterns associated with DCE, we carry out a composite analysis of in situ measured atmospheric variables (surface air temperature, atmospheric pressure, and wind velocity), precipitable water vapor (PWV) from a GPS station, and ERA5 reanalysis data. We also construct composites for non-convective days (NCD) and for multi-year hourly mean conditions (AVG) to compare them.
Previous studies of convective activity in this region (e.g., Montoya and Eslava, 2000; Aragón, 2015) suggest that the main driver for afternoon storms is a westerly turn of the otherwise predominant easterlies and the possible associated moisture transport from the Magdalena valley that lies west of Bogotá. Our results suggest that westerly winds are an important ingredient of convective events (they are present in 70% of them), consistent with the convergence they generate in the Sabana de Bogotá. However, westerly winds appear in 78% of the afternoons in the two rainy seasons, whereas deep convective events occur in only 26% or less of these days. This implies that although westerly winds and their convergence are important for deep convection to take place, they are not a good indicator of convective initiation. Furthermore, reanalysis data (PWV, and vertically integrated moisture divergence and water vapor flux) suggests that: (a) moisture content over the Magdalena river valley is lower than average during convective days, (b) water vapor is mainly advected from the east, and (c) local water vapor convergence is more important than advection from nearby regions. Although reanalysis data must be carefully interpreted at these scales and with such complex topography, this does suggest that local processes may be more important than any moisture advection from the Magdalena river valley. However, further research will be necessary to confirm this and determine with precision the relevant moisture sources.
Our results point towards three variables in terms of their relevance for the development of deep convection: wind speed, surface air temperature, and PWV. Wind speed is weaker in the morning of convective days, allowing for convection to organize. After this, a rapid increase in wind speed occurs from 12:00 to 15:00 LT, while surface air temperature also reaches higher than average values. Meanwhile, PWV increases rapidly from 12:00 to 15:00 LT reaching its maximum at the time when most convective events occur. After this, temperature and wind speed decrease to lower-than-average values, while PWV decreases slowly and remains with above-average values. Therefore, we propose that the main short-term precursors for a deep convective event during the rainy seasons in this region are: (a) a weaker than average wind speed throughout the morning, with (b) higher than average surface air temperature towards noon, followed by (c) a rapid increase in PWV (and in wind speed) that leads to the convective event. Based on our PWV and moisture divergence (MD) data, we identify a water vapor convergence time-scale of about 3 h that precedes the deep convective events. Adams et al. (2013) found two water vapor convergence time-scales for deep convection in Manaus, of 8 and 4 h. We hypothesize that the complex topography and high elevation of the Sabana de Bogotá make larger and longer-lasting convection events very difficult to develop due to the multiple perturbations in the dynamic and thermodynamic fields, and only smaller and shorter-lived systems occur.
We find that PWV is a very useful indicator of developing deep convective events in this region. However, for this variable to be useful, it must be measured with high temporal resolution, as is the case with GPS stations. This motivates further efforts for implementing a comprehensive atmospheric water vapor monitoring program using the existing GPS station network in Colombia (Mora-Páez et al., 2020). For example, using this network it would be possible to investigate the possible sources of moisture that feed the deep convective events described here. Furthermore, this network can be used to improve short-term forecasting of extreme events throughout Colombia, and in general to study the dynamics of tropical convection under a wide variety of tropical conditions.

