


 nueva página del texto (beta)
 Inglés (pdf)
 Artículo en XML
 Referencias del artículo
 Enviar artículo por email
 Citado por SciELO
  Similares en
SciELO
Similares en
SciELO 
 Permalink
1. Introduction
The Costa Rican Western Central Valley (WCV) is limited to the northwest by the Central Volcanic mountain range, to the east by the hills of Ochomogo, and to the southwest by the foothills of the Talamanca mountain range. The average altitude of the WCV is about 1000 m above sea level (m.a.s.l.), with values up to 2000 m.a.s.l. in some places (IMN, 2008).
The region’s average annual precipitation is 2300 mm, with two clearly marked seasons: a rainy season from May to November and a dry season from December to April. During the rainy season, a relative minimum of precipitation occurs in July-August, known as the veranillo or mid-summer drought (Magaña et al., 1999). Temperature and relative humidity show small changes, with average values of 20 ºC and 75 %, respectively, varying with altitude and the time of the year (Solano and Villalobos, 2000; IMN, 2008). The predominant winds are the trade winds that blow from the northeast to the southwest. The Central Volcanic mountain range allows the passage of trade winds over the mountains or through mountain passes (mainly the gaps of La Palma and Desengaño). The seasonal variation of wind intensity, associated with the Caribbean low-level jet, determines most of the climatic changes in the WCV (Muñoz et al., 2002; Amador, 2008). Another characteristic pattern of the wind in the WCV is related to mountain-valley circulations. These are generated by temperature differences between both geographic landforms during the day, causing the wind to move from the mountain to the valley in the morning and in the opposite direction in the afternoon (Zárate, 1978; Barrantes et al., 1985). Due to the climatic and orographic conditions of the WCV, this area can be considered an Atmospheric Basin (AB). Here the climatic variability, circulation, and dispersion of air pollutants are driven mainly by the prevailing direction of winds and orography (Zárate, 1980; Muñoz et al., 2002; Caetano and Iniestra, 2008; García-Reynoso et al., 2009; Herrera et al., 2012; SEMARNAT-INECC, 2016).
Metallic materials are thermodynamically unstable under atmospheric conditions, which causes their deterioration, giving rise to the atmospheric corrosion phenomenon. A usual way to evaluate this process is by obtaining the loss of material in a fundamental state with respect to the time of exposure to the environment. This way allows the corrosion rate estimation as a loss of mass per unit area (mg m-2 y-1) or as a loss of sheet thickness (µm y-1) during the exposure time. Low carbon steel is the most common material for visualizing corrosión, similar to ASTM A36/A36M-19 (ASTM International, 2019).
Previous research by Morcillo et al. (2011) and the guidelines of the ISO 9223:2012 standard state that temperature (T), relative humidity (RH), chlorides (Cl-), and sulfur oxides (SO2) are the primary agents that contribute to corrosion. Temperature and relative humidity provide enough conditions for the material oxidation process, while pollutants modify the oxides formed on steel surfaces, producing distortion in the crystalline network and structural weakness. Consequently, materials turn more labile and porous, becoming more susceptible to corrosive attacks (Feliu et al., 1993; Morcillo et al., 2013; Díaz et al., 2018).
Temperature and relative humidity variables are obtained from meteorological data, and the deposition of both chlorides and sulfur oxides is measured or estimated by air pollution evaluation methods. These parameters permit the characterization of the effects of pollution variation on the corrosion rate in the WCV (Morcillo et al., 1998; Roberge et al., 2002; Morcillo et al., 2012; Robles, 2013; Garita-Arce et al., 2014; Rodríguez-Yáñez et al., 2015; Alcántara et al., 2015; Morcillo, 2017).
Garita-Arce et al. (2014) proposed a series of models for obtaining corrosion rates depending on the available information. For Costa Rica, maps of applicability of the corrosion models are based on the work of Rodríguez-Yáñez et al. (2015). These maps present an increasing complexity, starting from the Brooks deterioration index to the ISO 9223 (ISO, 1992) standard and using linear equations to model corrosion rate. The updated ISO 9223:2012 (ISO, 2012a) standard includes a new model for estimating corrosion. It considers the annual corrosion as a function of climatic and pollution variables.
2. Data and methods
Hourly meteorological data for several stations within the WCV were provided by the National Meteorological Institute and the Costa Rican Electricity Institute (IMN and ICE, respectively, by their Spanish acronyms). Figure 1 shows the location of the area of study. The analysis period was from 2010 to 2019 (see Table I). Only meteorological stations with less than 5 % of missing data were considered. From these data, the variables of interest were T and RH. The time of wetness (TOW), defined as the fraction of hours per year where T is greater than 0 ºC and RH is greater than or equal to 80 %, was also obtained.
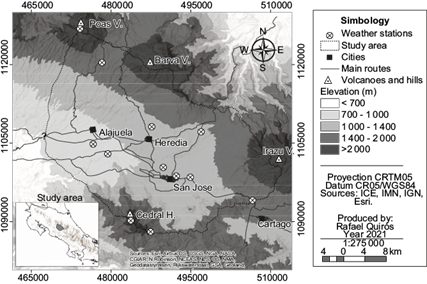
Table I Location of the meteorological stations available in the WCV.
| Name | North latitude | West longitude | Altitude (m.a.s.l) | Start date | End date |
| RECOPE, Ochomogo | 09º 53’ 40.2” | 83º 56’ 19.4” | 1546 | 01/01/2010 | 31/01/2018 |
| CIGEFI | 09º 56’ 11.0” | 84º 02’ 43.0” | 1210 | 01/01/2010 | 31/01/2018 |
| IMN, Aranjuez | 09º 56’ 16.6” | 84º 04’ 10.8” | 1181 | 01/01/2010 | 31/01/2018 |
| Juan Santamaría International airport | 09º 59’ 26.5” | 84º 12’ 52.9” | 913 | 01/01/2010 | 15/02/2018 |
| Fraijanes lake | 10º 08’ 14.4” | 84º 11’ 36.6” | 1720 | 01/01/2010 | 31/01/2018 |
| RECOPE, La Garita | 10º 00’ 19.0” | 84º 17’ 45.0” | 740 | 12/01/2010 | 31/01/2018 |
| West Pavas, near to airport | 09º 57’ 26.3” | 84º 08’ 51.6” | 997 | 01/01/2010 | 05/03/2015 |
| Santa Bárbara | 10º 02’ 00.0” | 84º 09’ 57.0” | 1070 | 01/01/2010 | 31/01/2018 |
| Belén | 09º 58’ 30.0” | 84º 11’ 08.0” | 926 | 01/01/2010 | 02/11/2017 |
| Burio hill, Aserrí | 09º 50’ 25.3” | 84º 06’ 45.6” | 1811 | 14/11/2012 | 12/10/2017 |
| Altos Tablazo, Higuito | 09º 50’ 12.4” | 84º 03’ 18.1” | 1660 | 28/06/2012 | 31/05/2017 |
| Chitaria hill, Santa Ana | 09º 53’ 30.1” | 84º 11’ 37.3” | 1717 | 01/03/2011 | 11/10/2017 |
| Poás volcano lake | 10º 11’ 21.0” | 84º 13’ 55.2” | 2598 | 05/09/2011 | 12/02/2018 |
| Cedral hill, Escazú | 09º 51’ 41.1” | 84º 08’ 45.2” | 2255 | 29/08/2012 | 12/10/2017 |
| School of Agricultural Sciences, Santa Lucía, Heredia | 10º 01’ 22.8” | 84º 06’ 42.4” | 1257 | 19/11/2013 | 31/01/2018 |
| West Tobías Bolaños airport, Pavas | 09º 57’ 26.3” | 84º 08’ 51.6” | 981 | 05/03/2015 | 10/10/2017 |
| San Luis | 10º 00’ 54.0” | 84º 01’ 36.0” | 1341 | 01/09/2018 | 31/9/2019 |
| Colima | 09º 57’ 09.0” | 84º 05’ 24.2” | 1145 | 01/01/2010 | 12/31/2017 |
2.1 Atmospheric conditions and air pollution
Within the studied period, the number of both warm (El Niño) and cold (La Niña) phases of the El Niño-Southern Oscillation (ENSO) is similar (NOAA, 2019). ENSO episodes are linked to inter-annual variations in circulation and precipitation patterns over Costa Rica (Fernández et al. 2013).
On the other hand, the volcanic activity was low and spaced in time. It was mainly associated with eruptions of the Poás and Turrialba volcanoes in 2015. During most of these eruptive events, winds were not blowing toward the WCV (OVSICORI, 2015). Under these conditions, several authors have shown that pollution levels of chlorides and sulfur oxides in the WCV are about 5 mg m-2 d-1 and 10 mg m-2 d-1, respectively (Robles, 2013; Herrera-Murillo et al., 2014). These levels correspond to a low polluted atmosphere.
2.2 Corrosion models
According to the results of Garita-Arce et al. (2014) for the low carbon steel, an estimation curve of the corrosion rate at the WCV can be derived from meteorological parameters, specifically RH and TOW. Corrosion rate (Vcorr) for the WCV is a linear function of TOW or RH, as given by the following equations:
where,
Vcorr |
corrosion rate, µm y-1 |
TOW |
fraction average annual hours of wetness, dimensionless |
RH |
average annual relative humidity, % |
The above equations were determined for an altitude of 1108 m.a.s.l. in the La Sabana sector of San José, Costa Rica.
The ISO 9223:2012 standard contains guidelines to determine Vcorr. One of them is to utilize the corrosion categories listed in Table II. A second alternative is to obtain it by employing model equations. In this standard, the set of equations to calculate the corrosion of carbon steel is:
where,
f st |
factor of Steel |
Vcorr |
corrosion rate in the first year, µm y-1, |
T |
annual average temperature, ºC |
RH |
annual average relative humidity, % |
Pd |
annual average SO2 deposition, mg m-2 d-1 |
Sd |
annual average Cl- deposition, mg m-2 d-1. |
2.3. Data processing
Annual averages of RH, T, and TOW were obtained for each location with the corresponding standard deviation. A relatively high correlation between these parameters and altitude (A), in m.a.s.l., was found. The determination correlation coefficient (R2) is a useful statistic for testing linearity. An acceptable value of R2 must be higher than 0.75 (Wilks, 2011).
General data analysis was performed with Python. The corrosion rate was determined and represented in two maps. One was generated with a simplified model, and the other with the new method formulated by the ISO 9223:2012 standard. Contour lines for the WCV were taken from the Atlas of Costa Rica with a spatial resolution of 10 m (Ortiz-Malavasi, 2015), and the maps were created with ArcGIS software.
The simplified and the ISO 9223:2012 models were compared between them and against experimental measurements. The latter were obtained according to the procedures in the ISO 9223:2012, ISO 9225:2012, and ASTM G1-03 (ISO, 2012a; ISO, 2012b; ASTM International, 2017) standards.
3. Results and discussion
3.1. Meteorological parameters
Most stations were located below 1500 m.a.s.l. and inside the valley. There were less data points in medium- altitude locations a (1500 m.a.s.l. to 2000 m.a.s.l.), and only three in the most elevated parts (above 2000 m.a.s.l.). The geographical distribution of the meteorological observations was not homogeneous. Data points were scarce in the northern section of the WCV, particularly around the foothills of the Barva volcano.
Figures 2, 3, and 4 represent the relations between temperature, relative humidity, and time of wetness with altitude and their standard deviation.


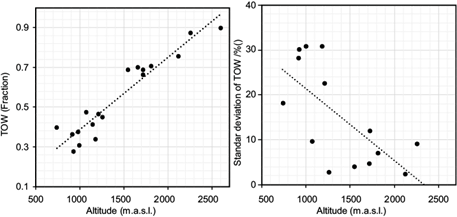
Fig. 4 Variation of (a) annual accumulated average and (b) standard deviation of time of wetness with altitude.
Based on the information presented in figure 2, the equation that describes the temperature variation between 700 m.a.s.l. and 2600 m.a.s.l. is:
The value of the vertical temperature gradient in the WCV from equation (4) is remarkably similar to the global mean value of -6.5 ºC km-1 in the lower atmosphere Sendiña-Nadal and Pérez-Muñuzuri, 2006). The standard deviation tends to increase with altitude at a rate of 2 % for every 1000 m. This behavior is possibly related to a more significant seasonal variability of temperatures in mountainous regions of the WCV (Solano and Villalobos, 2000). Usually, the standard deviation of temperature in the WCV is less than 0.5ºC.
In figure 3, it can be observed that relative humidity increases linearly with an altitude between 700 m.a.s.l. and 2600 m.a.s.l. This relation is expressed as:
At higher elevations, the air usually reaches the saturation point, and clouds may form. In the WCV, relative humidity was near the 100 % value at 2600 m.a.s.l. (Murphy and Hurtado, 2013). Above this altitude, equation (5) is not applicable.
The standard deviation of RH is usually less than 5 %, with a slight tendency to decrease with altitude. In the lowest areas of the valley, the seasonal variability of RH is usually determined by the differences between dry and rainy seasons (Abdalah-Hernández et al., 2019).
Campos and Castro (1992)) explained that RH could quickly vary from 20 % to 100 % at higher elevations of the eastern part of the WCV. This variation is due to dry upper troposphere air and the transport of humid air masses through the mountain pass from the Caribbean region. According to these authors, RH fluctuations decrease at lower elevations.
The relation between time of wetness and altitude from 700 m.a.s.l. to 2600 m.a.s.l., as shown in figure 4, is as follows
The TOW increases while the deviation standard decreases with altitude (Rodríguez-Yáñez et al., 2015). This proportionality is due to more saturated air at higher elevations, where RH increases and gets close to 100 %.
The variance of the TOW in the lower valley is associated with changes between the dry and rainy seasons. There is also greater homogeneity in the TOW at higher elevations since the RH values tend to be above 80 % for extended periods.
3.2. Estimation of Vcorr using the linear and ISO models
Using the linear relationships from the previous section (equations 4 to 6) is possible to calculate the variation of Vcorr with altitude by only considering meteorological variables (equations 1 and 2). The derived equations for corrosion rate, based on RH and TOW, are:
In both cases, the estimated R2 values are greater than 0.75 and therefore acceptable.
A similar process is applied to the ISO 9223:2012 equation (equation 3). The factors Pd and Sd are estimated by Herrera et al. (2012) approximation. In this case:
The simplified equation of ISO 9223:2012 is governed by the effect of RH and increases exponentially with the altitude.
3.3. Model output comparison
Field corrosion data was collected from September 2018 to September 2019. Table III shows the location and altitude of the measurement sites, as well as the annual average of the atmospheric variables and pollutants at each point. Atmospheric corrosion, from observations and models (equations 1 to 3 and 7 to 9), is shown in Table IV.
Table III Annual mean atmospheric parameters and levels of pollutants in three different sites.
| Site | North latitude | West longitude | A (m.a.s.l.) | RH (%) | TOW (fraction) | T (ºC) | Cl- (mg m-2 d-1) | SO2 (mg m-2 d-1) |
| CIGEFI | 09º 56’ 11” | 84º 02’ 43” | 1210 | 79.92 | 0.5701 | 20.29 | 3.82 | 6.06 |
| San Luis | 10º 00’ 54” | 84º 01’ 36” | 1341 | 90.19 | 0.8126 | 18.36 | 3.52 | 8.58 |
| Santa Ana | 09º 52’ 54” | 84º 11’ 14” | 1772 | 83.46 | 0.6643 | 17.41 | 4.00 | 7.02 |
Table IV Atmospheric corrosion in three different sites, using equations 1 to 3, 7 to 9, and actual values, in µm y-1. Values in italics correspond to overestimations of the corrosion rate compared to actual measurements (bold black quantities). Other modeled corrosion rates showing small differences (less than 5 %) with respect to observations are underlined.
| Site | Vcorr | Vcorr | Vcorr | Vcorr | Vcorr | Vcorr | Vcorr |
| model RH | model TOW | ISO 9223 | Observed | model RH | model TOW | ISO 9223 | |
| (eq. 1) | (eq. 2) | (eq. 3) | (eq. 7) | (eq. 8) | (eq. 9) | ||
| CIGEFI | 19.2 | 20.8 | 20.8 | 17.4 | 16.7 | 18.6 | 23.8 |
| San Luis | 28.9 | 26.5 | 30.0 | 17.3 | 18.2 | 19.6 | 25.2 |
| Santa Ana | 22.5 | 22.9 | 24.9 | 16.6 | 23.4 | 23.2 | 31.0 |
Pollutant levels were similar to those utilized for the approximations with equations 7 to 9; however, RH and TOW did not follow the expected tendency with altitude. The reason for this behavior is probably the position of the stations in the WCV since they were located under the influence of different climatic conditions. Particularly, the station in San Luis is constantly influenced by humid air masses transported from the Caribbean region (Campos and Castro, 1992).
Figure 5 illustrates the predicted corrosion from equations 7 to 9 and their comparison with actual measurements.

Fig. 5 Vcorr vs. Altitude, for a model using a) equation 7 (RH, dotted line), b) equation 8 (TOW, dashed line), c) equation 9 (ISO 9223, solid line). Actual measurements are represented by cross markers (+).
The Vcorr values from the simple linear models based on RH and TOW (equations 7 and 8, respectively) increased rapidly with altitude and corresponded to C2 and C3 corrosivity categories, according to the ISO 9223:2012 standard (Table II). The corrosion in the ISO 9223:2012 model shows a more significant increase with altitude. This increase is due to the exponential behavior of equation 9, governed by the RH variable. The difference between observed values and the ISO 9223:2012 equation is around 20 % at medium altitudes. In the mountain (Santa Ana), this contrast reaches the order of 100 %.
Model outputs in comparison with observations presented notable differences. When the atmospheric parameters are used (equations 1 and 2), the deviations are greater in places with high values of RH (RH > 80 %) or TOW (TOW > 0.6), for example, in San Luis. When considering the simple models with altitude dependency (equations 7 and 8), there is generally a good estimation of Vcorr in the region between 1000 m.a.s.l. and 1400 m.a.s.l. Overestimation greater than 10% occurs at altitudes higher than 1500 m.a.s.l. It is important to consider that most of the population of the WCV lives within the 900 m.a.s.l to 1400 m.a.s.l altitude range (INEC, 2011).
The model-based of ISO 9223:2012 (equations 3 and 9) presented higher values with respect to observations. This problem was already pointed out in some studies carried out in the tropical atmosphere (Correa-Bedoya et al., 2007; Corvo et al., 2008, Morcillo et al., 2012; Morcillo et al., 2013, Garita-Arce et al., 2014; Rios et al., 2017; Vera et al., 2017).
In figure 6, the shown maps complement each other. It is possible to apply both the RH- and the TOW-based models (Fig. 6a or 6b, respectively) in the central region of the WCV (from 900 m.a.s.l to 1400 m.a.s.l.) and the ISO 9223:2012 model (Fig. 6c) overestimated the corrosion in all altitudes.

4. Conclusions
Simple models based on RH, TOW, and the ISO standard were used to determine Vcorr in the WCV. The measurements indicated intermediate (C2) levels of Vcorr in the region, with values ranging from 16.6 to 17.4 µm y-1. Almost all the proposed models presented a level of Vcorr within the C2 category.
The linear equations dependent on atmospheric parameters only (equations 1 and 2) always overestimated the value of Vcorr with differences between 10 % and 70 %. Conversely, the altitude-dependent models (equations 7 and 8), presented a more realistic estimation, between 1000 m.a.s.l and 1400 m.a.s.l.
The equation of the ISO 9223:2012 standard (equation 3) and its simplified form based on the altitude (equation 9) showed an exponential behavior governed by the increase of RH with altitude.
The results demonstrated that linear equations with regular parameters, such as RH, are more practical for determining Vcorr at low altitudes in the WCV, specifically in the range of 1000 m.a.s.l to 1400 m.a.s.l., where most of the population of the WCV lives. Vcorr calculations out of this range showed larger discrepancies with respect to observations (more than 10 %).
The ISO model overestimated the Vcorr values in the WCV for all altitudes. In some cases, the differences were greater than 20 %.
The WCV is not a climatically uniform region, as it shows significant spatial and temporal variations. This variability suggests the need for more assessments considering these factors, given the dependency of corrosion with RH. Future analyses should encompass mountain profiles, climatic sub-regions, and climatic periods (for example, dry and rainy seasons).

