


 nueva página del texto (beta)
 Inglés (pdf)
 Artículo en XML
 Referencias del artículo
 Enviar artículo por email
 Citado por SciELO
  Similares en
SciELO
Similares en
SciELO 
 Permalink
1. Introduction
Capitalism is the production system that has generated the highest material wealth. Before the Industrial Revolution, the rate of economic growth and the amount of produced goods and services were meager. In this way, fossil fuels have been essential to economic evolution during the last two centuries but they have also produced negative effects: they increased the concentration of greenhouse gases (GHG) as a result of their combustion to generate energy in the industrial processes. These gases, in excess, cause pollution, respiratory diseases, changes in the atmospheric chemistry and accelerate the global warming phenomenon (Alves, 2014).
GHG, whose emissions have grown about 60% from 1990 to 2017, are gaseous constituents that absorb and re-emit infrared radiation into the atmosphere. The main causes associated with this increase are related to the planet’s energy production infrastructure and emissions associated with deforestation of tropical forests (CEBDS, 2018). Due to the energy consumption generated from fossil fuels burning and emissions from transformation processes of their inputs to products, industrial activity also contributes significantly to the increase in GHG concentration (MDIC, 2013).
Within the industrial sector, the steel industry stands out for being a basic industry that plays an essential role in economic growth. It supplies inputs for several market segments. Likewise, the industrial sector is a major consumer of energy and materials. It is also responsible for a significant negative environmental impact due to the extensive physical and chemical reactions involved in the steelmaking process (Carvalho et al., 2016).
In 2019, Brazil ranked 9th in world’s steel production, with 32.5 × 10⁶ t of crude steel, which corresponds to 1.7% of thw global production. China is at the top of this ranking, with a production of 996.3 × 10⁶ tons, equivalent to more than 50% of the world production. India, Japan, the USA, Russia, South Korea, Germany and Turkey occupy positions 2 to 8, respectively (Instituto Aço Brasil, 2020).
According to the results of GHG estimates for the Brazilian industrial sector, the steel industry is below the world’s average with emissions per ton of steel decreasing from 1.547 t CO2eq per ton of crude steel in 2015 to 1.457 in 2050. These values are observed, mainly, by the introduction of charcoal in the production of steel in integrated plants and the better use of process gases, generating a lower demand for metallurgical coke (Santos et al., 2010).
Brazil emitted 2.2 billion tons of GHG in 2019 (total emissions). The Industrial Processes and Product Use sector was responsible for 5% of the total. The highlight is given to the Land Use Change and Agricultural sectors, which accounted for 72% of Brazilian emissions that year (SEEG, 2019).
Anthropogenic activities in general have already increased the Earth’s average temperature by about 1 ºC, with a probability to reach 1.5 º C between 2030 and 2052. If no global changes are assumed to limit this warming, global temperature may still reach 2 ºC above pre-industrial levels. Allowing this increase means assuming loss of natural habitats and species, reduction of polar ice caps and sea levels rise, with serious consequences for human health, security and economic growth (IPCC, 2018).
Fourteen countries in the G20 (Argentina, Brazil, Canada, France, Germany, India, USA States) were responsible for more than 80% of global carbon emissions between 1991 and 2017 (Erdoğan et al., 2020). If GHG emissions remain at current rates, countries will suffer serious consequences, mainly the poorest, as they are less prepared to deal with these fast changes. Habitats will change so sharply that many species will be unable to adapt, causing the extinction of animals and vegetables. In addition, diseases such as malaria and malnutrition will become more common, threatening the health of millions of people (Watts et al., 2015).
The international community has been struggling to combat global warming, as well as its consequences . Voluntary agreements between nations have been developed as an alternative to solve the problem (Mok et al., 2014). According to Cifci and Oliver (2018), international climate agreements such as the 1997 Kyoto Protocol and, more recently, the Paris Climate Agreement, mention that climate change is the most urgent challenge of our time and report that international cooperation to reduce GHG emissions plays a key role in this challenge.
The meetings of the Conference of the Parties (COP) held in Paris (2015) and Marrakesh (2016) for international climate negotiations, presented some promising results. However, it is noteworthy that efforts are few and the way to avoid dangerous climate change is still far off (Rockström et al., 2016; Hickmann, 2017).
The demand for adapting production to new practices that comply with environmental legislation, which imposes certain limits, and the current ecological thinking of society, lead industries to use clean technologies and, necessarily, to adopt pollution control systems and appropriate equipment (Novaes and Souza, 2018). Thus, industries need to absorb their negative externalities and use clean technology in order to retain the market.
Countries are looking for technologies and alternatives to reduce carbon emissions without negatively affecting economic development. Industrial progress is important, but it needs adjusting to the protection of environment in order to guarantee environmental quality. Through innovation, sustainable economic growth strategies have emerged (Erdoğan et al., 2020). Companies first need to appraise their emissions through quantitative data so they can evaluate the best mitigation strategies for their corporate GHG emissions and search for innovations.
In China, for example, the national progress of CO2 emissions decrease can be attributed to high efficiency projects established by energy service companies. Population, consumption of coal, and research and development inputs have a positive influence on the decrease of CO2 emissions (Zheng et al., 2018). In mining areas, the use of solar water heating systems is an alternative for reducing average annual CO2 emissions. The problem is the high cost of the new energy source, such as solar energy (Xue, 2020). Within European telecommunications companies, the largest contributor to GHG emissions was the consumption of purchased electricity (Radonjič and Tompa, 2018).
In fact, a growing number of private companies have begun to contribute to climate change mitigation voluntarily. However, only when this sector receives a clear political signal, the companies will make substantial efforts to calculate and report their emissions accurately. This attitude requires the use of stringent GHG control regulations and the adoption of appropriate policy instruments (Hickmann, 2017).
Thereby, this work aimed to carry out a complete inventory of GHG emissions from a steel factory, using the tool provide by the Brazilian GHG Protocol Program. The factory under study aimed to understand and quantify its GHG emissions in order to mitigate them later. This is a significant step, in which the organization is committed to the community, fulfilling its social responsibility. Then, an adaptation of the tool was made for a monthly report, allowing companies to carry out a more precise control and monitoring their emissions in a shorter time, something that has not been reported until now. The results can be used as reference and basis for other industries, enabling them to use the knowledge and results presented.
2. Material and methods
This work was carried out in a steel factory located in the state of Rio de Janeiro, Brazil. Only data related to the number of employees, consumption of raw materials and fuels applicable to the production process, electricity consumption, vehicle handling and final disposal of waste were authorized for disclosure in this work. All data used in this research refer to 2017 and were obtained through technical visits and information collected on site, informed by employees from the Health, Safety and Environment (HSE) sector.
This work consists of a qualitative and a quantitative research, followed by a descriptive and exploratory case study, based on the specifications of the Brazilian GHG Protocol Program. GHG emissions of the steel factory were quantified through the bottom-up approach (sectorial approach), which allows knowing the emissions through specific consumption and emission factors, as well as an analysis of these emissions.
The bottom-up approach uses information directly related to the source. It is used for point sources, requiring more resources to collect information from the specific location. The organization has operational control and measurement of this data (Ugaya et al., 2013). This approach allows to know the emissions through specific consumption and also specific emission factors, which are used for the elaboration of corporate inventories (sectorial approach).
A single element was examined in this research, a steel factory. According to Yin (2015), a single case study is recommended when the access to multiple cases is difficult. This methodology can be used to find out if the propositions are correct or if a group of explanations is more relevant. This research can be a significant contribution to knowledge building and even support direct future research in this field.
2.1 Quantification of GHG emissions with the GHG Protocol method
Among the different methodologies for quantifying, analyzing and managing corporate GHG emissions, the GHG Protocol Corporate Accounting and Reporting Standard is the most used tool worldwide by companies and governments (WBCSD, 2014).
The GHG Protocol is a management method, compatible with the International Organization for Standardization (ISO) and the Intergovernmental Panel on Climate Change (IPCC) quantification methodologies. Its application in Brazil is adapted to the national context. It was developed by the World Resources Institute in association with the World Business Council for Sustainable Development in 1998, and it is periodically updated (FGV/WRI, 2009). In addition to its wide use, this tool stands because it offers a structure to account GHG with a modular and flexible way. Its policy neutrality and the fact that it is based on a wide public consultation process were also decisive factors for choosing this methodology and using it in this work.
According to this method, companies need to assess their responsibility for GHG emissions from (a) their internal operations, (b) the purchase of energy from sources outside the corporation and internal use, and (c) emissions from products upstream and downstream of the value chain. These responsibilities are referred as Scope 1, Scope 2, and Scope 3, respectively (Patchell, 2018).
All the potential sources of GHG emissions into the atmosphere from the industrial establishment were identified. All activities and operational routines were verified. The studied plant is integrated with the transformation cycle starting at iron ore. The pig iron is manufactured in a blast furnace, with charcoal as its main reducing agent.
The identified emission sources were based on the amount of fuel used by the fleet, internal industrial processes, total consumed energy and generated effluents. These sources were classified as direct (Scope 1) or indirect (Scope 2), as established in the GHG Protocol methodology. Due to insufficient data to report Scope 3 emissions, only the mandatory reports (Scopes 1 and 2) were chosen.
Quantification of emissions was performed using the methodology of the Brazilian GHG Protocol Program v. 2018.1.4 (EAESP/FGV, 2021). The methodology of this research followed the guidelines and information contained in this method.
Three limits were defined: the temporal range (reference period), the organizational limits, and the operational limits. The reference period was the time frame for quantification of emissions (from January until December 2018) and served as the basis for the analysis of emissions data. The organizational limits physically delimit where the work will be performed. The Brazilian GHG Protocol Program considers two approaches to consolidate emissions: operational control (when the company has the authority to define and implement operating policies, including 100% of its emissions in the inventory) and equity participation (inclusion of emissions according to equity interests, reflecting its participation percentage in the operation). The operational limit refers to all activities within the organizational limits that emit GHG. Identification of emission sources is required, as well as distinguishing between direct and indirect emissions in order to associate them with the corresponding scopes.
The GHG Protocol includes calculations based on specific emission factors for the analyzed components. The approach used to calculate GHG emissions is the application of documented emission factors. The emission factor is a mathematical indicator of the amount of GHG emitted to the atmosphere in relation to a given emission source.
Each spreadsheet of the tool was programmed using the formula and the emission factor to quantify the emission, presenting, in the end, the scope emission and its condensation. The tool has a model of source transformation into CO2 equivalent (CO2eq), considering the global warming potential (GWP) of each GHG.
Emission factors determine how much of a GHG was emitted by the activity. It corresponds to a representative value reporting the amount of GHG emissions or removals to an associated activity. A practical example is how much CO2 is emitted when one liter of fuel is consumed (SEBRAE, 2015).
The agents that publish factors used as reference by the Brazilian GHG Protocol calculation tool are (a) the IPCC (scientific basis that presents standard values), (b) the National Energy Balance (BEN), (c) the Brazilian Ministry of Science, Technology, Innovations and Communications (MCTIC), (d) the Brazilian Ministry of Environment (MMA), and (e) the Department for Environment Food and Rural Affairs (DEFRA).
The Brazilian GHG Protocol tool uses the emission estimation method (estimation approach), which consists of emission data (such as data on electricity consumption and gasoline burning in vehicles) multiplied by appropriate emission factors (used to determine the quantity emitted by a given source, depending on some parameters). Thus, to calculate emissions or removals of different GHG, in general, the tool performs the calculation according to Eq. (1) below:
where E GHG GHG emissions or removals, C is the combination of activity information (activity data), and EF is the emission factor.
Subsequently, emissions or removals are converted to identify the amount of CO2eq in tons (tCO2eq). This calculation is made considering the global warming potential of each GHG (Eq. [2]):
where E are GHG emissions or removals in CO2eq, E GHG are emissions or removals from GHG, and GWP is the global warming potential of GHG.
GWP values used as a reference and emission factors used in the inventory were provided by the GHG Protocol estimation tool. The simplified method presented above represents the quantification of emissions by the Brazilian GHG Protocol tool for the following categories: stationary combustion, mobile combustion, fugitive emissions (Scope 1) and energy (Scope 2). The calculation of industrial processes and effluents categories (Scope 1) was performed with alternative data that will be discussed below.
2.2 Industrial processes category
The Industrial Processes category requires the value already calculated by Eq. (1). It is a more complex and particular category to be calculated (it will depend on the operation of each organization). There is a reporting space in the tool to enter these values.
According to Eq. (1), the data of each activity are multiplied by their respective emission factors to obtain the corresponding value for GHG emissions or removals. Thus, when the equivalent emission factors are not found in the literature, it is possible to calculate them by mass balance, since the amount of carbon present in a ton of precursor (supervised item) is known (IPCC, 2006).
This work adopted the methodology used by the Guidelines for national greenhouse gas inventories (IPCC, 2006). The calculation was made using the carbon content and the mass balance. The emission factor is the carbon content in tons multiplied by the CO2 molecular weight: 44 t of CO2 correspond to 12 t of C (3.6667 t of C).
The equivalent emission is obtained with Eq. (3):
where EF is the emission factor, CC is the carbon content in tons, and 44/12 is the molecular mass to carbon atomic mass ratio.
The values equivalent to carbon content of each item were obtained through laboratory analyzes of the carbon amount of each element, performed by the company itself. The values obtained after these calculations (emissions in tons of CO2) were introduced in the Brazilian GHG Protocol tool to follow the calculation of CO2eq emissions.
2.3 Effluent category
For the calculation of this category, the type of treatment performed and the amount of waste or effluent produced based on the number of active persons in the plant were recorded. There are two different ways to account these emissions: (a) as Scope 1 direct emissions if the company performs any treatment of effluents or solid waste generated within the established organizational limit; (b) as Scope 3 indirect emissions when the company collects all wastes and effluents and gives them a different destination, where another company is responsible for their treatment (SEBRAE, 2015).
The studied company has a sewage treatment station equipped with an anaerobic filter, which receives effluents only from the bathrooms located in the upper part of the plant (treatment of sanitary effluents). This area is located in the sector of the company that covers foundry/valves and the parts yard, which is composed of 69 employees.
The GHG Protocol tool follows five steps for this quantification:
Step 1. Sequential treatments applied to effluents. It is necessary to identify if two types of anaerobic treatment are applied sequentially to the generated effluent; in the case of the company under study they were not applied.
Step 2. Estimation of wastewater generation data (amount of wastewater generated in the inventory year in m³ yr-1). This calculation is performed by multiplying the per capita contribution of sewage (data available in the guideline DZ-215 [Table I]) by the number of employees (INEA, 2007). Thus, the calculation was:
70 × 69 = 4830 L day-1 4830/1000 = 4.830 m³ day-1 4.830 × 365 = 1,762.95 m³ yr-1
Table I Per capita contribution of sewage and unit of organic load contribution, in industrial, commercial and construction site activities.
| Pattern | Sewage per capita contribution (L day-1) | Unit of organic load contribution (g BOD day-1) |
| General non-residential activity | 70 | 25 |
| Non-residential activity with dining hall with kitchen | 95 | 50 |
Source: INEA (2007).
Step 3. Effluent organic composition data: the effluent degradable organic load data must be filled, choosing whether the data unit corresponds to biological oxygen demand (BOD) or chemical oxygen demand (COD). The following calculation was made based on the DZ-215 guideline (Table I):
25 × 69 = 1725 g BOD day-1 1725/1000 = 1.725 kg BOD day-1 1.725 × 365 = 629.625 kg BOD yr-1
The value inserted in the Brazilian GHG Protocol tool was the degradable organic component of the effluent, which was obtained by dividing the value found in the amount of liquid effluent generated by the value of the unit of organic load contribution:
629.625/1,762.95 = 0.357 kg BOD m-3
Then, data regarding the amount of nitrogen present in the effluent and the N2O emission factor of the effluent needed to be filled. If there is no specific N2O emission factor, this data may not be filled and remain as a blank field. In this case, the tool will use the default suggested by the IPCC (2006). Nitrogen data entered in the quantification tool were obtained through monthly reports issued by the National Service for Industrial Learning (SENAI). This institution estimated the average value to calculate GHG emissions, which was 45 kg N m-3.
Step 4. Type of treatment applied to the effluent. In this case, the anaerobic reactor option was selected.
Step 5. CH4 recovery. If applicable, this line shows the amount of methane recovered from the effluent treatment in the inventoried year. No value was inserted.
3. Results and discussion
3.1 Quantification of GHG emissions through the Brazilian GHG Protocol tool
A survey regarding GHG emission sources of the studied company was carried out, corresponding to their operational limits. The data from 2017 (time limit of this work) consisted of the company’s operational control approach. Seventeen sources were identified within the following categories: stationary combustion, mobile combustion, fugitive emissions, industrial processes, and effluents and energy.
The stationary combustion category is related to the burning of fuels by fixed equipment, which can be owned by the company or rented to operate under its management. Mobile combustion is related to the burning of fuels by mobile equipment. Emissions resulting from the intentional or accidental release of GHG (generated by air conditioning gas leaks or fire extinguishers, for example) are accounted in fugitive emissions. The industrial processes category includes all sources of industrial processes emissions that transform materials, either chemically or physically, and there may also be GHG sources through the use of products. The effluents category includes the waste produced during industrial processes that is no longer used by the company (SEBRAE, 2015). All of these reported categories refer to Scope 1.
Scope 2 refers to the accounting of GHG emissions from the generation of purchased electricity, heat or steam. These emissions are generated where the energy is produced and subsequently consumed by the inventoried company. It is noteworthy that if the company carrying out the inventory produces any of these types of energy, the emissions generated by this process cannot be reported in Scope 2. In this case, they must be reported in Scope 1, since they will become direct emissions produced by the inventoried company itself (SEBRAE, 2015).
The required data to quantify the emissions were based on documented real data. Requisitions were made to the company’s Warehouse and Controlling sectors, weighing reports and vouchers were redirected to the Health, Safety and Environment sector. Then, all information was provided to the authors for further analysis.
For all items, the required information for data entry was collected, as required by the Brazilian GHG Protocol spreadsheet. The quantification was made from the determination of the sources of GHG emission.
GHG emissions (t GHG) inventoried by the GHG Protocol tool, as prescribed by the Kyoto Protocol, are shown in Table II. According to this table, CO2 is the most representative GHG of the steel factory emissions. The amount of 36 483.01 t CO2eq corresponds to 99.27% of Scope 1 GHG emissions (36 750.47 CO2eq) of the analyzed factory. This is mainly due to the transformation of pig iron into steel in converters and electric furnaces of the steel factory. This process always releases CO and CO2 (Carvalho et al., 2016).
Table II Total greenhouse gas emissions in tons.
| GHG | Scope 1 (t GHG) | Scope 1 (t CO2eq) | Scope 2 (t GHG) | Scope 2 (t CO2eq) |
| CO2 | 36 483.01 | 36 483.01 | 5460.95 | 5460.95 |
| CH4 | 261.568 | 6539.20 | - | - |
| N2O | 5.893 | 1756.11 | - | - |
| HFCs | - | - | - | - |
| PFCs | - | - | - | - |
| SF6 | - | - | - | - |
| NF3 | - | - | - | - |
| Total | 36 750.47 | 44 778.33 | 5460.95 | 5460.95 |
Source: Prepared by the authors based on the calculation performed by the GHG Protocol tool, v. 2018.1.4.
GWP is the GHG contribution to global warming. The GWP of methane and nitrous oxide used by the GHG Protocol tool were 25 and 298, respectively (IPCC, 2007). So, the representative values of these GHG increased and the Scope 1 total emissions reached 44 778.33 t CO2eq. Scope 2 emissions (considering GWP of CO2 equal to 1) remained at 5 460.95 t CO2eq. Figure 1 illustrates the total CO2eq emissions.
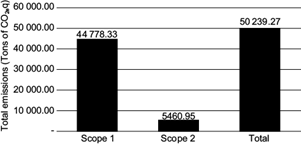
Fig. 1 Total emissions (Scope 1 and Scope 2) in tons of carbon dioxide equivalent (t CO2eq). (Source: Prepared by authors [2019]).
The total GHG emissions reached 50 239.27 t CO2eq (Fig. 1). Scope 1 emissions (44 778.33 t CO2eq) were responsible for 89.13% of the total CO2eq emitted by all sources. The configuration of the Brazilian energy matrix contributed to the reduced Scope 2 emissions (5 460.95 t CO2eq or 10.87% of the total CO2eq emitted). According to data from the Energetic Research Company (EPE, 2016), 43.5% of the Brazilian energy consumption comes from renewable sources while in the rest of the world this percentage is 14%. Renewable energy represents 82% of the sources of electric power generation in Brazil. This scenario is very positive for Brazil, because plants generating energy from renewable sources generally emit less GHG and have lower operating costs.
Technological innovation in the industrial sector has a major impact on energy consumption and varies according to the level of technological development of the machinery and equipment used in the production process. The most sophisticated technologies in the industrial sector have high costs. As many countries do not have the opportunity to develop new technologies, they import these products. Scope 2 CO2 emissions are reduced as new energy-saving technologies are used, rather than machines and equipment with lower energy consumption (Erdoğan et al. 2020).
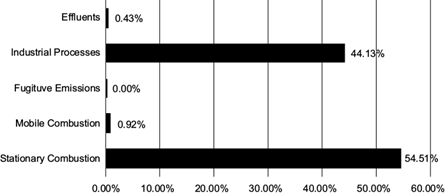
Table III shows the detailed Scope 1 direct emissions: inputs used for combustion (stationary or mobile) in machinery and processes; fugitive emissions from reloading fire extinguishers; physical and chemical reactions of industrial processes, and treatment of sanitary effluents. It also exhibits the large representation of the stationary combustion category (24 407.88 t, 54.51% of the total GHG emissions of the analyzed factory), followed by the industrial processes category (19 762.50 t, 44.13% of the total GHG emissions of the analyzed factory). Figure 2 shows the percentage of participation of each category.
Table III Summary of each organization’s GHG emissions by scope and category.
| GHG | Stationary combustion (t) | Mobile combustion (t) | Fugitive emissions (t) | Industrial Processes (t) | Waste (solid waste + effluent) (t) | Total emissions Scope 1 (t) |
| CO2 | 16 312.97 | 406.17 | 1.38 | 19 762.50 | - | 36 483.01 |
| CH4 | 261.24 | 0.03 | - | - | 0.30 | 261.57 |
| N2O | 5.25 | 0.02 | - | - | 0.62 | 5.89 |
| HFC | - | - | - | - | - | - |
| PFC | - | - | - | - | - | - |
| SF6 | - | - | - | - | - | - |
| NF3 | - | - | - | - | - | - |
| CO2eq | 24 407.88 | 413.37 | 1.381 | 19 762.50 | 193.20 | 44 778.33 |
Source: Prepared by the authors based on the calculation performed by the GHG Protocol tool, v. 2018.1.4.
The stationary combustion category involves the burning of fuels through stationary equipment such as blast furnace, greenhouses and centrifugal machines (Table IV). A representative reduction in GHG emissions from a steel factory necessarily involves blast furnace as an important source of gas greenhouse gases. In a low carbon scenario, oxygen blast furnace with top gas recycling blast furnace (turbine for recovering top gases) is a technological possibility for reducing emissions. In a simplified way, the impact achieved with the mentioned technology is the capture of CO2 through chemical absorption and reuse of gases (CO) in the blast furnace (CETESB, 2018).
Table IV Specification of GHG emissions from the stationary combustion category.
| Source | Fuel | Consumed amount | CO2eq emissions (t) |
| Blast furnace | Charcoal | 48 240.38 t | 8 078.99 |
| Ore heater, greenhouses, ovens, centrifugal machines, mixer and canteen | Injected dry natural gas | 7 890 316.00 m³ | 16 324.72 |
| Greenhouses and ovens | Liquefied petroleum gas (LPG) | 0.36 t | 1.06 |
| Laboratory and maintenance (welding and cutting) | Acetylene gas | 0.919 t | 3.11 |
| Total | 24 407.88 |
Source: Prepared by the authors based on the calculation performed by the GHG Protocol tool, v. 2018.1.4.
According to Table IV, the most used fuel was natural gas, which contributes to 66.88% of the GHG emissions (16 324.72 t) within the stationary combustion category. Charcoal is the second, with 33.10% of the GHG emissions (8 078.99 t).
Biogenic CO2 emissions must be reported but not accounted, since they are considered neutral (CO2 emission equals CO2 removal). These emissions corresponded to 139 248.92 t (Fig. 3).

Analyzing data in Figure 3, the stationary combustion category has the largest contribution of this type of emission, since 139 216.23 t of biogenic CO2 (99.98%) are equivalent to the charcoal consumed in the blast furnace of the steel factory (neutral emission). Mobile combustion emitted 32.69 t of biogenic CO2 (0.023%), due to the fraction of biodiesel and ethanol present in diesel and domestic gasoline.
Scope 1 had the highest emissions from the industry, representing more than 89% of the CO2eq total emissions. The stationary combustion category was highly representative, mainly due to the use of natural gas and, secondly, charcoal. Emissions accounted as CO2eq corresponded only to emissions of CH4 and N2O, since CO2 emissions (larger representation of emissions: 139 216.23 t) are not accounted because they are considered neutral.
Biogenic CO2 emissions represented 7.91% (32.69 t CO2) of the mobile combustion category (413.37 t CO2eq). This amount is equivalent to the mandatory addition of ethanol in gasoline or biodiesel in diesel, regulated by specific resolutions in Brazil.
The configuration of the Brazilian energy matrix contributes to the reduced Scope 2 emissions, representing 10.87% (5 460.95 t CO2eq) of the total inventoried GHG emissions (50 239.27 t CO2eq).
The replacement of coal by charcoal is an important example of a GHG mitigation step in production processes. The use of renewable charcoal is an alternative way to mitigate GHG emissions, acting directly to improve resource efficiency during the carbonization process for pig iron production, ferroalloys and steel. Renewable biomass resources can be obtained from sustainably planted forests. Charcoal pig iron can be considered a green pig iron (Ministério do Meio Ambiente, 2016).
For the metal production, the studied company melts the iron in blast furnaces using charcoal produced in its own unit. The use of biomass (such as charcoal instead of coal) is a very positive point that can be highlighted. If the company did not use renewable biomass, there would be no neutral emissions and its GHG emissions would be higher, since coal is a fossil and non-renewable source of GHG emissions.
When charcoal is used in the blast furnace, 139 216.23 t of biogenic CO2 (considered neutral, CO2 emission being equal to CO2 removal) are emitted during the stationary combustion category. Total CO2eq emissions from other fuels used in this category were 24 407.88 t CO2eq. However, if the company had used national metallurgical coal, instead of charcoal, emissions related to the stationary combustion category would have risen to 139 897.206 t CO2eq.
A survey was carried out using the public emissions registry on the website of the Brazilian GHG Protocol Program in order to compare GHG emissions from the steel factory under study with other inventoried steelworks during the same period (2017). The public emissions registry is a platform for the disclosure of corporate inventories of GHG emissions from organizations participating in the Brazilian GHG Protocol Program.
Table V shows a comparison between the values of GHG emissions released by three steel companies with the emissions of the steel factory under study.
Table V Corporate greenhouse gases emissions (in t CO2eq) reported by steel companies in the Public Emissions Registry.
| GHG emissions by category | Company studied in this work (2017) | Ternium Brasil (2017) | CSN (2017) | ArcelorMittal (2017) |
| Scope 1 | ||||
| Stationary combustion | 24 407.88 | 164 273.54 | 7 580 902.40 | 0.00 |
| Mobile combustion | 413.37 | 9675.90 | 207 915.10 | 15 552.97 |
| Fugitives | 1.38 | 87.55 | 109 043.08 | 0.00 |
| Industrial processes | 19 762.50 | 10 238 562.49 | 6 677 438.66 | 18 423 997.32 |
| Effluents | 193.20 | 0.00 | 1864.41 | 0.00 |
| Total | 44 778.33 | 10 412 599.48 | 14 577 163.65 | 18 439 550.29 |
| Scope 2 | ||||
| Energy | 5460.95 | 6049.07 | 245 959.84 | 83 394.10 |
Source: Prepared by authors (2019).
A direct comparison between steel industries is not possible, since they have different sizes and manufacturing capacities. The largest emissions are related to Scope 1, from the stationary combustion and industrial processes categories. This does not mean that emissions related to energy consumption should be disregarded (Scope 2 emissions). According to Siitonen et al. (2010), the steel industry is one of the industrial sectors with the highest energy consumption. A global reduction of CO2 emissions requires more energy efficiency of industrial plants, therefore seeking to efficiently apply the use of equipment is an important criterion in the CO2 emissions benchmarking. Other forms of energy efficiency can be considered, such as reducing losses and maximizing the reuse of gases to reduce the demand of fuels.
The cogeneration process aims to stimulate the structuring of the electric energy production with the reuse of heat in synergy with steelmakers, blast furnaces and coke ovens (Santos et al., 2010). Energy consumption during this process, the composition of the fuel and the technologies used, and the efficiency of resources can influence the CO2 emission in the steel industry (Zhang et al., 2009; Huang et al., 2010; Xu et al., 2016).
Through a brief analysis of the fuel used by the company for its fleets (cars, ambulances, forklifts and locomotive) within the mobile combustion category, it was observed that if the company chooses to use biofuels (replacement of commercial diesel oil by biodiesel and gasoline for ethanol) its emissions would be biogenic, i.e., emissions related to the natural carbon cycle (neutral emissions).
The assessment and control of GHG emissions is a way to revert the scenario of large emissions that has been causing a rise in the planet’s average surface temperature. Similar works based their research on the quantification of GHG emissions. Hwang et al. (2017) estimated GHG emissions and emission factors in nine incineration plants in Korea, measuring GHG concentrations in flue gas samples. Kyung et al. (2017) estimated the total GHG emissions generated from all stages of the life cycle of a sewer pipe system. Other works with similar proposals are the following: Carvalho et al. (2017) performed the quantification and analysis of GHG emissions from the Pontifical Catholic University of Rio de Janeiro to contribute with the university’s environmental agenda. Almeida et al. (2020) measured the related to GHG emissions of an electricity generation industry and proposed strategies to reduce environmental impacts from the use of natural gas. Both used the GHG Protocol tool.
3.2. Adaptation of the Brazilian GHG Protocol Program Tool for its use in monthly reports
Emission data obtained in a shorter period of time would provide a more efficient control of GHG emissions. This could be accomplished through the development of a monthly indicator. Thus, the GHG Protocol v. 2018.1.4 was adapted for monthly reporting. The methodologies and emission factors proposed by the original tool were not modified. The spreadsheet columns were maintained in order to measure emissions month by month, reorganizing and structuring the tool.
The GHG Protocol tool is flexible, making possible its use for several segments that need to quantify their emissions. Therefore, in this work only the tables applicable to the factory under study have been adapted, while those that were not applicable were disregarded because they were not necessary for the quantification of GHG emissions from the studied steel factory.
The original tool uses, in some calculations, the ARRED function in Excel (which rounds a number to a specified number of digits). The adapted tool did not round the number and used all decimal places so that the value was as real as possible. So, there was a small difference between the values calculated by the original tool and the adapted one. Rounding is a recognized technique and is widely used in mathematics (especially when there is no device for performing numerical calculations), since it makes easier to work with numbers that have a large number of digits. This feature was dismissed because Excel is a spreadsheet editor that auto performs the proposed count.
Tables VI, VII, VIII and IX show the values found using the adapted tool for monthly reports and the original tool from the GHG Protocol Program, by category. The company measured nitrogen data by laboratory analysis. The input values for the amount of nitrogen from the generated effluent corresponded to the average provided by the company (45 kgN m-3). This value was repeated for 12 months. Thus, the values of total emissions in CO2eq were the same for all months.
Table VI Emissions of greenhouse gases found in the tools used from the stationary combustion category.
| Stationary combustion (monthly report) | ||
| Month | Total CO2eq emissions (t) | Total biogenic CO2 emissions (t) |
| January | 831.797 | 4985.281 |
| February | 2102.317 | 13 361.276 |
| March | 2173.851 | 12 862.826 |
| April | 2194.952 | 12 337.364 |
| May | 2206.462 | 11 665.905 |
| June | 2403.182 | 14 418.492 |
| July | 2229.584 | 12 218.985 |
| August | 1964.285 | 10 949.109 |
| September | 2010.018 | 11 993.915 |
| October | 2056.937 | 11 899.373 |
| November | 2174.286 | 12 208.365 |
| December | 2060.209 | 10 315.339 |
| Total | 24 407.880 | 139 216.231 |
| Original GHG otocol data |
Total CO2eq emissions (t) 24 407.875 |
Total biogenic CO2 emissions (t) 139 216.231 |
Source: Prepared by authors (2019).
Table VII Emissions of greenhouse gases found in the tools used from the category mobile combustion.
| Mobile combustion (monthly report) | ||
| Month | Total CO2eq emissions (t) | Total biogenic CO2 emissions (t) |
| January | 17.598 | 1.240 |
| February | 37.246 | 2.594 |
| March | 45.558 | 3.650 |
| April | 36.816 | 2.967 |
| May | 34.535 | 2.786 |
| June | 32.721 | 2.635 |
| July | 39.301 | 3.164 |
| August | 29.407 | 2.374 |
| September | 33.368 | 2.691 |
| October | 22.136 | 1.790 |
| November | 48.245 | 3.879 |
| December | 36.377 | 2.922 |
| Total | 413.307 | 32.693 |
| Original GHG Protocol data |
Total CO2eq emissions (t) 413.371 |
Total biogenic CO2 emissions (t) 32.693 |
Source: Prepared by authors (2019).
Table VIII Emissions of greenhouse gases found in the tools used from the fugitive emissions and industrial processes categories.
| Fugitive emissions (monthly reporting) | Industrial processes (monthly reporting) | ||
| Month | Total CO2eq emissions (t) | Month | Total CO2eq emissions (t) |
| January | 0.000 | January | 548.866 |
| February | 0.048 | February | 1759.425 |
| March | 0.268 | March | 2070.978 |
| April | 0.112 | April | 1749.116 |
| May | 0.000 | May | 1641.895 |
| June | 0.000 | June | 1638.765 |
| July | 0.000 | July | 1714.951 |
| August | 0.000 | August | 1528.520 |
| September | 0.370 | September | 1771.463 |
| October | 0.503 | October | 1909.887 |
| November | 0.080 | November | 1936.694 |
| December | 0.000 | December | 1491.944 |
| Total | 1.381 | Total | 19 762.503 |
| Original GHG Protocol data |
Total CO2eq emissions (t) 1.381 |
Original GHG Protocol data |
Total CO2eq emissions (t) 19 762.515 |
Source: Prepared by authors (2019).
Table IX Emissions of greenhouse gases found in the tools used from the effluents and energy categories.
| Effluents (monthly report) | Energy (monthly report) | ||
| Month | Total CO2eq emissions (t) | Month | Total CO2eq emissions (t) |
| January | 16.109 | January | 133.722 |
| February | 16.109 | February | 258.351 |
| March | 16.109 | March | 448.166 |
| April | 16.109 | April | 452.851 |
| May | 16.109 | May | 441.832 |
| June | 16.109 | June | 347.275 |
| July | 16.109 | July | 394.314 |
| August | 16.109 | August | 576.123 |
| September | 16.109 | September | 633.310 |
| October | 16.109 | October | 707.425 |
| November | 16.109 | November | 649.225 |
| December | 16.109 | December | 418.354 |
| Total | 193.304 | Total | 5460.947 |
| Original GHG Protocol data |
Total CO2eq emissions (t) 193.204 |
Original GHG Protocol data |
Total CO2eq emissions (t) 5460.947 |
Source: Prepared by authors (2019).
The adaptation of the tool was simpler in the case of scope 2 (energy category). The tool itself contained the total CO2 emissions calculated monthly because of the necessary parameters to calculate this category (emission factors). The National Interconnected System (SIN) makes the parameters available monthly.
4. Conclusions
This work aimed to estimaye GHG emissions from a steel company, using the methodology developed by the Brazilian GHG Protocol Program. Then, an adaptation of the tool was carried out to enable a monthly monitoring of GHG emissions.
Scope 1 emissions, which are GHG emissions from the company’s internal operations, were the highest: 44 778.33 t CO2eq (89.13% of the total CO2eq). The other 10.87% of the total CO2eq emitted refers to Scope 2 (energy category). This lower participation of the energy category was possible because a large part of Brazil’s energy is produced from renewable sources, which generally have lower GHG emissions.
Among the calculated categories, stationary combustion accounted for 54.51% of CO2eq emissions. Biogenic CO2 emissions corresponded to 139 248.92 t. This value is very representative: if the company did not use biomass, CO2eq emissions would not be considered neutral; consequently, they would increase significantly.
There is no predefined ideal quantitative GHG value for each organization. Thus, institutions always need to search for continuous improvement in their production processes.
The company’s interest in global warming issues is tangible, since, as observed, it already has targets to reduce its energy consumption. Practical actions such as the use of charcoal were reported and the monitoring of its emissions was possible through the monthly indicator developed in this work.
The results obtained with the adaptation of the Brazilian GHG Protocol Program tool are a differential of this work about carbon emissions. A recommendation to the industry is to expand its transparency policy, giving all shareholders and employees an important role in the process of climate change mitigation.
Summarizing, the continuous improvement of energy efficiency is an option for mitigating GHG emissions. If the studied company had used national metallurgical coal, instead of charcoal, emissions related to the stationary combustion category would have risen from 24 407.875 to 139 897.206 t CO2eq. Thus, actions to improve operational control and replace old equipment with more efficient ones are required. The strategy to be adopted will depend on the cost/benefit ratio of each action and its significance.

