


 nueva página del texto (beta)
 Inglés (pdf)
 Artículo en XML
 Referencias del artículo
 Enviar artículo por email
 Citado por SciELO
  Similares en
SciELO
Similares en
SciELO 
 Permalink
1. Introduction
Meteorological systems are known to have distinct temporal and spatial scales, which also interact with each other. Such scale variability and interactions can give rise to different weather events or affect their characteristics. A type of such events is heavy precipitation, which can have major socioeconomic impacts on agriculture, energy, or health, among others, and lead to material loss and high death tolls.
In South America, and particularly in Brazil, a series of systems provide a favorable environment for small-scale convective instability that gives rise to clouds with great vertical development and consequent intense storms. Weather systems causing rainfall to occur at different temporal scales, including the synoptic (two-eight days), sub-monthly (10-30 days), and intra-seasonal (30-60 days) scales.
Major synoptic-scale phenomena include frontal systems (Vasconcelos and Cavalcanti, 2010) and persistent systems such as the South Atlantic Convergence Zone (SACZ) (Carvalho et al., 2002, 2004). This system consists of a northwest-southeast oriented cloud band that extends from the Amazon, through the southeast of Brazil, to the subtropical South Atlantic Ocean (Carvalho et al., 2004; Quadro, 1994). According to Sanches (2002), the persistence of this cloud band for several days assigns the SACZ a prominent role in the region’s rainfall regime, and is responsible for large amounts of rain.
On the intra-seasonal scale, the main mode of variability is the Madden-Julian Oscillation (MJO), which is characterized by a zonal circulation cell that propagates eastward (Madden and Julian, 1971, 1972). The MJO controls the position and intensity of convection, which locates mainly along the SACZ during the austral summer. In this sense, one of the most striking features of intra-seasonal oscillation in South America is a seesaw pattern between enhanced convection along the SACZ and suppressed convection in the subtropics (Casarin and Kousky, 1986; Cunningham and Cavalcanti, 2006; Shimizu and Ambrizzi, 2017). In addition to the MJO, there is the South Pacific Mode (SPM), an extra-tropical mode of atmospheric circulation over South America. It consists of a mid-latitude wave train that originates in the South Pacific convection area and flows eastward to the continent.
The less understood and studied is the sub-monthly scale, probably because no clearly defined phenomena are associated to it. However, the scale becomes “visible” under certain interactions with phenomena on the intra-seasonal or synoptic scales. According to González and Vera (2013), among other authors, both the sub-monthly and the intra-seasonal scales present similar dipole patterns, although dynamic forcings are different.
Only few studies focus on the meteorological features of scale interaction, e.g., González and Vera (2013); Vera et al. (2018). In this sense, the present paper seeks to contribute to understanding the interaction among the synoptic, sub-monthly, and intra-seasonal scales, by analyzing two selected heavy rainfall events that occurred in southeastern Brazil. Both events had strong sub-monthly components.
The first one of these events took place in Rio de Janeiro, on January 11 and 12, 2011. It caused one of the major disasters in Brazil, which became known as the mega-disaster of the mountain region of Rio de Janeiro. The heavy rainfall (250.8 mm in 48 h) caused thousands of landslides (Netto et al., 2013), flash floods (Cavalcante et. al, 2020), overflow, and floods. More than 1500 people were killed, and infrastructure damage was impressive. Because of its magnitude and consequences, the mega-disaster was (and continues to be) the subject of extended research aimed at contributing to develop early alert systems (Calvello et al., 2015; Ottero et al., 2018).
The second event was selected from a set of SACZ-related severe weather events that took place from January 2007 to December 2014. The 12 events were subjected to wavelet filtering (not shown) to identify those with greater sub-monthly scale influence. The event was selected because the sub-monthly scale was more important than the two other scales. It occurred in the municipality of São Sebastião, in the state of Sao Paulo (SP), Brazil on December 22-25, 2014. An amount of 156 mm fell in 24 h and 208.5 mm in 48 h, causing flash floods and landslides. Nearby cities in SP were also affected, e.g., Ilhabela, Guarujá, and Santos (230, 301, and 272 mm in 48 h, respectively) (Escobar, 2014). According to the National Weather Service of Brazil (INMET), the long-term monthly mean precipitation of December and January in southeastern Brazil varies between 220 and 250 mm, so totals fallen during the selected events represent outstanding values in very short periods.
The main objective of this study is to understand how modes of intra-seasonal, sub-monthly, and synoptic climate variability modulate the main atmospheric systems involved in two heavy rainfall events occurred during the summer (DJF) in the south of Brazil, and explore the physical processes involved. In addition, we seek to improve our understanding of the influence of the sub-monthly scale on precipitation in South America. The structure of this document is as follows: section 2 describes the data and methodology applied; section 3 presents the results of the climatological analysis of OLR and the analysis of interactions among synoptic, sub-monthly, and intra-seasonal variability in the two particular cases. Conclusions are given in section 4.
2. Data and methods
2.1 Data
The influence of the synoptic, sub-monthly, and intra-seasonal scales was examined over the domain bounded by longitudes 110º E-0º and latitudes 10º N-60º S (Figs. 1-4). In this region major rainfall events are driven by meteorological systems such as the SACZ, moisture channels and fronts, among others (Carvalho et al., 2004; Cunningham and Cavalcanti, 2006; Álvarez et al., 2016; Shimizu and Ambrizzi, 2017). The domain was selected for the series of daily records of outgoing longwave radiation (OLR) covering the period from December 1, 1979 to February 28, 2016 (austral summer, DJF), provided by the National Oceanic and Atmospheric Administration (NOAA) with 2.5º × 2.5º resolution (Liebmann and Smith, 1996). ORL is the amount of infrared radiation emitted to space by cloud tops, which depends on cloud temperature and altitude, i.e., OLR is a proxy for enhanced or suppressed convection. Areas of active convection were identified on the basis of the significance of spatial fields of total and filtered OLR power spectra (variance). Scales filtered the synoptic, sub-monthly, and intra-seasonal scales. The filter used here was the wavelets transform (Liebmann and Smith, 1996).
The influence of spectral OLR scale interaction was also analyzed, associated to the occurrence of two intense rainfall events over the southeast of Brazil in the austral summers: January 2011 and December 2014.
Daily meridional and zonal wind data at 200 and 850 hPa made available by the Climate Forecast System Reanalysis (CFSR) (Saha et al., 2010, 2014) with 2.5º × 2.5º resolution were also used in this study.
2.2 Methods
Outgoing longwave radiation power spectra were examined using the wavelet technique (Torrence and Compo, 1998), a common tool for power spectrum analysis of time series. Wavelets make it possible to decompose a series of data into simpler wave-like functions, to identify dominant modes of variability and understand how these modes behave over time. The method has been applied in geophysical studies, such as tropical convection (Weng and Lau, 1994), ENSO (Gu and Philander, 1995), and intra-seasonal oscillations in South America (Vitorino, 2002), among others (Pezzi and Kayano, 2009). A complete list of applications of this technique can be found in Foufoula-Georgio and Kumar (1995). The theory of wavelet analysis is described in Daubechies (1992).
Wavelets are localized wave-like oscillations, in the sense that they grow from zero to reach maximum amplitude, and then decrease back to zero again. Wavelets thus have a location where they peak, a characteristic oscillation period, and also a scale over which they amplify and decline. Consequently, wavelet analysis makes it possible to retain some frequency and time localization. Wavelets are defined in reference to a mother function ψ(t) of some real t variables:
where j is the scaling parameter and k is the translation parameter.
Daughter wavelets are generated by translating ψ(t) → ψ(t + 1) and scaling ψ(t) → ψ(2t) the mother function (Weng and Lau, 1994). The translation and scaling functions are in Eq. (2), above and below, respectively:
The continuous wavelet transform of function f(t) is defined as follows:
where f(t) is the function that generates the data series under analysis, which is normalized by
The most suitable wavelets for each type of mother wavelet are selected depending on the accuracy needed for localization in the frequency and/or time domains. This study uses the Morlet wavelet, which provides a good representation of non-stationary signals found in nature. These wavelets are complex, and their features are similar to the features of the meteorological signal under analysis, such as symmetry/asymmetry or sudden/gradual variation (Vitorino, 2002). Further details of the method can be found in Torrence and Compo (1998).
The Morlet time-scale function is given by the following equation:
where w o is the dimensionless frequency and t each datum in the time series. The wavelets generated in this study have w o = 6 as suggested in Torrence and Compo (1998) and were calculated as follows:
The wavelet method was applied in this paper to detect, analyze, and characterize the time scales of atmospheric systems over extensive areas. The analysis was made of three spectral OLR modes: (1) two-eight days, representing synoptic variability such as cold fronts and cyclones; (2) 10-30 days, for sub-monthly variability, and (3) 30 to 60 days, for intra-seasonal variability associated to the MJO.
3. Results and discussion
3.1 Spatial OLR patterns
The spatial patterns of total and filtered OLR power spectra of austral summer (December 1-February 28) in the period 1979-2016 were obtained for the synoptic (two to eight days), sub-monthly (10 to 30 days), and intra-seasonal (30 to 60 days) scales. The analysis of the spatial OLR pattern on the filtered scales reveals the most significant convection areas throughout the domain. As shown in Figure 1, there are important values of total OLR variance over the Maritime Continent, Australia, the west Pacific Ocean, and the South Pacific Convergence Zone (SPCZ). Brazil presents revealing OLR variance over the south, south-east, center-east, and northeast of its territory. In the mentioned areas of Brazil, OLR variance values are associated with the SACZ (Carvalho et al., 2004), where convective activity is strong typically during the austral summer, occasionally connecting to portions of the central-eastern, and northeastern Brazil, and the Inter-tropical Convergence Zone (ITCZ). In the Amazon, as convective activity dominates throughout the summer, the variance is small. In the equatorial Pacific Ocean, OLR variability is mainly associated with convective cells that develop along the ITCZ (Sandeep and Stordal, 2013) and with active convection prevailing in the western subtropical sector, along the SPCZ (Kodama, 1992; Vincent, 1994).

Fig. 1 Total outgoing longwave radiation (OLR) variance (W² m-4) for austral summers (DJF) in the period 1979-2016.
Figure 2 shows OLR variance on the synoptic scale. The core of maximum OLR variance is over Paraguay, northeastern Argentina, Uruguay and the southeast of Brazil, and it extends diagonally towards Bolivia and towards the center-southeast of Brazil, but with lower OLR values. In general, the OLR variance values shown indicate the presence of convective cells over South America. In the south of South America, the variance is explained by frontal systems (Cavalcanti et al., 2009; Reboita et al., 2010) and mesoscale convective systems associated with the low-level jet (Salio et al., 2007; Rodrigues-Alcantara et al., 2014), or the Chaco low (Salio et al., 2002; Seluchi and Saulo, 2012). In addition, Figure 2 shows that in the equatorial Atlantic, the OLR variance along the ITCZ is characterized by intense variable convection, as found in Sandeep and Stordal (2013).

Fig. 2 Spectral OLR variance (W² m-4) on the synoptic scale (2 to 8 days) obtained through wavelet transform for austral summers (DJF) in the period 1979-2016.
Summertime variance of OLR anomalies at the sub-monthly scale (10-30 days) is presented in Figure 3. The center-west and southeast of Brazil have the highest OLR variance, associated with the establishment of convergence zones such as the SACZ. As widely known, the SACZ causes persistent and heavy rains over large areas of Brazil. The region is dominated by convergence of water vapor in the lower troposphere and upward motion (Kodama, 1992; Liebmann et al., 1999). Other studies (Nogués-Paegle and Mo, 1997; Schneider, 2004) also identified the influence of sub-monthly scale signals in the southeast of South America during the austral summer. In general, the sub-monthly scale is considered to play an important role in South America.
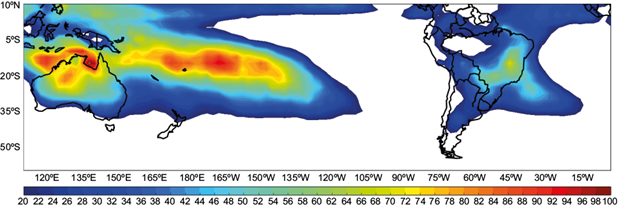
Fig. 3 Spectral OLR variance (W² m-4) on the sub-monthly scale (10 to 30 days) obtained through wavelet transform for austral summers (DJF) in the period 1979-2016.
The intra-seasonal OLR scale displays high values (Fig. 4) in northeastern and southeastern Brazil extending towards the ITCZ in the North Atlantic and towards the southwest Atlantic along the SACZ (Carvalho et al., 2004). On the other hand, over the western Pacific and the Maritime Continent along the SPCZ, intra-seasonal OLR variance ranges from 50 to 66 W2 m-4 and is associated to the MJO (Madden and Julian, 1971, 1972), which impacts the southeast and northeast of Brazil (Valadão et al., 2017). These results are similar to those presented by Hirata (2013), who analyzed intra-seasonal variability associated with summer convection in South America.

3.2 Case analysis
3.2.1 Case 1: January 11-12, 2011
The first half of January 2011 is acknowledged as the time of the major natural disaster (Infoclima, 2011) in Rio de Janeiro, Brazil. This event, known as the mega-disaster of the mountains of Rio de Janeiro, is still widely studied by researchers from different disciplines. Although the coast of the states of Rio de Janeiro and Sao Paulo is prone to heavy rainfall and landslides because of its topography, the amount of precipitation that fell during that event was outstanding. The event developed when the SACZ channeled moisture from the Amazon region onto the southeast of Brazil where it rained about 250 mm. As a consequence, downslope floods, mudslides and mudflows left thousands of people homeless, caused power and communication systems to collapse, and destroyed numerous highways and bridges.
Accumulated rainfall in January 2011 in the municipality of Nova Friburgo (state of Rio de Janeiro) was 432.8 mm of which 250.8 mm fell in only 48 h (January 11-12, 2011). On these two days it rained more than the average for the whole month of January, which according to INMET (2009), is 220-260 mm (average from 1961 to 1990). On that occasion, heavy rainfall also occurred in the states of São Paulo, Minas Gerais, Goiás, and Mato Grosso.
Figure 5 shows the average OLR spectral power on the synoptic, sub-monthly and intra-seasonal scales during the event under analysis (January 5 to 11, 2011). A wide range of high values of OLR spectral power extends from the northwest to the southeast of Brazil. The synoptic scale has the greatest amplitudes, followed by the sub-monthly and intra-seasonal scales. On the first days of January 2011, the SACZ was associated to an upper-level cyclonic vortex (Kousky and Gan, 1981), causing precipitation in the northeast of Brazil. During the period of analysis, convective activity developed along the SACZ. Simultaneously, a convection suppression phase was observed in much of northeastern Argentina and southern Brazil. Such enhancement-suppression of convection forms the well-known rainfall seesaw pattern that prevails during the summer in South America (Nogués-Paegle and Mo, 1997; Carvalho et al., 2004; Schneider, 2004).
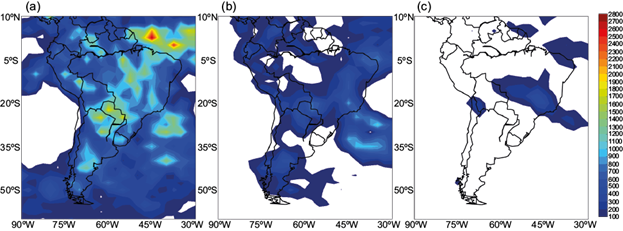
Fig. 5 Mean OLR variance (W² m-4) of: (a) synoptic, (b) sub-monthly, and (c) intra-seasonal scales from January 5 to 11, 2011.
Figure 6a shows a contour map calculated with the Global Wavelet Spectrum along 17.5º SW, between 7.5º and 180º W. The longitudinal cross-section at 17.5º S coincides with the mean latitudinal position of the ZCAS event during the summer period December 2010 to February 2011. A longitudinal band that extends from 130º to 75º W shows minimum power values for the selected intra-seasonal and synoptic harmonics. There is also a small region where the annual and inter-annual (two years) cycles are relatively intense. Harmonics power grows from this band towards the east and west, so that several scales (annual, intra-seasonal, sub-monthly and synoptic) are present in the South Pacific Ocean (180º to 125º W). The signal of the power spectrum weakens over the south-eastern Pacific (125º to 75º W). On the other hand, the signals of different scales strengthen again from 75º W over the South Pacific to 43º W over South America and weaken again over the South Atlantic Ocean. It is worth highlighting that convection along 17.5º S is attenuated by the relatively cold waters of the eastern Pacific Ocean, the eastern Atlantic Ocean and the Andes mountains. However, over the western Pacific Ocean and South America, convection can be modulated by transient systems, convergence zones, and other sub-monthly and intra-seasonal scale systems.

Fig. 6 Harmonic values of OLR global wavelet spectrum as a function of: (a) longitude (along 17.5º S) and (b) latitude (along 42.5º W). Spectral power is represented by the color scale. The period is in logarithmic scale. See text for details.
The longitudinal section (60º N to 60º S) along 42.5º W, which coincides with the mean longitudinal position of the ZCAS event during the summer period from December 2010 to February 2011 (Fig. 6b), shows a remarkable annual cycle along South America, the ITCZ and part of the equatorial North Atlantic Ocean. In the tropical and subtropical areas of South America, a wide band is observed with scales ranging from the synoptic, sub-monthly, intra-seasonal, and semi-annual scales, whose simultaneous presence, in coincidence with the establishment of persistent weather systems such as the SACZ, provides evidence for scale interaction.
Considering the 95% confidence level for the global wavelet spectrum of OLR, a noticeable interaction of intra-seasonal spectral components stands out around January 11. Components were divided into wave groups with periods of 88, 73, 58 and 31 days (intra-seasonal); sub-monthly, with periods of 17 days, and harmonics, with periods of 10 days (synoptic scale). The large volume of rainfall that fell on January 11 and 12 is associated to great power spectrum OLR amplitudes. This is indicative of strong convective activity due to a favorable phase of the intra-seasonal oscillation in the region.
Figure 7 shows the OLR time series for the 2010 and 2011 austral summers on the synoptic (blue), sub-monthly (red), and intra-seasonal (green) scales. The sub-monthly scale presents seven minimum and eight maximum values. Minimum values are associated with negative OLR anomalies, indicative of intense convective activity in the region. On January 14, 2011 sub-monthly-scale OLR values were lower (around -16) than the intra-seasonal and synoptic scales (around -2 and -10, respectively). These negative OLR anomalies on the three scales would indicate phenomena favoring precipitation were active on that day. In this sense, the three scales can be assumed to be interacting from January 11 to 15, 2011 with energy transfer among scales.
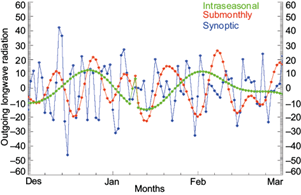
Fig. 7 Time series of OLR for the synoptic scale (blue), sub-monthly (red) and intra-seasonal scale (green) during austral summers (DJF) of 2010 and 2011 in southeast South America.
Based on this analysis, it can be inferred that when the spatial pattern of the negative phase of intra-seasonal oscillation (which favors convection) over southeastern Brazil coincides with the corresponding sub-monthly and synoptic disturbance pattern (SACZ), strong scale interaction occurs which enhances the SACZ and causes more rainfall. In this type of situations, advection of cyclonic vorticity on the synoptic scale and associated divergence in the upper troposphere become more effective in maintaining upward air motion and instability over the region.
In relation to the circulation field associated with the event, Figure 8 shows the streamlines at high (200 hPa) and low (850 hPa) levels. Figure 8a shows an anticyclonic circulation over a large part of South America. To the east of the anticyclone, there is a high-level cyclonic vortex. Figure 8b shows the SACZ crossing the South American continent from the southwest Atlantic to the south of the Amazon region. The SACZ has an associated extratropical cyclone over the South Atlantic Ocean at around 35º S. Moisture and heat are transported from the southeast, center-west and north, where the SACZ is active (Fig. 8b), towards the southeast of Brazil (figure not shown).

3.2.2 Case 2: December 22-25, 2014
The second case was a heavy precipitation event associated with the SACZ that occurred in the southeastern region of Brazil from December 22 to 25, 2014. This event was selected after analyzing OLR power spectra of a series of precipitation events because it presented a strong sub-monthly OLR negative anomaly. During those days, intense precipitation was observed in the south, center-west, southeast, and north of the southern region of Brazil. In addition to the SACZ, other systems such as cyclonic circulation at 850 hPa, vertical motion at 500 hPa, and mass divergence at 200 hPa contributed to the rainfall events in these regions.
Figure 9 shows the average behavior of the spectral power of OLR on the synoptic, sub-monthly and intra-seasonal scales, from December 22 to 25, 2014 associated to the occurrence of the SACZ event (Climanálise boletim, 2014). A wide range of high OLR spectral power values extends from the northwest to the southeast of Brazil, coinciding with the establishment of a period of active convection in the SACZ. The greatest amplitudes are on the sub-monthly scale, followed by the synoptic and intra-seasonal scales. During this event, the most intense precipitation occurred in the central-western and southeastern regions of Brazil.

Fig. 9 Mean OLR variance (W2 m-4) of: (a) synoptic, (b) sub-monthly, and (c) intra-seasonal scales from December 22 to 25, 2014.
Contour maps with cross sections at 22.5 S (Fig. 10a) and 44.5º W (Fig. 10b) were calculated with Global Wavelet Spectrum. The longitudinal cross-section along 22.5º S (7.5º to 150º W) coincides with the mean latitudinal position of the ZCAS event during the summer period from December 2014 to February 2015. Within the longitudinal band (60º to 21º W) several scales stand out, i.e., annual, intra-seasonal, sub-monthly, and synoptic. The signals of the different scales strengthen again in the band from 107º to 150º W. It is worth highlighting that along parallel 22.5º S convective activity is attenuated by the relatively cold waters in the eastern Pacific Ocean, the eastern Atlantic Ocean and by the Andes mountains. On the other hand, convection can be modulated by transient systems, convergence zones, and other sub-monthly and intra-seasonal systems over the western Pacific Ocean and South America.

Fig. 10 Harmonic values of OLR global wavelet spectrum as a function of: (a) longitude (along 22.5º S) and (b) latitude (along 44.0º W). Spectral power is represented by the color scale. The period is in logarithmic scale. See text for details.
The longitudinal section (20º N to 60º S) along 44.5º W (Fig. 10b), that coincides with the mean longitudinal position of the ZCAS event during the summer period from December 2014 to February 2015, shows a remarkable annual cycle along South America, the ITCZ, and part of the equatorial North Atlantic Ocean. On the other hand, a wide band is observed with scales ranging from sub-monthly to intra-seasonal and semi-annual, mainly in the tropics and subtropics of South America. The simultaneous presence of the sub-monthly and intra-seasonal scales, coinciding with the establishment of persistent weather systems such as the SACZ provides further evidence of scale interaction.
Figure 11 shows the OLR time series for the austral summers of 2014 and 2015 on the synoptic (blue), sub-monthly (red) and intra-seasonal (green) scales. The sub-monthly scale presents five minimum and six maximum values. Minimum values are associated with negative OLR anomalies and are an indication of intense convective activity in the region. On December 22, 2014 the sub-monthly scale presents smaller OLR (around -24) than the intra-seasonal and synoptic scales, which have around -10 and 4, respectively. These values indicate the dominance of the sub-monthly scale on this day. On December 23, 2014 OLR dropped on the synoptic and sub-monthly scales to around -12 and -24, respectively. Although OLR on the intra-seasonal scale showed a slight increase to -9, it remained negative. Negative OLR anomalies on the three scales of variability are indicative of convective activity. In this sense, the three scales can be assumed to be interacting on December 23, 2014 with energy transfer among scales. According to Cai and Mak (1990), low frequency planetary scale waves and high frequency synoptic scale waves within a balanced state of the atmosphere are symbiotically dependent on one another. In the context of scale interaction, Cuff and Cai (1995) were able to determine a transfer of energy between low and high frequency modes in an observational study on the interaction between low and high frequency transient systems. These authors argue that low-frequency transients organize high-frequency transients (Schneider, 2004).

Fig. 11 Time series of OLR for the synoptic scale (blue), sub-monthly (red) and intra-seasonal scale (green) during austral summers (DJF) of 2014 and 2015 in the southeast of South America.
Figure 12 shows streamlines at high (200 hPa) and low levels (850 hPa). At high levels (Fig. 12a), anticyclonic circulation is observed over a large part of South America and a high-level cyclonic vortex is observed east of the anticyclone. The subtropical jet is intense in the southern region of Brazil. In addition, a trough is seen to the west of the jet in the south of South America. In the southeast of Brazil, wind convergence is observed at low levels (Fig. 12b), and the South Atlantic Subtropical Anticyclone can be seen entering the continent. The winds associated with the anticyclones coming from the Atlantic Ocean towards the Amazon region change direction to the southeast of Brazil, which indicates that there is transport of moisture and heat into this region. There is a trough in the south, which indicates unstable weather east of this trough.

4. Conclusions
We analyzed the variability modes of the synoptic, sub-monthly, and intra-seasonal scales that modulate rainfall events over South America and adjacent oceans during the austral summers of the period 1979-2016. To do so, we examined OLR power spectrum fields (variance). The results obtained for South America indicate that the sub-monthly scale has influence on the SACZ. Also as observed in the southeastern region of Brazil, the sub-monthly scale presents greater amplitude compared to the intra-seasonal scale.
Based on this analysis, the influence of the synoptic, sub-monthly, and intra-seasonal scales on two heavy precipitation events over southeastern Brazil, during an active SACZ, was examined. The analysis of the January 2011 case suggests that when the spatial pattern of the negative phase of intra-seasonal oscillation (which favors convection) in southeastern Brazil concurs with sub-monthly (SACZ) and synoptic scale disturbance patterns, the three scales interact strongly, such that the SACZ becomes more active and rainfall increases. In such situations, synoptic-scale advection of cyclonic vorticity and associated upper-troposphere divergence become more effective in sustaining upward motion and instability over the region. The sub-monthly scale was dominant in the development of the second event of December 22, 2014. On that day, a moisture channel was active, which later turned into the SACZ (December 22 to 25, 2014). In synthesis, the sub-monthly scale is observed to have had the greatest intensity and major importance with respect to the other scales. In addition, the interaction among synoptic, sub-monthly and intra-seasonal variability was observed to decay simultaneously.

