


 nueva página del texto (beta)
 Inglés (pdf)
 Artículo en XML
 Referencias del artículo
 Enviar artículo por email
 Citado por SciELO
  Similares en
SciELO
Similares en
SciELO 
 Permalink
1. Introduction
Mining operations, whether small or large, are inherently disruptive to the environment (Makweba and Ndonde, 1996). Opencast mining creates much more air quality deterioration regarding dust and gaseous pollutants in and around the mining complexes than underground mining (Ghose and Majee, 2001). Major sources of atmospheric emissions from opencast mining activity include land clearing, removal of overburden, vehicular movement on the haul roads, excavation, and loading and unloading of ore materials (Singh and Perwez, 2015).
The extraction of iron ore through open pit mining is the main economic activity of Itabira, a countryside city in the Minas Gerais state, Brazil. Founded in Itabira in 1942, the company Vale is currently the world’s largest producer of iron ore. Its annual production record was of 348.8 million tons in 2016 (Figueiredo et al., 2016).
Reserves in the Itabira district are classified as “reasonably assured ore,” or ore that, except in localities where underground exploration made necessary greater extrapolation in depth, lies within 50 m of the surface, and as “inferred ore,” or ore that lies within 250 m of the other ore (Dorr and Barbosa, 1963). For that reason, Vale has installed the largest complex of opencast mining in the world in Itabira, with an annual production of roughly 46 million tons of iron ore (about 15% of the total ore produced by Vale) (Tubino et al., 2011). The complex, unfortunately, is located close to residential areas of the city. The large emission of particulate matter (PM) into the atmosphere, inherent to mining activity, has generated significant levels of pollution, mainly affecting the communities that live around the mining areas (Braga et al., 2007; Devlin and Tubino, 2012; Wasylycia-Leis et al., 2014; Alves and Freitas, 2021).
Pollutants released from ground level and elevated sources (smokestacks) are immediately subject to atmospheric processes, with dispersion in ever-increasing volumes of air by both vertical and horizontal transport. The atmospheric dynamics and turbulence, and physical laws that govern them, may facilitate or constrain transport and dispersal (Godish, 2003).
Thus, the emission of atmospheric pollutants by fixed and mobile sources, local and remote, natural and anthropogenic, added to the orographic characteristics and the typical meteorological conditions of each region, form a set of factors that influence the concentration and dispersion of those pollutants (Pérez et al., 2020).
An air quality monitoring network was installed in Itabira and is managed by Vale, due to the normative deliberation of the Municipal Environmental Council, which imposed that the company would have to display and operate this network. Also, the results of the air quality monitoring have to be presented at monthly meetings in the Council.
This air quality monitoring network is the only source of PM emission data in Itabira; however, this data is not available in real time to the public. Besides, it only covers areas near the mines and does not measure fine particulate matter (PM2.5), defined as those particles less than 2.5 µm in aerodynamic diameter, that are the most harmful to health, compared to the coarser particles (Braga et al., 2007). Thus, a first field campaign was carried out in the city in the spring of 2016, where PM was collected on filters allowing analysis of mass concentration, black carbon content, and elemental composition.
Here we use this data to characterize the composition of PM, reveal other potential sources besides mining activities, and produce a validation against data obtained from the air quality monitoring network managed by Vale.
Principal component analysis (PCA) is used to infer the source apportionment. As long-range sources also have an impact on urban air quality, cluster analysis is also employed to identify the main air mass transport pathways based on 48 h back-trajectories calculated with the NOAA Hybrid Single-Particle Lagrangian Integrated Trajectory (HYSPLIT) model (Draxler et al., 2012). Sampling and analysis methods are detailed in section 2. Results are discussed in section 3, and our final conclusions are presented in section 4.
2. Materials and methods
2.1 Study area
Itabira has an estimated population of 120 904 inhabitants occupying an area of 1 253 704 km² (IBGE, 2020). It is located at 19º 37’08” S and 43º 13’ 37” W, about 100 km northeast of Belo Horizonte, the capital of the Minas Gerais state, Brazil (Fig.1). The Itabira iron district is located in the northeastern corner of the iron quadrangle of Minas Gerais. The district is the world’s leading center of iron-ore production (Dorr and Barbosa, 1963; Dixon, 1979). The geologic structure of the Itabira mining complex consists of a 14-km long, NE-trending range with three main synclines at both extremes (Conceição and Cauê) and middle (Minas do Meio) sections (MDO, 2020; see Fig. 2a for location).

Fig. 1 Location of Itabira, Minas Gerais, Brazil. Data sources (right panel): Tapiquén (2015), IBGE (2018).
Itabira is also only about 100 km away from the headquarters of one of the largest flat steel complexes in Latin America and the leader of the Brazilian flat steel market, producing 9.5 million tons of steel per year (Usiminas, 2020).
The regional topography is rugged (20%) and mountainous (70%) (Sobreiro et al., 2001). The altitude of the municipality is between 530 and 1638 m (Fig. 2a). The annual rainfall is about 1471 mm yr-1, with the wet period in November to February and the dry period in June to August, and the annual average temperature is 20.4 ºC (Sobreiro et al., 2001).

Fig. 2 (a) Topography (altitude in meters) of Itabira municipality and locations of mining complex and air quality monitoring network in the city (AQ01-AQS04 and MS01). (b) Detailed location of the sampler, the four AQS (AQS01-AQS04) and the two meteorological stations (MS01 and MS02) in urban area. Data sources: (a) Miranda (2005); (b) Google Earth.
Two hydrographic basins are enclosed in the region, the Rio do Peixe basin to the south and the Rio Tanque basin to the north, both belonging to the Rio Doce basin. The watersheds divide is formed by the Serra do Itabiruçu, which extends from southwest to northeast, representing the more outstanding topographical feature, sustained by the alignment of the iron formation, with original maximum heights close to 1400 m (Sobreiro et al., 2001).
2.2 Air quality monitoring network
The city of Itabira has a network of automatic air quality stations (AQS) operated by Vale, composed of four stations (identified here as AQS01, AQS02, AQS03 and AQS04; see Fig. 2a, b for location) providing a continuous monitoring, with hourly means of total suspend particles (TSP) and coarse particulate matter (PM10, defined as particles lesser than 10 µm in aerodynamic diameter) during 24 h a day. TSP are very coarse particles (30 μm and above) that settle very close to the point of emission.
The monitoring network uses Rupprecht & Patashnick Tapered Element Oscillating Microbalance (TEOM) Series 1400a samplers. These real-time monitors were included in the list of U.S. Environmental Protection Agency (EPA) approved PM10 samplers in 1990 (US-EPA, 1990) and designated as Federal Equivalent Method (FEM) samplers according to Federal regulation 40 CFR Part 53 (US-EPA, 1999).
The Rupprecht & Patashnick Series 1400a monitor consists of three main components: a sample inlet; the TEOM sensor unit, containing the microbalance and filter chamber; and the control unit to monitor and record sampling flow rate data, filter mass measurements, and ambient temperature and barometric pressure measurements (Wanjura et al., 2008).
According to the operating manual (Thermo Scientific, 2004) of this monitor, the ambient sample stream first passes through the PM-10 inlet at a flow rate of 16.7 L min-1, allowing particles smaller than 10 µm diameter to pass through. At the exit of the PM-10 inlet, the 16.7 L min-1 flow is isokinetically split into a 3 L min-1 sample stream that is sent to the instrument’s mass transducer and a 13.7 L min-1 exhaust stream. Inside the mass transducer, this sample air stream passes through a filter made of Teflon-coated borosilicate glass fiber, which is weighed every 2 s. The difference between the filter’s current weight and the filter’s initial weight gives the total mass of the collected PM. These instantaneous readings of total mass are then smoothed exponentially to reduce noise. Next, the mass rate is calculated by taking the change in the smoothed total mass between the current reading and the immediately preceding one. This mass rate is also smoothed exponentially to reduce noise. Finally, the mass concentration is computed by dividing the mass rate by the flow rate (corrected to EPA standard temperature and pressure). It is worth to highlight that the internal temperatures in the instrument are controlled to minimize the effects of changing ambient conditions.
The Rupprecht & Patashnick Series 1400a monitor also measure TSP concentration using size-selective inlets (Wanjura et al., 2008). However, here we analyze only PM10 concentrations obtained from AQS instruments, because TSP cannot be directly related to health impacts (WHO, 2000; Patra et al., 2016).
Hourly and monthly data from the AQS and the meteorological station of the monitoring network (identified here as MS01; see Fig. 2b for location), which measures wind speed and direction, temperature, relative humidity, pressure, solar radiation and rainfall, have been used in the analyses during the sampling days. These data are provided by the Itabira Municipality Environment Secretary under request.
In addition, the hourly data of wind speed and direction from the meteorological station of the Federal University of Itajubá (identified here as MS02; see Fig. 2b for location) have been also used for comparison purposes in the analyses of wind and pollution roses, since the altitude of MS01 is 919 m, whereas for MS02 is 645 m. All wind measurements are performed at 10 m above ground level (agl). The altitudes of AQS01 to AQS04 are 769, 727, 643, and 808 m, respectively.
2.3 PM sampling and analysis
The field campaign was carried out in Itabira city continuously for 37 days, from October 8 to November 14, 2016. Inhalable PM (PM2.5 and PM2.5-10) were sampled using a dichotomous sampler (Andersen Instruments) with a standard averaged flow rate of 16.7 L min-1, which corresponds to 1 m3 h-1. The air stream passes through two 47 mm diameter nucleopore polycarbonate filters and is separated into two different sizes fractions. Coarse particles (> 2.5 particle diameter [dp] < 10 μm) are collected in an 8.0 μm pore size filter while fine particles (dp < 2.5 μm) are collected in 0.4 μm pore size filters, as described by Castanho and Artaxo (2001).
Mass concentrations of fine and coarse polycarbonate filters were analyzed by gravimetry with a Mettler Toledo electronic microbalance (Model XP6) with ±1 μg sensitivity in a controlled atmosphere room (20 ºC, 40% relative humidity, with fluctuations less than 10% of these set points). The filters were equilibrated in this room for 24 h before weighing and electrostatic charges were controlled using radioactive sources, as described by Castanho and Artaxo (2001). Each filter was weighted twice, prior to and after the sampling, and the average was calculated. The difference between pre- and post-weighting represents the mass of PM deposited during the sampling period. This result is corrected for any mass change observed in the blank filters, which are weighted and handled similarly. This procedure was performed for both fine and coarse filters, resulting in mass concentrations of the fine and coarse particulate matter (PM2.5 and PM2.5-10) during the sampling period.
It is worth to highlight that the Rupprecht & Patashnick Series 1400a monitors used in the monitoring network of Itabira correct the mass concentration to EPA standard temperature and pressure and this correction was not applied for the mass concentration obtained with the sampler.
During the campaign, the equipment inlets were located about 3 m agl. Filters were changed every two days or before if the flow rate reached less than 16.7 L min-1. The location of the sampler was relatively close to the city center and of AQS02 and AQS04, at an elevation of 810 m (Fig. 2b).
The concentration of black carbon (BC) in the fine and coarse fractions was determined using a M43D Smokestain reflectometer (Difusion Systems). BC mass present in the samples was calculated from reflectance measurements, as described in Loureiro et al. (1994). X-ray fluorescence spectroscopy was performed with an Epsilon 5 equipment of PANalytical to determine the elemental composition and concentration of the atmospheric particulates contained in the filters. The measurement was repeated three times for each sample, in both fine and coarse modes, and the mean value was considered for each trace element. The energy dispersive X-ray equipment was calibrated using NIST standards, as described by Arana et al. (2014). The analyses of gravimetry, BC concentration and the X-ray fluorescence were performed in the Laboratory of Atmospheric Physics, Sao Paulo University Institute of Physics.
2.4 Air mass trajectories and long-range transport of pollutants
To verify if there is a contribution from sources outside the city, the HYSPLIT model (Draxler et al., 2012) was used to calculate air-mass trajectories arriving at the sampling site. Meteorological data obtained from the global data assimilation system (GDAS) at a 0.25 × 0.25º resolution grid was used, and back trajectories for each campaign’s day were simulated for 48 h starting at 100 m agl.
Then, a cluster analysis was performed on the simulated trajectories to identify the preferential direction of the air masses. This method consists of grouping air masses trajectories with similar transport patterns (speed and direction) and representing their mean trajectory. The method minimizes the intra-cluster differences among trajectories while maximizing the inter-cluster differences (Su et al., 2015).
According to Draxler et al. (2012), at first each trajectory is defined to be a cluster (i.e., there are N trajectories and N clusters). For the first iteration, for every combination of trajectory pairs, the cluster spatial variance (SPVAR; Eq. 1) is calculated. SPVAR is the sum of the squared distances between the endpoints of the cluster’s component trajectories and the mean of the trajectories in that cluster. Then, the total spatial variance (TSV; Eq. 2), i.e., the sum of all SPVAR, is calculated. The pair of clusters combined are the ones with the lowest increase in TSV. After the first iteration, the number of clusters is N-1.
where D is the distance between a trajectory endpoint and the corresponding cluster-mean endpoint.
The iterations continue until the last two clusters are combined, resulting in N trajectories in one cluster. In the first few clustering iterations, the TSV increases rapidly, then it increases slowly, generally at constant rate, for much of the clustering, but at some point, it again increases rapidly, indicating that the clusters being combined are not similar and, thus, this sudden change in TSV can be used as a tool to identify the optimum number of clusters (Yang et al., 2019).
3. Results and discussions
3.1 PM concentration and meteorological conditions
Figure 2b shows the location of the sampler relative to the four AQS. It is also possible to see the mining areas around the city. Figure 3a, b illustrates the prevailing wind direction and its velocity during the period of sampling for MS01 and MS02. For both meteorological stations it is possible to verify that winds blow primarily from the northeast towards the southwest with speeds varying mostly between 2.1 to 5.7 m s-1. The wind speed in MS02 is greater than MS01 due to the differences of altitude (Fig. 3a, b). As Itabira is a mining town, the urban area of the municipality was formed near the mining complex. It would be expected that downwind receptors are far more likely to be affected by air pollution. Thus, the sampler was located exactly in the typical downwind direction (Figs. 2 and 3).

Fig. 3 Wind rose for (a) MS01 and (b) MS02. (c) NOAA HYSPLIT backward trajectory cluster analysis for the sampling days.
As of this writing, the city of Itabira has two industrial districts, dedicated to non-metallic mineral transformation and food products, metallurgical, mechanical and wood industries, which are located in the south direction. Thus, most of the city lies upwind of the industrial zone, and hence is largely protected from local industrial emissions, but not from mining emissions to the NE, as we already mentioned.
Figure 3c shows there is also a long-range transport of aerosols from the northeast (84% of the trajectories), east-southeast (12%) and south-southwest (3%) directions. This cluster analysis was also performed using GDAS data with 1 × 1º resolution, as Su et al. (2015) found that different GDAS resolutions in areas with complicated topography could lead to differences between back trajectories due to differences in vertical motion calculation. However, the results here were similar, with east and northeast directions appearing as the main long-range transport routes of pollutants, agreeing with the prevailing wind direction (Fig. 3a , b). Thus, on east and northeast wind days, most of the city is exposed to cross-border pollution.
Figure 4a, b show the diurnal variations of PM10 for January 1, 2014 to November 30, 2018 and the annual variations from January 1, 2014 to September 30, 2020, respectively, for all AQS. This period was selected according to data availability. Regarding the diurnal variations (Fig. 4a), it is possible to verify an increase in PM10 concentrations during the nocturnal period due to less favorable conditions for particle dispersion caused by the inversion temperature and lower planetary boundary layer. Lower concentrations are seen from 09:30 to 15:30 LT when atmospheric dispersion is greater due to a more unstable atmosphere that promotes transport and mixing of air. The annual variations (Fig. 4b) are characterized by an increase in PM10 concentrations from a minimum in March to a peak in September. From November to March, when the precipitation is significative, PM10 concentrations are the lowest.
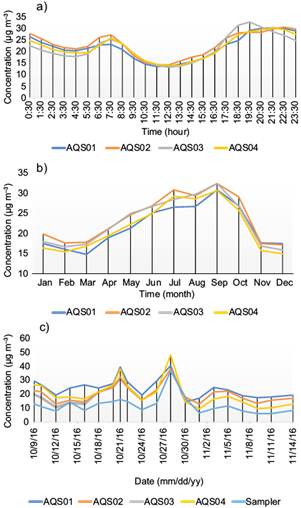
Fig. 4 (a) Diurnal and (b) annual variations of PM10 (μg m-3) for the four AQS from January 1, 2014 to November 30, 2018 (diurnal) and form January 1, 2014 to September 30, 2020 (annual). (c) Sampler and automatic air quality stations concentrations (μg m-3) of coarse particulate matter (PM2.5-10 and PM10, respectively) for the sampling days.
Figure 4c shows the concentration of PM10 obtained from all AQS and from the sampler (PM2.5-10). The time scale of the plot corresponds to the filter change days. For this comparison, hourly data of the four AQS were averaged considering the days and the approximated hour of beginning and ending of filter change. From October 24, 2016 onwards, the AQS03 has been disabled. The correlation between the average concentration of the four AQS and the concentration of the sampler is 0.84 (significant at 95% level). As expected, concentration values obtained through the sampler are lower than obtained for all AQS as it refers to the PM2.5-10 fraction.
The concentration was the highest on October 28, 2016 for all AQS and the sampler (Fig. 4c). This day was characterized by no rainfall occurrence and a change in the wind direction relative to the five preceding days (NE and ENE to SSE). The anomaly for this day (value of the wind direction in this particular day minus the monthly mean) was equal to +77.9º. The five preceding days were characterized by negative anomalies. In the SSE direction there is an open pit mining in the municipality of Bela Vista de Minas (distant about 50 km from Itabira), which in this particular day could have collaborated to an increase in coarse PM.
PM10 concentrations stay below the Brazilian Legal Patterns stated by the Brazilian National Environmental Council (CONAMA) Resolution number 3 (daily mean of 150 μg m−3). This is the same standard considered by the EPA (2020). However, the World Health Organization (WHO) and the European Union air quality guidelines for 24-h average is 50 μg m−3, not to be exceeded more than 35 times a calendar year (European Parliament, 2008; WHO, 2008). Recently, in 2018, Brazilian federal air quality standards were changed to CONAMA Resolution number 491, which revoked and replaced CONAMA Resolution number 3, with the goal to reach the same standard of WHO (50 μg m−3 for PM10), but no deadline was defined for it to be accomplished.
The days before the start of data collection campaign in 2016 were rainy. During the sampling period, the rainfall occurred on October 24 (0.5 mm), November 11 (17 mm) and November 14 (41 mm). Light rain occurred on days between November 1 to 7. In addition, October 12 was a holiday, and as during the weekends, concentrations are lower. According to Gour et al. (2013), Dinoi et al. (2020) and Yousefian et al. (2020), concentrations of atmospheric particles are lower during weekends and holidays because pollution is related to the weekly cycle of human activities. This happens in Itabira as mining operations are also altered during weekends, with reduction in some activities.
Table I shows the descriptive statistics for the AQS and the sampler during the beginning and end of campaign days. It is possible to note that AQS01, the nearest station to the mine, presents the greatest PM10 mean and maximum values.
Table I Descriptive statistics for air quality and meteorological parameters from the four AQS (considering the hourly data) and the sampler during the begin and end of campaign days.
| Parameters | Mean | SD | MV (%) | Maximum | Minimum |
| PM10 (AQS01) (µg m-3) | 23.3 | 13.7 | 2.1 | 148.2 | 2.2 |
| PM10 (AQS02) (µg m-3) | 19.2 | 10.2 | 0.9 | 86.0 | 3.0 |
| PM10 (AQS03) (µg m-3) | 18.3 | 9.0 | 57.2 | 47.8 | 0.7 |
| PM10 (AQS04) (µg m-3) | 18.1 | 10.6 | 2.7 | 115.4 | 0.7 |
| PM2.5-10 (sampler) (µg m-3) | 12.2 | 6.8 | 0 | 36.7 | 5.8 |
| PM2.5 (sampler) (µg m-3) | 7.0 | 2.9 | 0 | 15.3 | 3.0 |
| BC2.5 (sampler) (µg m-3) | 1.0 | 0.4 | 0 | 2.2 | 0.4 |
| BC2.5-10 (sampler) | 0.2 | 0.05 | 0 | 0.3 | 0.08 |
| Pressure (mbar) | 955.4 | 15.7 | 36.9 | 1058.8 | 880.5 |
| Solar radiation (W m-2) | 189.5 | 266.9 | 17.7 | 919.1 | 0 |
| Wind Velocity (m s-1) | 3.6 | 1.44 | 39.2 | 7.7 | 0.4 |
| Wind direction (º) | 114.6 | 97.9 | 1.0 | 359.6 | 0 |
| Rainfall (mm) | 0.1 | 0.9 | 1.0 | 17 | 0 |
| Temperature (ºC) | 23.1 | 4.0 | 39.3 | 35.3 | 14.8 |
| Relative humidity (%) | 68.1 | 17.3 | 35.0 | 99.9 | 28.1 |
SD: standard deviation; MV: missing values.
Figure 5a shows the daily concentrations of PM for coarse (PM2.5-10) and fine (PM2.5) modes obtained from the sampler. The PM2.5 concentration was highest on October 21, whereas for PM2.5-10 it was highest on October 28 (Fig. 5a). The average of PM2.5/PM2.5-10 ratio is 0.57 (Table I), a value quite similar to what was found by Soluri et al. (2007) for annual mean in Rio de Janeiro, the second largest Brazilian city. On October 28 this ratio was lower and equal to 0.2 (Fig. 5a) because of the significant contribution of coarse particles in this particular day, mentioned earlier. The correlation between the two modes is 0.45 (significant at a 95% level).

Fig. 5 Sampler concentrations (μg m-3) of (a) particulate matter for fine (PM2.5) and coarse (PM2.5-10) modes with error bars, which represent the uncertainty of each measurement. (b) PM2.5 and fine mode of black carbon. (c) PM2.5-10 and coarse mode of black carbon for the sampling days.
According to Xu et al. (2017), fine and coarse particles are generally produced by different sources: PM2.5-10 is mainly produced from natural processing, such as re-suspension of local soil, as well as from anthropogenic sources like road dust, whereas PM2.5 is largely comprised of primary and secondary anthropogenic combustion products. The authors verified that the daily average PM2.5/PM10 ratio vary significantly day by day, e.g., minimum values of the ratio in one day can occur during traffic hours in consequence of re-suspended coarse road dust. Moreover, fine particles have smaller settling velocities compared with their coarse counterparts (Kumar et al., 2018), hence they have a longer atmospheric residence time and their dispersion pattern will be different from the coarse ones (Patra et al., 2016).
The concentrations of fine BC and PM2.5 present a similar pattern, but this cannot be verified for the coarse mode of BC and PM2.5-10 (Fig. 5a, b). The correlation between fine BC and PM2.5 is 0.86 (significant at the 95% level), whereas between coarse BC and PM2.5-10 it is 0.25 (not significant). The fine and coarse BC mean concentrations are 1.0 ± 0.4 μg m−3 and 0.2 ± 0.05 μg m−3, respectively (Table I) and represent 14 and 2% in the PM2.5 and PM2.5-10, respectively. Castanho and Artaxo (2001) found for São Paulo city a fine BC mean concentration ranging from 7.6 to 4.1 μg m−3 in winter and summertime, respectively, representing 21 ± 4% in winter and 28 ± 10% in summer of PM2.5. De Miranda et al. (2012) found, for urban areas of São Paulo, Rio de Janeiro, Belo Horizonte, Curitiba, Porto Alegre and Recife cities, fine BC mean concentrations of 10.6 ± 6.4, 3.4 ± 2.5, 4.5 ± 3.3, 4.4 ± 4.0, 3.9 ± 4.3 and 1.9 ± 1.1 μg m−3 for a one-year or longer period. Also, according to the authors, the percentage contribution of BC was lowest in Rio de Janeiro (20 ± 7%) probably because diesel-powered (heavy-duty) vehicles represent a smaller proportion of the total vehicle fleet in this city than in others evaluated.
Figure 6 depicts the correlation between hourly data of meteorological parameters obtained from MS01 and particulates from all AQS. It is worth to highlight that some meteorological variables present a large number of missing values, especially pressure, wind velocity, temperature and relative humidity. Thus, the pairwise correlation was used here, and the sampler data was not considered, since the number of pairs for the sampling days mean would be very small.
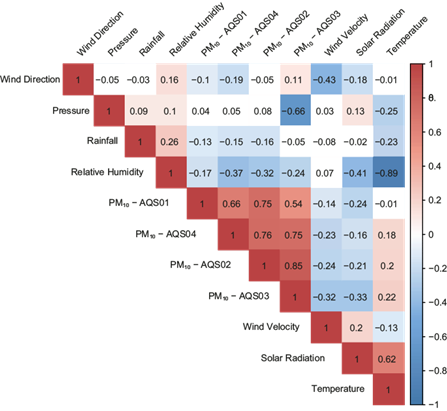
Fig. 6 Pearson correlation coefficient between the meteorological parameters and particles from air quality stations for the sampling days. Shaded colors represent significant values at the 95% level (p-value < 0.05).
Wind direction shows weak and negative correlations with PM10 for all AQS, except for AQS03 (positive correlation) (Fig. 6). Atmospheric pressure has a significant (at a 95% level) negative correlation with PM10 (-0.66) from AQS03, the farthest station from the mines.
Rainfall and relative humidity have a significant negative correlation with PM10 for all AQS, except for AQS03 (not significant for rainfall). The lower the relative humidity, the higher the concentration of particulates in the atmosphere. Low air humidity is related to a lower chance of rainfall (positive correlation; Fig. 6) and is, therefore, associated with dry air, which favors high concentrations of air pollutants. The mean relative humidity for the sampling period is 68 ± 17%, with a minimum of 28% and a maximum of 99.9% (Table I).
Wind velocity has significant negative correlations with PM10 for all AQS (Fig. 6). Particles can travel for greater distances at higher wind speeds, contributing to pollutants dispersion. The mean wind velocity for the sampling period is 3.6 ± 1.4 m s-1 (Table I). Significant and positive correlations are seen between temperature and PM10 for all AQS, except for AQS01 (negative correlation), the closest station from the mines. High temperature causes lifting of soil particles into the atmosphere (Latha and Highwood, 2006), which can reach the more distant AQS from the mines, increasing the concentration they measure. The mean temperature for the sampling period is 23.1 ± 4 ºC, with a minimum of 14.8 ºC and a maximum of 35.3 ºC (Table I).
Solar radiation is an important factor for the concentration of particulates, since high values of radiation increase the lower troposphere instability, favoring convective activity. Although temperature has a positive correlation with solar radiation, significant negative correlations are seen between solar radiation and PM10 for all AQS (Fig. 6), the opposite being found for temperature. It is worth to highlight that this variable presents the greater percentage of missing values (Table I). Mean solar radiation during the sampled period is 189.5 W m-2 and its standard deviation is high (266.9 W m-2) due to daily cycle (Table I). The lowest correlations for PM10 are of AQS01 with AQS04 and AQS03 (Fig. 6).
3.2 PM Elemental analysis
Different sources contribute to coarse and fine particles. In general, diesel vehicles emit a larger number of fine particles per vehicle. In addition, a significant contribution to fine PM mass comes from secondary aerosols (inorganics such as ammonium sulfate and ammonium nitrate, but also secondary organic aerosols), which are formed in the atmosphere through chemical/physical processes (WHO, 2006).
Table II presents the results of the X-ray fluorescence analysis for the main trace elements present in fine (PM2.5) and coarse (PM2.5-10) modes, respectively. The mean concentration for the 37 days of sampling was calculated for each element in both modes, as well as the standard deviation and mean relative distribution (calculated by dividing the total sample concentration by the trace element concentration and multiplying by 100). It can be noted that sulfur (S) has the highest concentration in the fine mode (representing 32.2% relative to the total trace element load). Iron (Fe) has also a significant presence in the fine mode of PM (15.9%), compared to the other elements, such as potassium (K) (13.6 %), silicon (Si) (11.3%), sodium (Na) (10.6%), aluminum (Al) (8.8%), and calcium ( Ca) (3.8%). De Miranda et al. (2012) analyzed the mean concentrations of trace elements in the fine mode for urban areas of six great cities (see table 7 in their paper). They found in summer (October to March) high concentrations of S and minerals (Al, Si, Ca, and Fe) in the fine mode, derived from fuel combustion and soil resuspension, respectively. The concentration of S found here (349.8 ± 137.9 ng m-3) is higher than what they found for Belo Horizonte (331.5 ± 195.0 ng m-3) and Recife (228.6 ± 104.5 ng m-3). In addition, in fine mode Fe presented a higher concentration (171.7 ± 71.9 ng m-3) in Itabira than in all the six cities analyzed by the above-mentioned authors (see Table III for comparison).
Table II Mean concentration (MC), standard deviation (SD) of MC, mean relative distribution (RD) and missing values percentage (MV) of trace elements (TE) in the fine (PM2.5) and coarse (PM2.5-10) modes.
| Trace element | Fine mode | Coarse mode | ||||||
| MC (ng m-3) | SD (ng m-3) | RD (%) | MV (%) | MC (ng m-3) | SD (ng m-3) | RD (%) | MV (%) | |
| Na | 110.2 | 44.9 | 10.6 | 0.0 | 162.2 | 76.7 | 5.6 | 0.0 |
| Mg | 12.0 | 5.6 | 0.6 | 45.0 | 98.6 | 37.2 | 3.3 | 0.0 |
| Al | 95.2 | 44.8 | 8.8 | 0.0 | 505.6 | 208.2 | 17.2 | 0.0 |
| Si | 122.0 | 50.7 | 11.3 | 0.0 | 605.1 | 226.6 | 20.8 | 0.0 |
| P | 9.2 | 3.8 | 0.8 | 0.0 | 11.8 | 15.6 | 0.5 | 0.0 |
| S | 349.8 | 137.9 | 32.2 | 0.0 | 86.3 | 28.4 | 3.1 | 0.0 |
| Cl | 2.0 | 0.8 | 0.2 | 15.0 | 234.9 | 223.6 | 7.6 | 0.0 |
| K | 150.9 | 75.6 | 13.6 | 0.0 | 105.0 | 30.7 | 3.7 | 0.0 |
| Ca | 39.4 | 12.3 | 3.8 | 0.0 | 291.9 | 94.8 | 10.3 | 0.0 |
| Ti | 6.5 | 2.8 | 0.6 | 0.0 | 34.4 | 13.3 | 1.2 | 0.0 |
| V | 0.4 | 0.1 | 0.01 | 70.0 | 0.8 | 0.2 | 0.01 | 40.0 |
| Cr | 1.0 | 0.4 | 0.1 | 10.0 | 2.1 | 0.9 | 0.07 | 0.0 |
| Mn | 3.9 | 2.1 | 0.4 | 0.0 | 16.0 | 9.2 | 0.6 | 0.0 |
| Fe | 171.7 | 71.9 | 15.9 | 0.0 | 746.9 | 305.7 | 25.7 | 0.0 |
| Ni | 0.5 | 0.2 | 0.04 | 5.0 | 0.4 | 0.2 | 0.01 | 15.0 |
| Cu | 0.8 | 0.4 | 0.07 | 5.0 | 1.3 | 0.4 | 0.04 | 5.0 |
| Zn | 4.3 | 2.9 | 0.4 | 0.0 | 6.0 | 1.8 | 0.2 | 0.0 |
| As | 0.1 | 0.0 | 0.01 | 5.0 | 0.1 | 0.0 | 0.004 | 5.0 |
| Se | 0.7 | 0.3 | 0.02 | 60.0 | 0.6 | 0.3 | 0.01 | 45.0 |
| Br | 2.3 | 0.8 | 0.2 | 0.0 | 0.6 | 0.3 | 0.01 | 55.0 |
| Rb | 0.9 | 0.7 | 0.02 | 70.0 | 0.6 | 0.2 | 0.003 | 80.0 |
| Sr | 1.2 | 0.2 | 0.01 | 85.0 | 3.3 | 1.7 | 0.06 | 45.0 |
| Cd | 3.0 | - | 0.01 | 95.0 | 1.6 | 0.1 | 0.004 | 90.0 |
| Sb | 3.2 | 0.6 | 0.06 | 75.0 | 4.6 | 1.6 | 0.02 | 85.0 |
| Pb | 2.2 | 1.3 | 0.2 | 10.0 | 0.6 | 0.3 | 0.01 | 75.0 |
Table III Comparison of the trace elements concentration and their standard deviation in fine mode (PM2.5) sampled at Itabira, with other six cities in Brazil and one city in China (ng m-3).
| Trace element | This study Itabira | De Miranda et al. (2012) | Zhou et al. (2014) Ji’nan (China) | |||||
| Sao Paulo | Rio de Janeiro | Belo Horizonte | Porto Alegre | Curitiba | Recife | |||
| Al | 95.2 ± 44.8 | 33.2 ± 28.4 | 32.9 ± 41.2 | 43.9 ± 55.8 | 28.3 ± 24.3 | 48.4 ± 81.9 | 55.4 ± 83.3 | 670.0 ± 460.0 |
| Si | 122.0 ± 50.7 | 76.6 ± 49.9 | 77.9 ± 63.0 | 162.4 ± 126.5 | 74.8 ± 60.6 | 74.3 ± 74.4 | 139.7 ± 163.8 | |
| P | 9.2 ± 3.8 | 36.4 ± 147.9 | 9.5 ± 48.6 | 7.1 ± 8.2 | 5.4 ± 5.2 | 1.9 ± 1.5 | ||
| S | 349.8 ± 137.9 | 896.6 ± 472.0 | 638.2 ± 398.8 | 331.5 ± 195.0 | 389.0 ± 348.4 | 384.0 ± 260.3 | 228.6 ± 104.5 | |
| Cl | 2.0 ± 0.8 | 33.5 ± 49.5 | 18.8 ± 54.6 | 11.1 ± 34.8 | 54.5 ± 80.5 | 41.8 ± 189.9 | 58.8 ± 64.6 | |
| K | 150.9 ± 75.6 | 137.6 ± 130.1 | 124.9 ± 281.0 | 141.2 ± 140.4 | 158.5 ± 156.7 | 154.6 ± 151.4 | 117.4 ± 77.7 | |
| Ca | 39.4 ± 12.3 | 52.7 ± 26.6 | 31.9 ± 23.7 | 98.5 ± 72.5 | 35.8 ± 22.5 | 37.0 ± 35.0 | 53.5 ± 29.9 | |
| Ti | 6.5 ± 2.8 | 5.7 ± 3.2 | 4.4 ± 3.5 | 4.4 ± 4.1 | 3.7 ± 2.7 | 4.0 ± 3.8 | 4.0 ± 5.2 | 50.0 ± 20.0 |
| V | 0.4 ± 0.1 | 1.3 ± 0.9 | 4.9 ± 2.9 | 1.5 ± 0.8 | 0.9 ± 0.5 | 0.7 ± 0.6 | 0.4 ± 0.3 | |
| Cr | 1.0 ± 0.4 | 1.0 ± 1.0 | 1.8 ± 0.7 | 0.7 ± 0.9 | 1.3 ± 0.7 | 0.7 ± 0.6 | 0.4 ± 0.4 | 10.0 ± 10.0 |
| Mn | 3.9 ± 2.1 | 6.6 ± 21.2 | 3.7 ± 1.9 | 25.2 ± 60.5 | 2.8 ± 2.8 | 2.1 ± 4.4 | 1.3 ± 1.3 | 110.0 ± 70 |
| Fe | 171.7 ± 71.9 | 128.3 ± 57.2 | 56.3 ± 26.4 | 107.9 ± 80.6 | 60.2 ± 44.9 | 57.3 ± 31.7 | 50.7 ± 46.7 | 2,410.0 ± 1,190.0 |
| Ni | 0.5 ± 0.2 | 0.9 ± 1.5 | 3.6 ± 1.5 | 0.8 ± 0.5 | 0.7 ± 0.2 | 0.4 ± 0.5 | 0.3 ± 0.3 | 10.0 ± 10.0 |
| Cu | 0.8 ± 0.4 | 8.1 ± 13.8 | 7.7 ± 4.8 | 4.1 ± 6.4 | 1.9 ± 1.8 | 2.6 ± 4.2 | 0.9 ± 0.9 | 40.0 ± 30.0 |
| Zn | 4.3 ± 2.9 | 53.6 ± 41.1 | 18.1 ± 15.9 | 12.6 ± 12.3 | 12.4 ± 18.9 | 9.0 ± 10.6 | 8.9 ± 10.9 | 440.0 ± 270.0 |
| Se | 0.7 ± 0.3 | 3.3 ± 3.6 | 0.4 ± 0.5 | 0.8 ± 0.3 | 0.4 ± 0.6 | 1.1 ± 1.1 | ||
| Br | 2.3 ± 0.8 | 2.8 ± 2.7 | 4.5 ± 2.1 | 2.5 ± 1.8 | 2.4 ± 1.3 | 2.0 ± 1.5 | 2.9 ± 1.5 | |
| Pb | 2.2 ± 1.3 | 15.4 ± 12.6 | 9.5 ± 7.1 | 3.0 ± 4.8 | 3.2 ± 3.1 | 7.9 ± 15.8 | 2.1 ± 1.9 | 200.0 ± 100.0 |
| As | 0.1 ± 0.0 | 60.0 ± 70.0 | ||||||
In the coarse fraction, some elements appeared in a higher concentration, compared to the fine fraction, such as Fe (25.7%), Si (20.8%), Al (17.2%), Ca (10.3%), titanium (Ti) (1.2%), magnesium (Mg) (3.3%), and chlorine (Cl) (7.6%) (Table II).
Principal components factor analysis with varimax rotation was conducted with IBM SPSS statistics software to identify the possible sources of PM. Although this method is qualitative, the great advantage is that there is no need for a priori knowledge of emission inventories (Chio et al., 2004), since Itabira city does not have any yet. All elements with missing data (see Table II) were dropped from the analysis, maintaining only the common trace elements to both modes. The missing values are due to very low concentrations of the elements, some of them below the detection limit of the instrument. Three and four principal components with eigenvalues greater than 1.0 were extracted with 83.9 and 93.2% cumulative variance for coarse and fine particles, respectively.
Figure 7 shows the main factor loadings for the coarse (PM2.5-10) and fine (PM2.5) modes of PM. The first factor has 54.7% (coarse mode) and 48.6% (fine mode) of total variance and shows high loadings of Fe > Si > Mn > Al > Ti in coarse mode and Al > Si > Ti > Ca > Fe in fine mode (Fig. 7a, b). There are significant correlations between these elements, especially in the coarse mode (Fig. 8a, b). As mentioned earlier, Al, Si and Fe have the greatest mean concentration in coarse mode (Table II). One of the sources of these elements is soil dust resuspension (Venter et al., 2017).

Fig. 7 Main factor loadings (values above 0.4) from principal components factor analysis with varimax rotation for (a) coarse (PM2.5-10) and (b) fine (PM2.5) modes of particulate matter. Factor 1: mining activities; factor 2: mining operations/iron and steelmaking industries/sea-salt; factor 3: traffic/biomass burning/biogenic; factor 4: unidentified.
The mineralogical characterization of soils may assist in the identification of sources contributing to atmospheric aerosols (Espinosa and Miranda, 2013). Figueiredo et al. (2006), using the X-ray fluorescence technique, determined the chemical composition of the iron quadrangle soil in Minas Gerais, where Itabira is located. According to them, the elements Al, Fe, Ti, K and Si came from soil minerals kaolinite (Al2Si2O5(OH)4), gibbsite (αAl(OH)3), and goethite (αFe(OH)3).
Vega et al. (2004) found that the major component of the coarse fraction was geological material (60% of PM10 mass). According to Guevara (2016), soil particles generated by wind erosion processes, traffic resuspension, mining and construction operations, and agricultural land management activities are large contributors to the coarse fraction of primary PM emissions. As Itabira is a mining city, blasting, due to opencast iron ore mine activities, is very common and the mineral dust plume generated spreads for the entire city. Monjezi et al. (2009) found that in opencast mines of Iran, blasting is one of the main sources of dust generation. It should be noted that wind speed and mine geometry are important factors influencing the pollutants dispersion from mines (Patra et al., 2016). Itabira is formed by a succession of hills and valleys. The mining area consists of the mine complexes (Fig. 2a), beneficiation areas and sterile material deposits, which are located in the urban perimeter of the city. The mean wind velocity (average of hourly data for the sampling days) is very low when Fe, Si and Mn in coarse mode and Al, Si, Ti in fine mode have the highest concentrations (between all samples from the same element in each mode), indicating that these tracers come from a local source. Also, earlier we found a negative correlation between wind speed and PM10 concentration, i.e., higher wind speeds result in lower concentrations. Thus, the first factor is associated with emissions from the mining activities, consisting mainly of coarse fractions (PM2.5-10) of the respirable particle.
The second factor contributes to 17.9 and 22% of the total variance (coarse and fine particles, respectively) and shows high loadings of Na > Ca > S in the coarse mode (PM2.5-10) and Mn > Fe > Zn > K in the fine mode (PM2.5) (Fig. 7a, b). There is a significant positive correlation between Na and Ca (0.5) and between Ca and S (0.5) in the coarse mode (Fig. 8a). Na, Cl and Mg are good indicators of marine influence (sea-salt tracers). Table II shows greater concentrations of these elements in the coarse mode (Ca > Cl > Na > Mg). The correlation between Mn-Fe is 0.9 and between Mn-K, Mn-Zn and Fe-Zn is 0.6 in the fine mode (Fig. 8b). These metal emissions can be associated with iron and steelmaking industry activities (Mohiuddin et al., 2014; Dai et al., 2015).
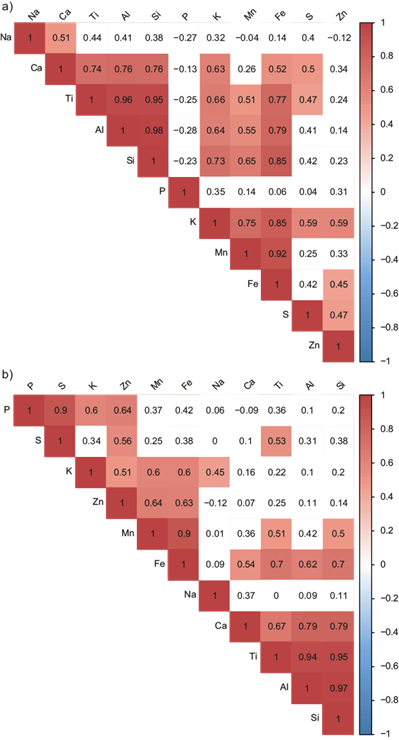
Fig. 8 Pearson correlation coefficient between the trace elements in the (a) coarse and (b) fine modes for the sampling days. Shaded colors represent significant values at the 95% level (p-value < 0.05).
Figure 9a, b shows the pollution rose maps for the PM10 hourly concentration, considering the four AQS mean during the sampling days, for both meteorological stations (MS01 and MS02). It is possible to note that high concentrations of coarse particles (PM10) are associated with wind’s drag mainly from the east-northeast direction (seen in both meteorological stations), but also being generated locally from the north-west quadrant direction (mining complex location) seen in MS02 (Fig. 9b; a lower altitude that is associated with lower wind speed) and from the southwest-south-east quadrants direction (locations of Itabira industrial district and some other regional open pit mines). The mean wind direction varied between east and northeast when Na, Ca and S in the coarse mode, and Mn, Fe and Zn in fine mode had the highest concentrations. Earlier, we showed through back trajectories that air masses arriving in Itabira originate mainly from the Atlantic Ocean, passing through the region denominated Steel Valley, as well as other steel industries located northeast and eastward of Itabira (Fig. 2c). The Steel Valley region in Minas Gerais represents one of Brazil’s most outstanding metal smelting resources (Jordão et al., 1999). Thus, the second factor is associated mainly with mining operations in the city and air mass transport from regional iron and steelmaking industry activities in the fine mode and, secondly, from long-range transport of sea salt in the coarse mode.

Fig. 9 Pollution rose maps for the PM10 (μg m-3) hourly concentration for the four air quality stations mean during the sampling days for (a) MS01 and (b) MS02. The percentage of hourly profiles for a given wind sector is indicated for each radius.
The third factor, which accounts for 11.3 and 12.6% of the total variance for coarse (PM2.5-10) and fine (PM2.5) modes, respectively, show strong loadings of Zn > P > K > S in the coarse mode and S > P > Zn in the fine mode (Fig. 7a, b). As mentioned earlier, fine particles of S can be directly emitted by automotive fuel combustion. The greatest correlations in the coarse mode are between K-S (0.59) and K-Zn (0.59), and in the fine mode between P-S (0.9) and P-Zn (0.64). Arana et al. (2014) found that high concentrations of S, K, Zn and P during the dry season in Manaus are associated with a mixture of long-range transported biomass burning and natural biogenic emissions. In Itabira, burning of vegetation for land clearing and land-use change is a common practice. The mean wind velocity ranges from 2.6 to 4.4 m s-1 and the mean wind direction from 59.6º (east-northeast) to 130.8º (southeast) when Zn, P, K and S in the coarse mode and S, P, Zn and K in the fine mode have the highest concentrations. Thus, the third factor could be associated with vehicle emissions, local and regional biomass burning and natural biogenic emissions. Finally, a fourth factor accounts for 10% of the total variance of the fine mode, with high loadings of Na > K. Here, the wind direction varies from SW to NE and the velocity ranges from 0.4 to 3.8 m s-1. Ooki et al. (2002) detected the existence of anthropogenic Na within the fine particle range in urban air and found that land-based mineral dust emissions contribute to 42% of the total sodium emissions. According to these authors, K in the urban air is thought to be derived largely from anthropogenic sources and a high correlation between the concentrations of these elements in fine mode suggests that they have the same anthropogenic source. For Itabira, this needs to be investigated, as the correlation between these elements is 0.45.
It is worth to highlight that some elements, such as copper (Cu), selenium (Se), chromium (Cr), nickel (Ni), vanadium (V), arsenic (AS), cadmium (Cd), and lead (Pb) have also been detected by X-ray fluorescence, but they were not included in factor analysis, as there was missing data in some samples (see Table II). Although none of them has exceeded the air quality standards, they deserve a lot of attention. Polidori et al. (2009) and Venter et al. (2017) stated that As, Cd, Cr, Ni, Pb and Se are considered human and animal carcinogens even in trace amounts (ATSDR, 2015). These authors also mentioned that Cu, Cr and V can contribute to oxidative DNA damage.
Itabira city has comparable contributions of Cu, Se, Cr, Ni, V and Pb with what de Miranda et al. (2012) found in summer for Recife (0.9 ± 0.9, 1.1 ± 1.1, 0.4 ± 0.4, 0.3 ± 0.3, 0.4 ± 0.3 and 2.1 ± 1.9, respectively), Porto Alegre (1.9 ± 1.8, 0.8 ± 0.3, 1.3 ± 0.7, 0.7 ± 0.2, 0.9 ± 0.5 and 3.2 ± 3.1, respectively) and Belo Horizonte (4.1 ± 6.4, 0.4 ± 0.5, 0.7 ± 0.9, 0.8 ± 0.5, 1.5 ± 0.8 and 3.0 ± 4.8, respectively), a city situated in a mining region (Table III). These are large metropolitan cities with a population of 1.56 (Recife), 1.44 (Porto Alegre) and 2.45 (Belo Horizonte) million inhabitants (de Miranda et al. 2012). Although the sampling period here was shorter, the fact that Itabira, which has an estimated population of 120 904 inhabitants (IBGE, 2020), has similar contributions of these elements (which are emitted from a variety of sources) and of S and Fe (as seen earlier), is very concerning. However, Zhou et al. (2014) measured trace metals in PM2.5 during September 2010 at one industrial area surrounded by several iron and steel plants in Ji’nan City, eastern China and found much greater concentrations of Al, Ti, Cr, Mn, Fe, Ni, Cu, Zn, Pb and As compared to Itabira (Table III). In fact, little is known about the long-term exposure of these elements regarding their impact (or not) to the health of inhabitants of the region. Thus, further research about this topic is needed.
4. Conclusions
Itabira city, in the state of Minas Gerais, Brazil, is home to the largest complex of opencast mining in the world, which is located upwind of the city. The air quality monitoring network, installed in Itabira and managed by the Vale, the company exploiting the mines, is the main source of PM emission data in the city. Moreover, these AQS only cover areas near the mines and do not measure fine PM, which could be used to evaluate potential health effects to nearby population.
Thus, in this study we sampled atmospheric aerosols of filters, with the initial objective of characterizing PM in the city and comparing high-volume data from the AQS with a dichotomous air sampler. Mass concentrations of the fine and coarse modes of PM were analyzed by gravimetry, and X-ray fluorescence spectroscopy was performed to determine the elemental composition and concentration of atmospheric particulates. Analysis was completed by a PCA on the elemental composition, and by clustering air masses trajectories, which helped identifying potential sources besides mining activities.
The city lies upwind of the industrial zone, hence it is largely protected from local industries air pollution. However, results of the trajectories cluster analysis showed a long-range transport of aerosols during the sampling days from the northeast (84% of the trajectories), east-southeast (12%) and south-southwest (3%) directions. Thus, the prevailing wind directions correspond to the largest steel production complex region in Latin America. This was corroborated by pollution rose maps, which showed wind’s drag mainly from east-northeast direction, but also with local sources of pollution (due to the lower wind speed) coming from the north-west and southwest-south-east quadrants, representing the locations of the mining complex, local industrial district and some other open pit mines in close municipalities.
Regarding the meteorological conditions during the sampling days, negative correlations were seen between PM10 from AQS and mostly all meteorological parameters (but temperature).
The average PM2.5/PM2.5-10 ratio obtained through the sampler was 0.57 and BC represents 14 and 2% in the fine (PM2.5) and coarse (PM2.5-10) modes of PM, respectively. Therefore, it can be considered a fine particulate material. These values are comparable to what was found by other authors for Rio de Janeiro city in terms of the annual mean.
The results of the X-ray fluorescence analysis showed that the main trace elements in the coarse (PM2.5-10) and fine (PM2.5) modes are Fe and S, respectively. The first factor obtained with PCA is associated with emissions from mining activities, contributing to 54.7 and 48.6% of the total with high loadings of Fe and Al (coarse and fine particles, respectively). The second factor contributes to 17.9 and 22% of the total variance with high loadings of Na and Mn (coarse and fine particles, respectively), and is associated, mainly, with mining operations and air mass transport from regional iron and steelmaking industry activities in fine mode and, secondly, from long-range transport of sea salt in coarse mode. The third factor accounts for 11.3 and 12.6% of the total variance with strong loadings of Zn and S (coarse and fine particles, respectively), and is associated with vehicle emissions, local and regional biomass burning and natural biogenic emissions. Finally, a fourth factor accounts for 10% of the total variance for fine mode, with high loadings of Na and K.
The sampling period of 37 days was short; however, it served well to perform a validation against data from the air quality monitoring network managed by Vale. Besides, our measurements were the first ever aerosol filter-sampling in the city. Further field campaigns are also necessary to characterize PM in all seasons of the year and at different areas of the city.

