


 nueva página del texto (beta)
 Inglés (pdf)
 Artículo en XML
 Referencias del artículo
 Enviar artículo por email
 Citado por SciELO
  Similares en
SciELO
Similares en
SciELO 
 Permalink
1. Introduction
Prevailing climatic conditions at a certain point on the Earth shape anthropological activities, including all socioeconomic, cultural, architectural and manufacturing activities, as well as mental and psychological wellbeing. Humans live in convenience with climatic conditions by adjusting all their habits to them and establishing settlements where suitable climatic conditions are prevalent. Following the Industrial Revolution, the sudden migration of population masses to the newly and distorted developing, unhealthy industrial cities caused rapid deteriorations and disorders in every aspect of human life, including economic, social, legal and urban development. Depending on the spatial expansion of cities, natural areas were transformed into structured areas dominated by buildings, and asphalt and concrete surfaces. Such changes, together with other air polluting anthropogenic factors like industrial manufacturing, corrupted the environmental conditions of cities by differentiating climate characteristics. A paradigmatic example is the first industrial city, London, where the first urban-rural climatic differences appeared, as explained by Luke Howard in his book The climate of London published in 1820 (apud. Landsberg, 1981). Although ancient people are reported to have perceived different characteristics of urban climate as understood from the descriptions of Vitruvius (75-26 BC) in Roman times (Fukuoka, 1997), there has been a growing interest in urban climatology studies since the beginning of the 20th century (Landsberg, 1981).
The ISO standard 7730 (ISO, 2005) defines thermal comfort as the state of mind that expresses satisfaction with the surrounding environment. Uncomfortable atmospheric conditions for humans such as prevalent extreme temperatures (heat/cold waves) may cause serious or even fatal health problems (chronic disorders, fatigue, headaches, mortality, etc.), decreases in work efficiency, and mental and psychological crises (Nastos and Matzarakis, 2011; Błażejczyk et al., 2018; Aboubakri et al., 2020). The concept bioclimatic comfort refers to optimum climatic conditions in which people are not warned against climate elements and feel comfortable (Toy, 2010). It can be stated that situations in which the human nervous system is not stimulated to balance body temperature, are accepted to be the conditions in which people are not thermally disturbed, that is, comfortable (Höppe, 1999; Laschewski and Jendritzky, 2002).
As reported in several previous studies (Unger, 1999; Robaa, 2003; Toy and Yılmaz, 2010; Çalışkan and Türkoğlu, 2014; Demircan and Toy, 2019), both bioclimatic comfort features and climatic conditions show differences between urbanized areas and their rural counterparts depending on some physical factors like city size (Oke, 1973), population and topography. Therefore, bioclimatic comfort conditions need to be investigated considering not only climatic elements but also the thermal characteristics of human body such as workload, clothing, psychological factors, etc.
Urban areas produce climatic changes due to their modified surface characteristics compared to rural and semi-rural areas. As the urban surfaces embrace varying artificial structures like buildings, asphalt-concrete roads, roofs, green areas and other elements, they reflect different thermal properties. Such characteristics also determine the general urban microclimate. Therefore, urban climates show differences between cities depending on their urban morphology (e.g., urban canyon, green infrastructure).
In the literature, urban thermal comfort conditions are evaluated generally associated with urban heat islands (UHIs) and their intensity from various parts of the world (Unger [1999] in Hungary; Robaa [2003] in Egypt; Demircan and Toy [2019] in Turkey, etc.). Such results are in similar ranges with those found in previous studies, e.g., in the hot and continental climate city of Szeged, Hungary, where the difference in the urban-rural physiological equivalent temperature (PET) index was found to be 2.9 ºC (Gulyas et al., 2010). In the same country, Hungary, in the city of Budapest, the mean yearly PET difference between urban and rural settings was determined to be 3.0 ºC (Kovacs and Nemeth, 2012). Blazejczyk et al. (2016) found a 4-5 ºC mean difference in the Universal Thermal Climate Index (UTCI) in Warsaw, Poland, between a densely built city part and an area covered with low-density buildings and higher vegetation. In a study in Turkey, the mean urban-rural PET difference in the city of Ankara was 2.2 ºC during the summer (Çalışkan and Türkoğlu, 2014). In Şanlıurfa, one of the hottest cities in Turkey, the yearly mean PET difference was found to be 2.1 ºC between urban and rural areas (Toy et al., 2018). Toy and Yılmaz (2010) found urban-rural comfortable range differences for the thermohygrometric index (THI) and the predicted mean vote (PMV) of 2.2 and 0.7%, respectively, in a small sized and unindustrialized city, Erzincan, Turkey,.
In urban environments, surfaces with increased heat storage capacity have adverse effects on human bioclimatic comfort conditions, recreation possibilities and human well-being by causing heat stress on individuals, especially during summer (Balık and Yüksel, 2014). However, recreational activities to be performed in livable urban environments with favorable bioclimatic comfort conditions have social, psychological and economic advantages in developing countries like Turkey (Toy and Yılmaz, 2009).
Tools that use spatial weather data in urban environment and that can assist decision makers in developing plans and strategies to minimize the negative impacts of urbanization on human thermal comfort have been developed and used to produce several useful products like maps for urban climate, thermal comfort conditions, air pollution, modeling and simulation maps (e.g., Envi-Met [Bruse, 2004] and RayMan [Matzarakis et al., 2007]). Spatial urban meteorological data obtained from real-time monitoring systems or modeled data based on the mentioned tools can help determine the spatial distribution of unfavorable conditions related to urban climate from a bioclimatic perspective, such as uncomfortable zones and areas prone to the UHI. Results of studies that use these methods and tools help authorities in planning the correct measures to cope with them (Yılmaz, 2013; Paramita and Matzarakis, 2019).
Cities, especially in developing countries like Turkey, face a rapid and deteriorating urbanization process in which natural land surfaces are turned into impervious ones. This undesired process produces urban areas with weak livability due to unfavorable and uncomfortable bioclimatic conditions. As mentioned above, all bioclimatic planning and modeling in urban environments have valuable results regarding more livable cities. As a developing country, Turkey has experienced a long-lasting urbanization process since the beginning of heavy industrialization attempts in the 1950s centered in large cities. This growth caused rural migration to urban settings as in other countries. The study area of this article, Eskişehir, started its industrialization and urbanization process in the 1930s, earlier than other Turkish cities. Public investments in Eskişehir aimed to develop manufacturing and railway industries (Gümüş, 2004), which in turn produced a rapid, unplanned and distorted urbanization process (Toy et al., 2019).
In the scope of this study, the bioclimatic comfort conditions of Eskişehir’s city center are analyzed considering the warm period of the year (from May to the end of September) in order to determine the comfortable and uncomfortable zones and periods using PET, a widely accepted thermal comfort index (VDI, 1998; Höppe, 1999; Matzarakis et al., 1999), and the RayMan calculation model (Matzarakis et al., 2007). The obtained PET values were mapped with the software package ArcGIS10.1 to show areas reflecting unfavorable bioclimatic comfort conditions, which allows to intervene and determine measures from the urban planning and geographical perspectives.
2. Materials and methods
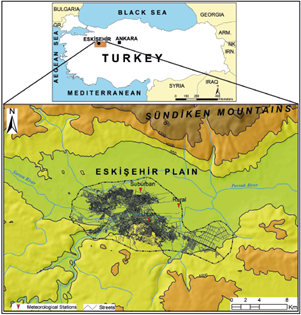
The study area is the city of Eskişehir, located on a plain (760-800 masl) in the Upper Sakarya subregion of Central Anatolia, Turkey (39º 49’-39º 43’ N, 30º 24’-30º 43’ E). The city is surrounded by the Sündiken mountains and high plateaus to the north. It is divided by the Porsuk stream, a branch of Sakarya river flowing from north to the south (Fig. 1).
The city center is comprised of two central districts (neighborhoods), Tepebaşı and Odunpazarı. Several industrial facilities, such as sugar, aircraft and automotive factories, as well as universities, are established in the city center. Since Eskişehir is located in an important road network junction, it has experienced a rapid industrialization and has received significant migration from its surroundings.
Continental climatic characteristics are prevalent in the city, with hot summers and dry, cold, snowy winters. The annual average temperature is 10.6 ºC (with extreme minimum of 27.8 ºC in January and extreme maximum of 40.6 ºC in July). Annual rainfall is 307.2 mm and relative humidity is 65%. The average annual wind speed is 3.1 m s-1 and the prevalent wind direction is SW (Table I).
Table I Long-term means of some climatic parameters (1975-2018).
| Eskişehir | Jan | Feb | Mar | Apr | May | June | July | Aug | Sep | Oct | Nov | Dec | Mean |
| Mean temperature (°C) | 0.5 | 0.7 | 4.6 | 9.7 | 14.7 | 18.9 | 21.8 | 21.5 | 16.7 | 11.7 | 5.7 | 1.4 | 10.6 |
| Mean maximum temperature (°C) | 3.7 | 6.0 | 11.3 | 16.6 | 21.8 | 26.0 | 29.1 | 29.2 | 25.0 | 19.8 | 12.4 | 5.5 | 17.2 |
| Mean minimum temperature (°C) | -4.2 | -4.0 | -1.4 | 2.9 | 6.9 | 10.4 | 13.1 | 13.1 | 8.4 | 4.6 | 0.2 | -2.2 | 4.0 |
| Mean sunshine duration (h) | 2.4 | 3.5 | 5.2 | 6.2 | 8.4 | 10.2 | 11.1 | 10.4 | 8.4 | 6.1 | 4.2 | 2.1 | 6.4 |
| Mean number of rainy days | 11.6 | 11.6 | 11.2 | 11.3 | 9.5 | 6.0 | 3.8 | 3.3 | 4.4 | 8.1 | 9.3 | 12.4 | 8.5 |
| Mean monthly rainfall (kg m-2) | 27.9 | 23.5 | 26.1 | 42.0 | 37.4 | 20.7 | 13.4 | 9.4 | 16.3 | 26.8 | 29.6 | 34.1 | 307.2 (Total) |
| Extremely high temperature (°C) | 18.2 | 20.5 | 28.1 | 30.8 | 33.3 | 36.4 | 40.6 | 39 | 36.4 | 33.0 | 25.4 | 21.4 | 30.3 |
| Extremely low temperature (°C) | -27.8 | -22..4 | -12.0 | -10.4 | -2.2 | 0.5 | 5.0 | 5.4 | -2.0 | -6.8 | -12.2 | -19.2 | -8.7 |
| Mean wind speed (m s-1) | 3.0 | 3.2 | 3.3 | 3.1 | 3.3 | 3.7 | 3.4 | 2.8 | 2.4 | 2.7 | 2.7 | 3.1 | 3.1 |
| Prevalent wind direction | WSW | S | WSW | SW | NNW | WNW | W | NW | W | W | ESE | SW | SW |
| Mean relative humidity (%) | 77 | 73 | 66 | 63 | 62 | 57 | 53 | 55 | 60 | 66 | 71 | 78 | 65.0 |
Source: Turkish State Meteorological Service.
Hourly and daily meteorological data were obtained over a 12-year observation period (2007-2018) to precisely evaluate bioclimatic comfort values, from three meteorology stations located in (1) the Eskişehir Regional Meteorology Administration, representing a densely structured urban area (U), (2) Anadolu University campus, representing a suburban area (SU), and (3) Eskişehir airport, representing an open rural area (R). Table II presents the features of the meteorological measurement stations.
Table II Meteorological stations used in this study.
| Represented area | Location | Altitude (masl) | Surface |
| U | 39º 45’ 56.2’’ E, 30º 33’ 00.7’’ N | 801 | Densely structured |
| SU | 39º 48’ 29.9’’ E, 30º 31’ 55.2’’ N | 786 | Loosely structured |
| R | 39º 46’ 51.6’’ E, 30º 34’ 46.9’’ N | 787 | Not structured |
Twelve-years hourly data of 153 days, covering the summer period, were used in this study. Meteorological data used were air temperature (Ta [ºC]), relative humidity (RH [%]), wind velocity (Wv [m/s]), and cloudiness (octas; x 10-1).
In this study, the worldwide PET index (VDI, 1998; Höppe, 1999; Matzarakis et al., 1999) and the RayMan radiation model (Matzarakis et al., 2007), were used to calculate bioclimatic comfort values. PET considers not only the combined effects of climatic parameters on individuals but also factors related directly to human body, like physical activity, clothes and physical features like age, weight and length as coefficients. In this respect, human bioclimatic comfort conditions were calculated considering coefficients according to a 35 year-old man with a height of 175 cm and a weight of 75 kg under a clothing insulation of 0.9 clo and activity load of 80 W (Matzarakis and Mayer, 1996; Matzarakis et al., 1999).
Bioclimatic comfort intervals given in Table III were used in order to divide the calculated PET values into categories according to the predetermined thermal sensation and stress levels. Distribution of the calculated hourly PET values was determined considering nine ranges from very cold through comfortable to very hot in all temporal and spatial analyses in the area.
Table III Human thermal sensation and stress ranges of PET (Matzarakis et al. 1999; Höppe, 1999).
| PET (ºC) | Thermal sensation | Level of thermal stress |
| < 4 | Very cold | Extreme cold stress |
| 4.1-8 | Cold | Strong cold stress |
| 8.1-13 | Cool | Moderate cold stress |
| 13.1-18 | Slightly cool | Slight cold stress |
| 18.1-23 | Neutral (comfortable) | No thermal stress |
| 23.1-29 | Slightly warm | Slight heat stress |
| 29.1-35 | Warm | Moderate heat stress |
| 35.1-41 | Hot | Strong heat stress |
| > 41 | Very hot | Extreme heat stress |
PET: physiological equivalent temperature.
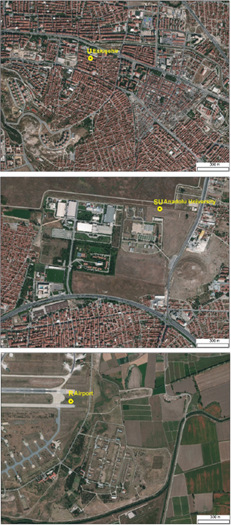
Spatial distribution of the calculated hourly PET values was dtermined using the 10-day averages and categories mentioned above with ArcGIS 10.1 software. Elevation data and land use characteristics (e.g., open green spaces, impervious surfaces, roofs which show different radiation properties) of the study area were included in the spatial analysis in the software. PET, elevation and land use data were overlapped in raster form. Points where data representing U, SU and R surface characteristics were obtained. U represents densely structured neighborhoods with 5-6 story buildings, while SU is a university campus in loosely structured open space and R is an airport base with very few buildings near the measurement point (Fig. 2).
3. Results
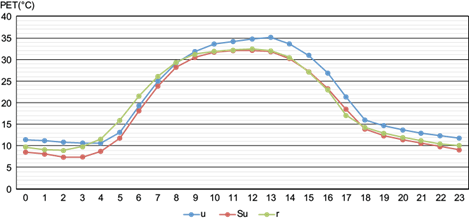
Distribution of hourly and daily mean, maximum, minimum and extreme PET values during the whole study period (153 days) according to time of the day and areas (i.e., U, SU and R) is given in Table IV and Figure 3. It can be seen from the table that 12-year mean PET values are 21.0 ºC (35.0 to 10.6 ºC), 19.6 ºC (32.4 to 9.0 ºC) and 18.6 ºC (32.0 to 7.3 ºC) in U, SU and R, respectively. There is a 1.4, 2.4 and 1.0 ºC mean PET difference between U and SU, U and R, and SU and R, respectively. Mean maximum PET values are 33.5 ºC (52.5 to 18.2 ºC) 34.1 ºC (50.3 to 17.6 ºC) and 30.5 ºC (47.8 to 17.2 ºC), while mean minimum PET values are 6.5 ºC (15.7 to 0.2 ºC), 4.4 ºC (13.2 to -3.5 ºC) and 3.5 ºC (11.1 to -3.9 ºC) in U, SU and R, respectively, over the whole study period. There is a -0.6, 3.0 and 3.6 ºC maximum PET difference and a 2.1, 3.0 and 0.9 ºC minimum PET difference between U and SU, U and R, and SU and R, respectively.
Table IV Distribution of hourly mean PET values over the whole study period.
| PET (°C) | Hours | 0 | 1 | 2 | 3 | 4 | 5 | 6 | 7 | 8 | 9 | 10 | 11 | 12 | 13 | 14 | 15 | 16 | 17 | 18 | 19 | 20 | 21 | 22 | 23 |
| Locations | U | 11.5c | 11.2c | 10.8c | 10.6c | 10.6c | 13.1d | 19.1e | 24.9f | 29.1g | 31.9g | 33.6g | 34.1g | 34.6g | 35.0g | 33.6g | 30.8g | 26.9f | 21.2e | 16.0d | 14.7d | 13.8d | 12.9c | 12.3c | 11.8c |
| SU | 8.5c | 8.1c | 7.5b | 7.3b | 8.6c | 11.8c | 18.1e | 23.9f | 28.2f | 30.5g | 31.7g | 31.9g | 32.0g | 31.8g | 30.1g | 27.2f | 23.3f | 18.4e | 13.9d | 12.4c | 11.4c | 10.6c | 9.8c | 9.2c | |
| R | 9.6c | 9.2c | 9.0c | 9.8c | 11.6c | 16.0d | 21.5e | 26.1f | 29.4g | 31.2g | 31.9g | 32.3g | 32.4g | 32.0g | 30.5g | 27.1f | 22.8e | 17.1d | 14.2d | 13.0c | 12.0c | 11.2c | 10.4c | 10.0c | |
| U | SU | R | U-SU | U-R | SU-R | ||||||||||||||||||||
| Hourly | H | M | L | H | M | L | H | M | L | H | M | L | H | M | L | H | M | L | |||||||
| Mean | 35.0g | 21.0e | 10.6c | 32.4g | 19.6e | 9.0c | 32.0g | 18.6e | 7.3b | 2.6 | 1.4 | 1.6 | 3.0 | 2.4 | 3.3 | 0.4 | 1.0 | 1.7 | |||||||
| Max. | 52.5a | 33.5g | 18.2e | 50.3a | 34.1g | 17.6d | 47.8a | 30.5g | 17.2d | 2.2 | -0.6 | 0.6 | 4.7 | 3.0 | 1.0 | 2.5 | 3.6 | 0.4 | |||||||
| Min. | 15.7d | 6.5b | 0.2a | 13.2d | 4.4b | -3.5a | 11.1 | 3.5a | -3.9a | 2.5 | 2.1 | 3.7 | 4.6 | 3.0 | 4.1 | 2.1 | 0.9 | 0.4 | |||||||
aExtreme cold stress, strong heat stress, extreme heat stress (< 4 °C; 35.1-41 °C; > 41 °C); bstrong cold stress (4.1-8 °C); cmoderate cold stress (8.1-13 °C); dlight cold stress (13.1-18 °C); eno thermal stress (18.1-23 °C); fslight heat stress (23.1-29 °C); gmoderate heat stress (29.1-35 °C).
U: urban; SU: suburban; R: rural; H: highest; M: mean; L: lowest.
In all areas, the comfortable time interval is 1 h in the morning at 6.00 LT and 1 h in the evening at 17:00 LT in U and SU, and at 16:00 LT in R. Moderate and slight cold stress is prevalent from 18:00 LT (17.00 LT in rural areas ) to 5.00 LT. R is less exposed to heat stress (1 h less than other areas). The largest heat stress is seen in U, but the severity of heat stress is 2 h less in SU than U.
The largest difference in mean PET values is seen between U and R, as expected. Between areas, differences in mean PET values are smaller than those in the averages of maximum and minimum PET values. In terms of maximum PET values, SU represents warmer characteristics than U; however, in mean and minimum PET values U is the warmest area, which is consistent with the results of previous studies.
It is clearly understood from Figure 3 that U shows the highest PET values during the early morning (09:00-03:00 LT), as R shows a rapid temperature increase after sunrise, while SU reflects a similar trend in the afternoon.
Table V shows the hourly distribution of comfort ranges throughout the day in the evaluated period. It is seen that the area where the largest number of comfortable hours is seen is U with 431 h (of 3672 h in the hot period; 11.7%), the smallest number of comfortable hours is seen in R with 356 h (9.7%), while comfortable hours in SU amount to 10.8%. U has 0.9% more comfortable hours than SU and 2% more than R, while SU has 1.1% more comfortable hours than R (TableV).
Table V Distribution of comfort ranges in hours and percentage.
| Comfort Ranges | < 4 | 4.1-8.0 | 8.1-13.0 | 13.1-18.0 | 18.1-23.0 | 23.1-29.0 | 29.1-35.0 | 35.1-41.0 | > 41.0 | |||||||||
|---|---|---|---|---|---|---|---|---|---|---|---|---|---|---|---|---|---|---|
| Very cold | Cold | Cool | Slightly cool | Comfortable | Slightly warm | Warm | Hot | Very hot | ||||||||||
| A | B | A | B | A | B | A | B | A | B | A | B | A | B | A | B | A | B | |
| U | 63 | 1.7 | 239 | 6.9 | 760 | 20.7 | 763 | 20.8 | 431 | 11.7 | 422 | 11.5 | 463 | 12.6 | 386 | 10.5 | 145 | 3.9 |
| SU | 117 | 3.2 | 344 | 9.4 | 828 | 22.5 | 682 | 18.6 | 396 | 10.8 | 446 | 12.1 | 450 | 12.3 | 275 | 7.5 | 134 | 3.6 |
| R | 176 | 4.8 | 466 | 12.7 | 848 | 23.1 | 588 | 16 | 356 | 9.7 | 429 | 11.7 | 426 | 11.6 | 292 | 8 | 91 | 2.5 |
| Cold stress total (h; %) | Heat stress total (h; %) | |||||||||||||||||
| U | 1825 | 49.7 | 1416 | 38,5 | ||||||||||||||
| SU | 1971 | 53.7 | 1305 | 35.5 | ||||||||||||||
| R | 2078 | 56.6 | 1238 | 33.8 | ||||||||||||||
| U-SU | -1.5 | -2.9 | -1.8 | 2.2 | 0.9 | -0.6 | 0.3 | 3 | 0.3 | |||||||||
| U-R | -3.1 | -6.2 | -2.4 | 4.8 | 2 | -0.2 | 1 | 2.5 | 1.4 | |||||||||
| SU-R | -1.6 | -3.3 | -0.6 | 2.6 | 1.1 | 0.4 | 0.7 | -0.5 | 1.1 | |||||||||
A: total hours; B: percentage of hours.
Figure 4 shows the hourly distribution of PET values in U over the whole study period. It is seen that cold and cool ranges (cold stress) are perceived from 19:00 to 04:00 LT (10 h) and between 09:00 and 16:00 LT (8 h) warm and hot ranges (heat stress) are dominant. The comfortable range spans only between 05:00 and 08:00 LT and 17:00 and 18:00 LT (6 h).
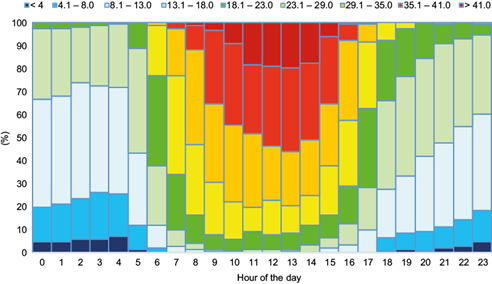
Figure 5 shows the hourly distribution of PET values in the SU over the whole study period. Cool and cold ranges (cold stress) are dominant between 19:00 and 05:00 LT (11 h), while warm and hot ranges (heat stress) are seen between 10:00 and 15:00 LT (6 h) and comfortable conditions prevail between 06:00 and 09:00 and 16:00 and 18:00 LT (7 h).
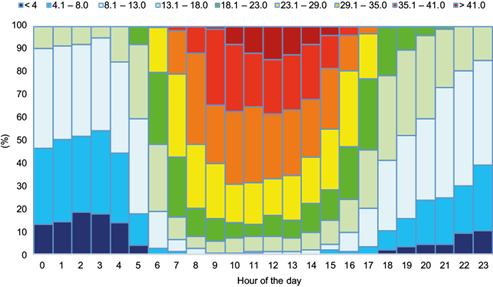
Figure 6 shows the hourly distribution of PET values in the rural area throughout the study period. Cool and cold ranges (cold stress) are seen between 18:00 and 04:00 LT (11 h) while warm and hot ranges (heat stress) are seen between 10:00 and 14:00 LT (4 h) and comfortable conditions are prevalent between 05:00 and 10:00 and 15:00 and 17:00 LT (9 h). Daily PET values were mapped at 10-day intervals to detect their spatial distribution in the city center according to the stations. It can be seen in this figure that slightly cool conditions are perceived in the whole study area when the spatial distribution of average daily PET values from day 130 to 150 day are considered. On day 160, 55.8% of the study area is in comfortable range, 44.2% is under the effect of slightly cool conditions, comfortable conditions are observed in the urban area. On day 170, 11.3% of the study area is in comfortable range and 88.7% is under the effect of slightly cool range. Comfortable conditions are determined to be prevalent in the areas covered by dense buildings and narrow streets in the city. This is because in the first and last months of the study period during nighttime and some hours of daytime, air temperature is lower in suburban and rural areas but higher in urban areas due to the UHI effect, which causes longer hours of calculated comfortable range. On the day 180, while slightly warm conditions (heat stress) are seen in densely built urban areas (3.5%), comfortable conditions are prevalent in the vast majority of the area (96.5%). Slightly warm conditions were determined in urban areas (32.8% of the whole study area) on day 190. Comfortable conditions were determined in 67.2% of the study area, covering rural and suburban areas. On day 200, a slightly warm stress was determined in the majority of urban and suburban areas and (60.6% of the study area). Comfortable conditions were perceived in rural areas and (39.4% of the study area). On days 210 and 220, a slightly warm stress was detected in the whole area. On day 230, a slightly warm stress was observed in the urban area, which accounts for 57.6% of the whole area. Comfortable conditions were experienced in the remaining 42.4% of the study area, corresponding to rural environments. On day 240, comfortable conditions were perceived throughout the whole area and on day 250 comfortable conditions were observed in urban and suburban areas. Comfortable conditions were detected in 61.7% of the area on day 250, while a slight cool stress was detected in the remaining 38.3% (rural settings). On day 260, a slight warm stress was experienced in the urban area (24.5% of the whole study area). Comfortable conditions were observed in 75.5% of the study area (suburban and rural). While the urban and suburban areas were comfortable on day 270, a slight cool stress was determined in the rural area (Fig. 7).
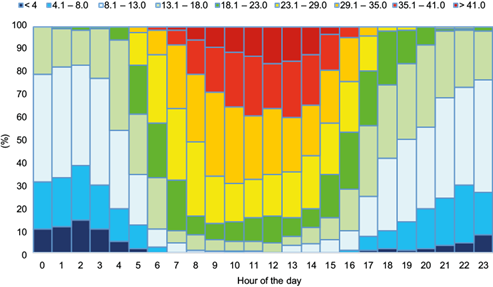

Figure 8 exhibits the spatial distribution of mean daily maximum PET values. It is seen that slightly warm stress was experienced across the study area on day 130 while comfortable conditions were prevalent in 70.9% of the area and slight warm stress in the rest. While a slightly warm stress was observed in the urban area, comfortable conditions were found in suburban and rural areas. It can be inferred from this result that due to the effect of urban morphology and surface, the urban area gets warmer earlier than the rest and remains calmer (less windy), which reflects on bioclimatic comfort values. On day 150, a slightly warm range is prevalent in the whole area, while a warm range is prevalent on day 160. On day 170, 62.2% of the area experienced warm stress and 37.8% was under the effect of slightly warm stress. On day 170, warm stress was observed in urban and suburban areas, while slightly warm stress was observed in the rural area. From day 180 to 230, hot stress was observed throughout the study area. On day 240, 22.8% of the area consisting of dense urban areas experienced hot stress. In areas covering rural and suburban areas (77.2%), a warm stress was observed. On day 250, warm stress was determined in 95.4% of the area, and hot stress in dense built areas (4.6%). On day 260, heat stress was experienced in the whole area. On day 270, 33.5% of the area revealed hot stress and 76.5% warm stress. Hot stress was determined in densely built areas and warm stress in suburban and rural areas. PET values calculated for urban, suburban and rural areas fell into different comfort ranges on days 160, 170, 180, 190, 200, 230, 250, 260 and 270. The density of the built surface (ratio of empty spaces), urban texture (type and height of buildings and orientation and width of streets) and the characteristics of surface covers are expected to be the effective features on the spatial differences of PET values. Compared to rural areas, urban PET values fall into the next warmer comfort range on all days mentioned above while PET values for suburban are sometimes in the same range than urban and rural. As stated by Grimmond (2007), this condition of urban areas is related to their larger surface due to 3-D geometry of buildings, causing greater rate of solar radiation absorption, higher heat storage capacity of surface materials, smaller rate of heat loss through air movement (canyon geometry), larger impervious surface areas, lower evapotranspiration, and higher additional energy supply from combustion of fossil fuels and electricity.
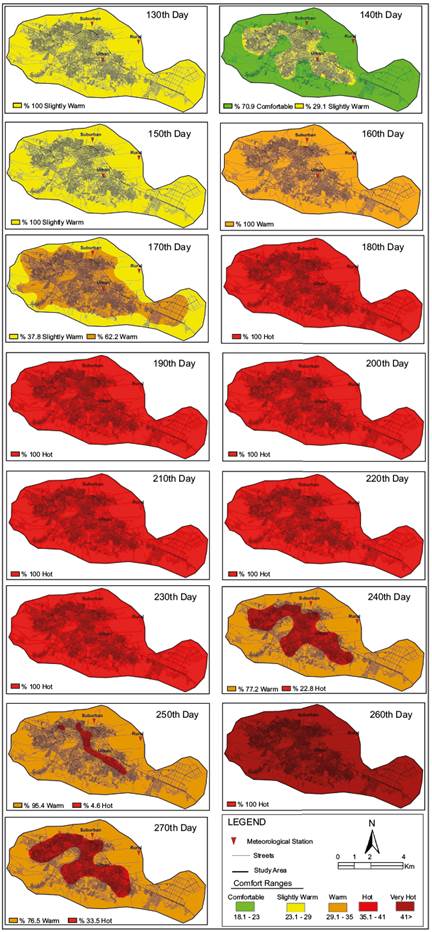
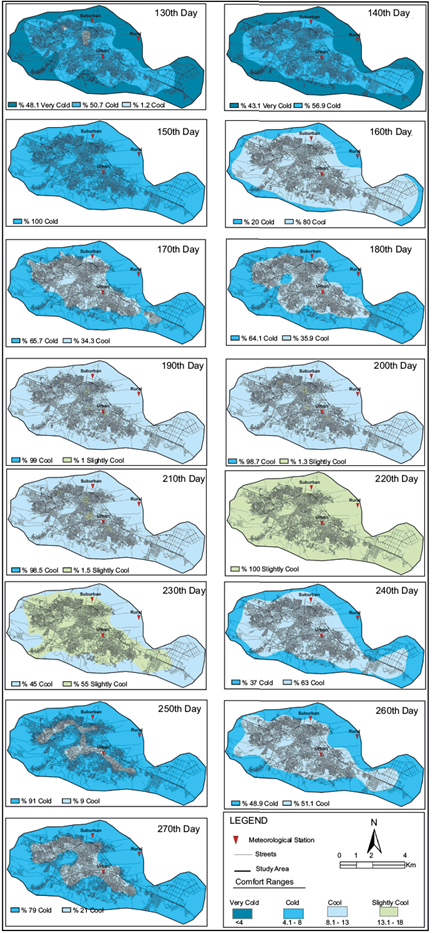
Figure 9 shows the spatial distribution of mean daily minimum PET values. It is seen that on day 130, the rural area (48.1% of the study area) was under very cold stress, urban and suburban areas (50.7%) were under cold stress, and a portion of the urban area (1.2%) was under the effect of a cool range. On day 140, 43.1% of the area was under the effect of very cold stress and 56.9% under cold stress. Very cold stress was observed in rural areas and cold stress was observed in urban and suburban areas. On day 150, cold stress was determined throughout the study area. On day 160, 20 and 80% of the study area experienced cold stress and cool, respectively, and on day 170, 65.7% of the area (rural) was under the effect of cold and 34.3% (suburban and urban) experienced a cool range. On day 180, a cool range was observed in urban areas (35.9% of the study area), and cold stress was felt in suburban and rural areas (64.1%). From day 190 to 210, the vast majority of the study area experienced cool and slightly cool ranges in dense building areas. On day 190, the slightly cool area corresponded to 1% of the study area, whilst this percentage was 1.3% on day 200 and 1.5% on day 210. On day 220, a slightly cool range was experienced in the study area. On day 230, 55% of the study area (urban and suburban) faced a slightly cool range, while 45% (rural) experienced a cool range. On day 240, 37% of the study area is under the effect of a cold range and 63% is under a cool range, while on day 250, 91.0% of the area is under a cold range and 9.0% under a cool range. On day 260, 48.9% of the area was under a cold stress and 51.1% faced a cool range, while on day 270, 79% of the area was under a cold stress and in 21% the cool range was dominant. From day 240 to 270, rural areas were under a cold stress. Suburban areas were under the effect of a cool range on day 240 and a cool range was observed on other days in urban areas.
Regarding the spatial distribution of mean PET values, the whole study area was under the same range on days 130, 140, and 150 (slightly cool), on days 210 and 220 (slightly warm), and on day 250 (comfortable). PET values were higher in urban areas on day 170 (comfortable), and days 180, 190 and 260 (slightly warm). As for urban and suburban areas, PET values were higher (comfortable) on days 160, 250, and 260, as well as on days 200 and 230 (slightly warm) in urban and suburban areas. As for the distribution of the average daily maximum PET values, the whole study area was under the same range on days 130, 150 (slightly warm) and 160 (warm), from days 180 to 230 (hot), and on day 260 (very hot). Day 140 was slightly warm and on days 240, 250 and 270 hot ranges were prevalent in urban areas, while on day 170 a warm range was prevalent in urban and suburban areas. Mean maximum daily PET values were prevalent in the area throughout the period showing warm ranges. With respect to the distribution of daily mean minimum PET values, on days 150 (cold) and 220 day (slightly cool), the whole study area was under the effect of the same PET range. On days 130, 250 days (cool) and 190, 200, 210 (slightly cool), urban areas showed the highest PET values in densely built areas with narrow streets. The lowest mean minimum PET values in urban areas were prevalent on days 180 and 270 (cool), 140 (cold), 160, 170, 240 and 260 (cool), and 230 (slightly cool) in urban and suburban areas.
4. Discussion and conclusions
Anthropogenic factors, mainly industrialization and concurrent urbanization cause cities to have unique climatic characteristics. In densely structured and industrial cities, both altered land use types and industrial and traffic combustion impact atmospheric features and thus climatic elements of the cities. Surface covers in urban areas, such as impervious surface of roads and roofs have different radiative, thermal and hydraulic properties than bare rock, soil, vegetation and water, their pre-existing counterparts; this causes urban environment to get warmer at a considerably higher rate by storing a larger amount of solar radiation and heat, and losing a smaller rate of energy.
From this point of view, every city should be analyzed on a micro scale basis and suggestions should be developed based on this type of evaluation. Turkey offers diversity in climatic characteristics even in short distances, mainly due to different topographic features. This study is significant in the literature since it deals with a middle size Turkish city, Eskişehir, in the Anatolia Region, where continental climatic features isolated from marine effects are prevalent. The city was industrialized and rapidly urbanized in the past, but over the last 2-3 decades industrial plants have been removed and some favorable urban development attempts have been made to increase the livability of the city center. The study conducted a detailed bioclimatic comfort analysis to determine the effect of a structured city center on thermal conditions by comparing it with suburban and rural counterparts. The results reveal that PET values in the city of Eskişehir are higher in urban areas than those determined in suburban and rural settings. Based on the mean PET values of 153 summer days, PET differences of 1.4, 2.4C and 1.0 ºC were found between urban and suburban, urban and rural, and suburban and rural areas, respectively. As can be seen from the mean differences, urban areas still maintain its impact on thermal conditions, even though the city lost the majority of industrial facilities. This effect is directly related to the UHI effect, which includes the impact of surface characteristics, traffic load and other heat sources. The differences are within the ranges found in literature.
This study shows that the city center is warmer than its surroundings regarding hourly maximum and minimum PET values and also spatial distributions. The suburban area shows some advantages over urban and rural areas; however, it indicates a changing bioclimatic condition closer to that prevalent in suburban areas. This study also highlights how extreme conditions affect the spatial distribution of bioclimatic features, which give clues to decision makers on a spatial basis to deal with the negative impacts caused by unplanned spatial developments. From this point of view, the study clearly shows the UHI effect in urban areas over the whole period. Land-use change is seen to be especially impactful in the study area regarding the bioclimatic characteristics, in addition to traffic density and manufacturing activities. The city has experienced a planned physical development process over the last years in order to increase the vegetation cover and water surface by reorganizing a riverbank and designing green infrastructure. However, even under such conditions, in the torrid summer period these efforts do not seem to be efficient for obtaining comfortable conditions in the city center.
More severe measures should be taken considering spatial planning and design principles to moderate the thermal effects during the summer and to increase the length of the comfortable period. Taking into account the prevalent wind direction to expand the cooling effect of water surface (already in use) to wider areas, restricting impervious surfaces, encouraging the use of public transport (already in use), and increasing the rate of green areas per capita, should be among the suggestions for the city center. The most important conclusion from the study may be that even if industrial structures have been removed from a city, it should have efficient urban systems ranging from green structures to water surfaces, public transport to motor-vehicle roads, to mitigate the effects of UHI-related human thermal discomfort.

