


 nueva página del texto (beta)
 Inglés (pdf)
 Artículo en XML
 Referencias del artículo
 Enviar artículo por email
 Citado por SciELO
  Similares en
SciELO
Similares en
SciELO 
 Permalink
1. Introduction
1.1 Radiosonde and need of real time profiling
Information about the vertical atmospheric profile plays an important role in weather prediction. Radiosondes have been some of the most reliable means of retrieving these profiles. It is common practice to examine the temperature and humidity profiles measured by radiosonde and its derived thermodynamic indices/parameters in nowcasting convective weather events. Meteorologists have estimated the wind gust based on temperature, humidity and wind measurements (Lee, 2007). However, radiosonde profiles are discrete in nature and are available twice a day in general. On the other hand, weather instances are due to continuous changes in the atmosphere and these changes are more dynamic in pre-monsoon season, especially in tropical region. This necessitates the use of an equipment capable of continuous profiling to support nowcasting. MWR provides vertical profile of the atmosphere high temporal resolution. The ground-based microwave radiometer (MWR) is a passive sensor that provides continuous atmospheric profile from surface to 10 km. It measures the radiation intensity at different frequencies in the microwave spectrum, which are dominated by the absorption/emission of atmospheric water vapor, cloud liquid water and oxygen (Rose et al., 2003).
1.2 Earlier studies using MWR
As per Leena et al. (2015), analysis of MWR-measured temperature (specific humidity) has a warm (wet) bias below 3 km and cold (dry) bias above that altitude. However, correlation of stability indices estimated from radiometers and radiosondes showed fairly good correlation, with a correlation coefficient greater than 0.5 with 95% significance. Madineni et al. (2013) studied MWR profile over Indian region and depicted that MWR observations show warm (cold) bias in the temperature, except at 0.5 km, when compared to radiosonde observations below (above) 3-4 km, assuming latter as a standard technique. In case of water vapor, MWR observations show wet (dry) bias below (above) 2-3 km depending on the time. Venkat et al. (2013) reported warm (cold) bias in temperature below (above) a 3-4 km height when compared with radiosonde measurements. They also noticed a wet (dry) bias in specific humidity for 6-8 g kg-1 below (above) 2-3 km. Chan (2009) brought out that MWR does not cater for the scattering effects of rain in the given frequency and hence it must be used with caution during the actual occurrence of precipitation.
1.3 MWR in the Indian Air Force
The Indian Air Force (IAF) is in possession of 21 MWRs evenly distributed across the country. These are MP-3000A series passive radiometers, which provide continuous thermodynamic profile of the planetary boundary layer (PBL) and above up to 10 km. The equipment measures brightness temperature in both water vapor and oxygen bands and produces atmospheric sounding similar to that of radiosonde every minute. The system scans 21 K-band frequencies (22-30 GHz) and 14 V-band frequencies (50-59 GHz), which are dominated by absorption of water vapor and oxygen molecules, respectively. Retrievals are broadly classified into two domains, i.e., zenith and off-zenith (20º) to mitigate heavy precipitation. The intensities thus received are converted to temperature and moisture profiles by applying the Radiative Transfer Equation (RTE), historical soundings of nearby station and artificial neural network.
1.4 Nowcasting with MWR
In the field of aviation, thunderstorms and dense fog are considered as most dangerous aviation weather hazards. Historically, very short-range forecasting of convective weather incidents were based on the extrapolation of radar reflectivity echo. However, the accuracy of these predictions decreases very rapidly in first 30 min because of short life span of convective cells. For forecasts periods beyond 20 min, techniques for predicting the initiation, growth and dissipation of convective storms are essential (Hering et al., 2004). Similarly, significant changes occurring within the PBL are most important to be trapped to predict the occurrence or dissipation of dense fog. MWR has the advantage of continuous monitoring of atmosphere and can play an important role in nowcasting these events. A comprehensive study by Chan (2009) discussed the importance of MWR profile in nowcasting of intense convective weather over Hong Kong. Later (Chan, 2009), he elaborated the importance of MWR derived indices and their usage in nowcasting by correlating derived variables with the lightning activity. Madhulatha et al. (2013) presented the superepoch analysis to bring out the changes in various thermodynamics indices in pre-convective environment.
1.5 Thermodynamic indices of MWR and radiosonde
Thermodynamic indices are considered as predictors for forecasting aviation weather hazards. The thresholds values of indices calculated from radiosonde observations may not be the same as calculated with the MWR profiles, as both equipments have different working principles. MWR data is to be validated against the nearest radiosonde profile to understand the degree of variation. This paper presents validation of profiles of the MWR installed at Palam, New Delhi, India, vis-à-vis the nearest radiosonde station of India Meteorological Department (IMD) at Safdarjung, New Delhi. Efforts have also been made to study the correlation between the various thermodynamic indices generated by MWR and radiosonde data sets. These indices have been studied further on the temporal scale to bring out the usage of MWR in nowcasting thunderstorm and fog events over Delhi.
2. Instrumentation and methodology
2.1 Instrumentation over the area of experimentation
2.1.1 Palam radiometer
The radiometer installed at Palam (28.5º N, 77.1º E, 237 masl), Delhi measures radiation intensity at water vapor (22-30 GHz) and oxygen channel (50-59 GHz) to obtain the temperature and humidity profile. MWR generates profiles every 2 min with 50 m vertical resolution up to 0.5 km, 100 m resolution from 0.5 to 2 km and 250 m resolution from 2 to 10 km. A total of three retrievals are available for a given time period, i.e., one zenith and two off-zeniths on either side at a 20º angle. An average of all the three profiles for each time frame is also made available to the users. However, for the present study only the zenith scan has been utilized. Retrieval of temperature and humidity profiles from radiation intensity is done by applying RTE and artificial neural networks to historical sounding data. The accuracy of temperature and RH sensor of MP-3000A series radiometer is claimed to be 0.5 ºK and 2%, respectively, which is at par with radiosonde observations.
2.1.2 India Meteorological Department radiosonde
Radiosonde data of the nearest India IMD observation station, Safdarjung (28.5º N, 77.2º E, 216 masl, Delhi, is used as the base profile to carry out the comparative study. The observations are available twice (00:00 and 12:00 UTC) daily. Both the profiles have been studied separately in this paper for eight cases of thunderstorm and three cases of dense fog events over Delhi. Occurrence, cessation and variation in the intensity of weather events were studied through half hourly aerodrome routine meteorological reports (METAR). Convective events were further substantiated by a Lightning Detection System (LDS) of IAF, a Doppler Weather Radar (DWR) at the Indira Gandhi International Airport (IGI), Delhi and INSAT-3D IR1 images of the relevant time period. Various cases of the significant weather events considered in the present study are shown in Table I.
Table I Cases of occurrence of thunderstorms and fog.
| No. | Type of event | Date |
| 1 | Thunderstorm | 07 May 2018 |
| 2 | Thunderstorm | 27 Jun 2018 |
| 3 | Thunderstorm | 22 Jul 2018 |
| 4 | Thunderstorm | 26 Jul 2018 |
| 5 | Thunderstorm | 06 Sep 2018 |
| 6 | Thunderstorm | 08 Sep 2018 |
| 7 | Thunderstorm | 22 Jan 2019 |
| 8 | Thunderstorm | 07 Feb 2019 |
| 9 | Fog | 01 Jan 2018 |
| 10 | Fog | 06 Jan 2018 |
| 11 | Fog | 29 Jan 2018 |
2.2 Methodology
In the first part of this study, validation of MWR data is undertaken with the nearest radiosonde profile. Thereafter, a total of nine parameters were studied to bring out the correlation between both the derived profiles: K-Index (KI, in ºC); Total Totals Index (TTI, in ºC); Vertical Total Totals Index (VTT, in ºC); Cross Total Totals Index (CTT, in ºC); MEAN_RH (950-700 hPa, in %); RH at freezing level (FL, in %); TEMP_DIFF (950-700 hPa, in ºC); TEMP_DIFF (700-400 hPa, in ºC), and TEMP_DIFF (400- 300 hPa, in ºC). P value for each set of indices has been calculated using t-test to bring out the probability of variation between datasets.
KI is a measure of thunderstorm potential based on the vertical temperature lapse rate, and the amount and vertical extent of low-level moisture in the atmosphere, calculated as KI = T(850 hPa) + Td(850 hPa) - T(500 hPa) - DD(700 hPa) × VTT, represents static stability or the lapse rate between 850 and 500 hPa, calculated as VTT = T(850 hPa) - T(500 hPa). Whereas CTT includes the 850 hPa dewpoint and is represented as CT =Td(850 hPa) - T(500 hPa). The Total Totals Index consists of two components, vertical totals (VTT) and cross totals (CTT). As a result, TTI accounts for both static stability and 850 mb moisture but would be unrepresentative in situations where the low-level moisture resides below the 850 mb level. TTI can be calculated as TTI = VTT + CTT. Mean RH between 950-700 hPa and at freezing level (RH_FL), along-with temperature differences at three distinct levels, was calculated to derive the moisture availability and lapse rate in the atmosphere. Last part of the study deals with plotting and studying the temporal variation of stability indices in pre-convective environment. The superepoch analysis is carried out with the aim to comment upon the utility of these indices in nowcasting thunderstorm and dense fog events over Delhi.
3. Results and discussion
3.1 Validation of MWR profile using radiosonde data
3.1.1 Comparison of 00:00 and 12:00 UTC profiles
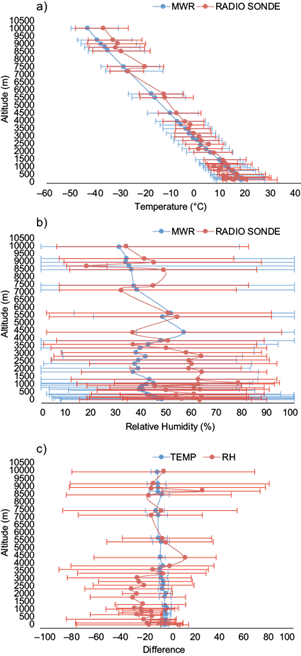
Temperature and RH profiles of MWR and nearest radiosonde (Safdarjung, Delhi) observations have been compared for all the 11 cases. Mean profiles of the MWR zenith scan for 00:00 and 12:00 UTC and radiosonde are shown in Figures 1 and 2, respectively, where the Y-axis depicts altitude of the comparison in meters above mean sea level. Temperature profiles for both 00:00 and 12:00 UTC represent the close match up to 3.5 km (Figs. 1a and 2a). However, temperature has a variation of 1-2 ºC (RS-based temperatures are higher as compared to MWR) at middle and upper levels as shown in the difference profile of Figures 1c and 2c. MWR profiles show a cold bias above 3.5 km and the trend remains the same with variations in quantity at various levels. Contrast in the RH profile was found to be large at different levels for both 00.00 and 12:00 UTC (Figs. 1b and 2b). Deviation is even larger at lower levels, i.e., below 3.5 km. Figures 1c and 2c depict the difference plot of RH. It clearly shows the presence of a dry bias in the range of 30-50% up to 3.5 km, and thereafter a wet bias of 20-30% at higher levels. The variations in RH were found to be higher (about 10-15%) for the morning profiles.
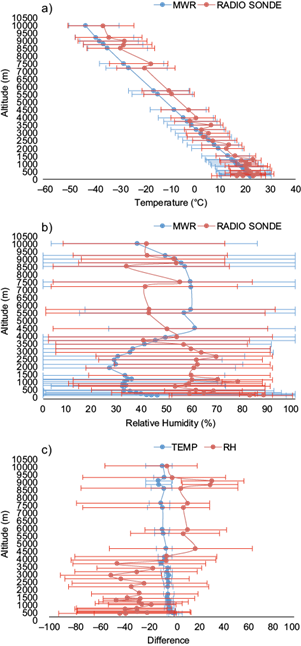
Fig. 1 00:00 UTC composite profiles along with standard deviation observed for all cases under study. (a) Temperature). (b) Relative humidity (%). (c) Differences between radiosonde and MWR temperatures (blue line) and relative humidity (red line).
3.1.2 Variations in MWR-radiosonde profiles
Chan and Hon (2011) established that the measurement principle of the two instruments is different (volume integral above a fixed location on the ground for radiometer vs. point measurement of a drifting balloon for radiosonde), hence there are biases and spreads of the data, but the trend was found to be identical. However, the present case study reflects that only the temperature trend of both profiles matches, whereas the RH profile has variations, primarily up to 3.5 km.
3.2 Correlation between MWR and radiosonde based indices
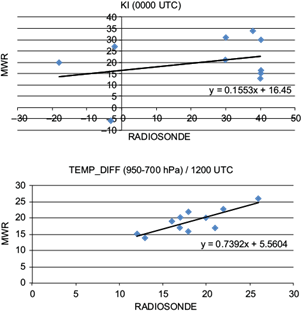
Correlation and p-value (using a t-test) between MWR and RS-based indices were calculated separately for 00:00 and 12:00 UTC profiles (Table II). A total of nine indices/parameters of zenith scan of MWR and nearest RS station have been studied. The results showed that none of these indices are correlated for the 00:00 UTC profile. However, moderate correlation in KI, VTT, TTI, MEAN_RH (950-700 hPa) and TEMP_DIFF (950-700 hPa) were observed for the 12:00 UTC profile. The scattered plots of one of the least (KI for 00:00 UTC) and best (TEMP_DIFF between 950 and 700 hPa for 12:00 UTC) correlated indices are depicted in Figure 3, which the high variation of parameters derived form MWR and radiosonde profiles are confirmed. The best-fit line along with the equation are shown over the plots; however, it cannot be used for forecasting purposes.
Table II Correlation between MWR- and radiosonde-based indices at 00:00 and 12:00 UTC.
| No. | Indices | Correlation values (R)/p-value (00:00 UTC) | Correlation values (R)/p-value (12:00 UTC) |
| 1 | KI | 0.09/0.79 | 0.49/0.12 |
| 2 | CTT | 0.09/0.79 | 0.25/0.45 |
| 3 | VTT | 0.16/0.63 | 0.49/0.12 |
| 4 | TTI | 0.16/0.63 | 0.36/0.27 |
| 5 | MEAN_RH (950-700 hPa) | 0.16/0.63 | 0.49/0.12 |
| 6 | RH_FL | 0.04/0.90 | 0.16/0.63 |
| 7 | TEMP_DIFF (950-700 hPa) | 0.04/0.90 | 0.81/0.002 |
| 8 | TEMP_DIFF (700-400 hPa) | 0.09/0.79 | 0.16/0.63 |
| 9 | TEMP_DIFF (400-300 hPa) | 0.16/0.63 | 0.16/0.63 |
3.3 Case study of thunderstorm over Delhi on February 17, 2009
3.3.1 Cases under study
A total of eight thunderstorm cases over Delhi have been studied. An elaborated analysis of a thunderstorm event occurred on February 7, 2019 has been covered in this section.
3.3.2 Weather sequence
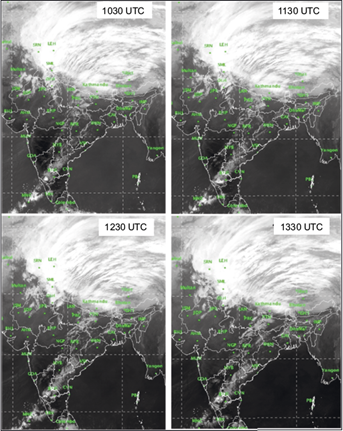
Cyclonic storms associated with the mid latitude Subtropical Westerly Jet (SWJ), referred to as Western Disturbances (WDs) play a critical role in the meteorology of the Indian subcontinent. WDs embedded in the southward propagating SWJ produce extreme precipitation over northern India and are further enhanced over the Himalayas due to orographic land-atmosphere interactions (Dimri et al., 2015). A similar type of extra-tropical system moved across the northern region on February 7, 2019. INSAT-3D (IR1) satellite images of that day from 10:30 to 13:30 UTC (Fig. 4) depict the presence of multi-layered clouding embedded with intense convection in isolation over Delhi and adjoining area. METAR reports of IGI airporta in Delhi reveal the commencement of thunderstorm activity with effect from 11:30 UTC.
3.3.3 Movement of convective cells
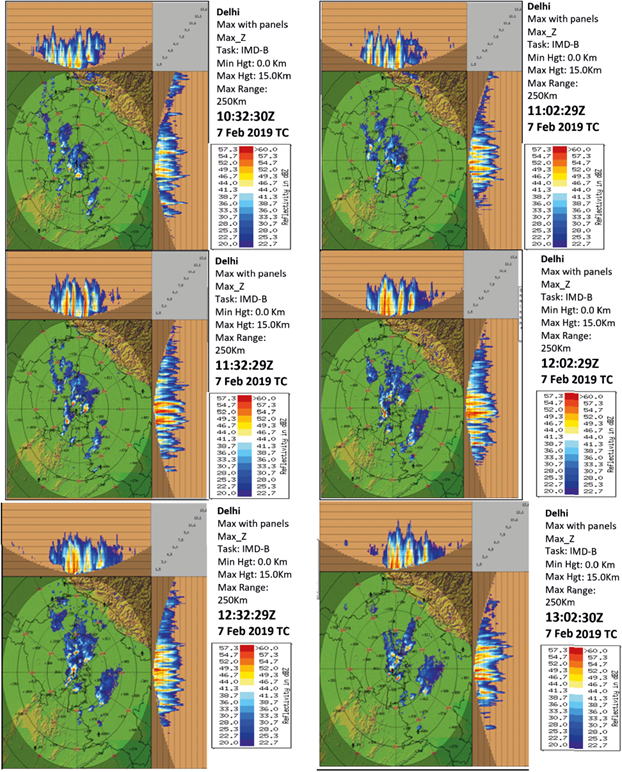
The MWR location is approximately 10 km (aerial) southwest of the IGI airport, Delhi. The Max (z) product of DWR, installed at the airport, is shown in Figure 5. It clearly indicates the presence of a convective cell southwest of the MWR station at 10:32 UTC with vertical extent up to 6 km. This cell can be seen overhead at 11:02 UTC with a new one developing in southwest direction at a distance of 20 km. A second convective cell reached overhead by 12:32 UTC. Reflectivity on both occasions was > 57.0 dBZ, which substantiates the presence of intense convection.
3.3.4 MWR profile of the episode
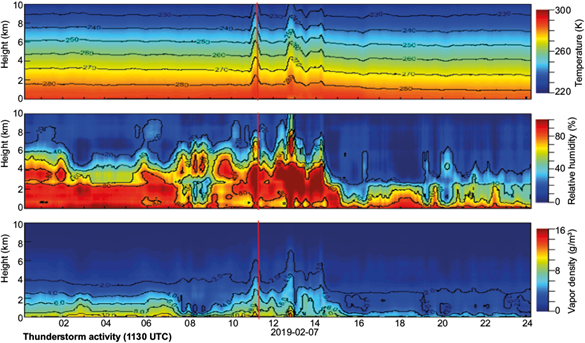
Pre- and post-convective environment of February 7, 2019 was also studied in the light of MWR based profile. Timeline of temperature, RH and vapor density variations are depicted in Figure 6, where it is clearly shown that vertical temperatures were insensitive to the pre-convective environment and sharp changes could only be seen during the actual occurrence of the weather event (11:30 UTC). High RH% (> 90%) was seen at lower levels (up to 1.5 km) at 09:00 UTC and the same reduced thereafter until the time of occurrence. RH was seen increasing gradually from 09:00 UTC onwards between 3 and 6 km. However, the quantity reduced significantly to 70% just prior to the occurrence. Absolutely saturated atmosphere is depicted during the time of occurrence of both the spells. A gradual increase of vapor density was also observed prior to the occurrence, wherein the values reached from 1 to 7 g m-3 in between 2 and 3 km levels. At lower levels the gradient was higher, with an increase of approximately 8.0 units. Maximum contours in the values coincide with the time of occurrence. Vapor density is the only parameter showing significant changes in pre-convective environment. The rise in this feature is indicative of the increase in saturated water content at different levels of the atmosphere which contributed to the convective build-up.
3.3.5 Lightning counts and MWR indices
The case was further analyzed by calculating and studying the variation of MWR-based indices. For that purpose, pre- and post-convective hourly values of the various indices/parameters have been plotted against the total number of lightning flashes sensed by the IAF LDS within 50 km of the MWR location. Figure 7 shows the variation in different indices with respect to number of lightning flashes on the day of occurrence. Left Y-axis depicts the number of lightning flashes, CT and VTT and right Y-axis depicts the variation of RH, TTI, KI and temperature differences for various levels. X-axis represents the timeline where “0” is the time of occurrence (11:30 UTC) and “±” values depict pre- and post-convective hours, respectively. Analysis portrays the significant increase in RH% at freezing level and between 950-700 hPa, wherein the values reach to 98% as compared to nil, recorded 3 h prior to occurrence. Decreasing trend in the CT, VTT (Fig. 7a), TTI and KI (Fig. 7b) indices were noticed prior to the time of occurrence of thunderstorm. Feeble fall (~ 3 ºC) in the temperature difference of 950 and 700 hPa (Fig. 7b) level was recorded 1 h prior to the occurrence of thunderstorm. Temperature variations in middle (700-400 hPa) and upper (400-300 hPa) levels were found to be insignificant (Fig. 7b).
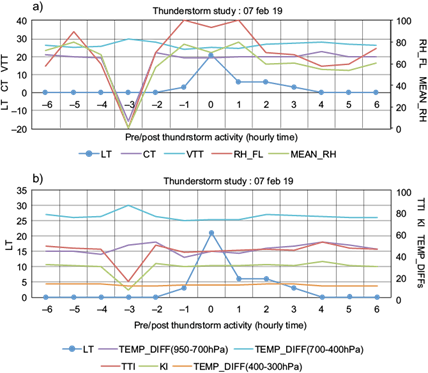
Fig 7 Time series plot of various indices and parameters generated through the MWR profile on February 7, 2019 vs. the count of lightning. X-axis shows the ±6 h of post/pre convective phase where x = 0 depicts the time of maximum thunderstorm activity. (a) The left Y axis denotes the variation of CT, VT and lightning count and the right Y-axis denotes the variation of RH at freezing level (RH_FL), mean relative humidity. (b) The left Y-axis denotes the variation of lightning count and the right Y-axis denotes variations of TTI, KI and temperature differences at various levels (TEMP_DIFFs).
3.4 Superepoch analysis
3.4.1 Time lag analysis
Madhulatha et al. (2013) suggested the superepoch analysis technique to obtain a composite picture of all thunderstorm events vis-à-vis the variation of different indices/parameters on the time series. To examine the temporal variations of various thermal indices lagged composite of all the nine parameters are calculated and depicted in Figure 8. The thunderstorm time of occurrence is considered as lag 0 and lag -6 corresponds to the environment 6 h before the thunderstorm. Similarly, lag +6 denotes the environment 6 h after the occurrence of the thunderstorm. In the current depiction, storm occurrence in considered as zero.
3.4.2 Amalgamated depiction of thunderstorm cases
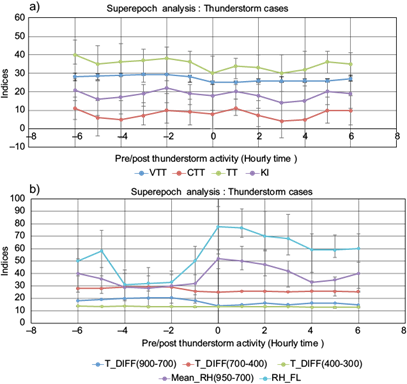
For this technique, nine parameters were calculated for all the eight thunderstorm cases. Pre- and post- environment conditions were superimposed to give a composite picture of each case and thereafter all the cases were merged to present an average variation in the indices/parameters. The average variation is depicted in bold lines in Figure 8, whereas the vertical bars showcase the range of deviation.
3.4.3 Thunderstorm nowcasting
Rajeevan et al. (2012) mention that the variation of composite time series of thermodynamical parameters can explain the prerequisites necessary for the genesis of thunderstorm activity. A similar concept has been implemented in the superepoch analysis, where the MWR based indices/parameters are studied to enable the nowcasting of thunderstorm events. VTT remained almost constant with a value of 28 ºC (Fig. 8a) prior to the thunderstorm occurrence. The CTT, TT and KI indices (Fig. 8a) showed sinusoidal patterns with a marginal fall prior to the occurrence. During the time of occurrence, KI was about 20 ºC, which is very low as compared to 42 ºC as observed by Madhulatha et al. (2013). A lapse rate in the 900-700 and 700-400 hPa (Fig. 8b) layers was of 1 and 3 ºC, respectively. However, a feeble variation of 0.1 ºC was seen in the lapse rate of 400-300 hPa (Fig. 8b). The other two parameters that displayed gradual variation four hours prior to the occurrence were mean RH between 950 and 700 hPa (Fig. 8b) and RH at freezing level (Fig. 8b). The rise in RH at freezing level was close to 36% whereas that of mean RH between 950 and 700 hPa was almost 20%.
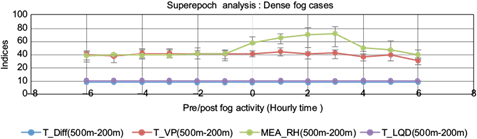
3.4.4 Superepoch analysis of fog events
Superepoch analysis was also applied to three cases of dense fog over Delhi, where the visibility dropped to zero in the morning hours (Fig. 9). However, the studied parameters were related to moisture and temperature variations at the lower levels (between 200 and 500 m) only. A marginal rise of the order of 0.25 ºC in the lapse rate between 500 and 200 m was noticed prior to the occurrence of fog. Total vapor pressure in the similar levels was almost constant with a value of 40 g m-3. Nil variation was noticed in total liquid water with values close to 0.3 g m-3. A gradual increase in mean RH was recorded at the lower levels with a variation of approximately 22%.
4. Inferences and conclusion
The main objective of this study was to analyze the use of a ground based MWR for aviation weather forecasting in the IAF. For this purpose, data of the MWR were first validated using an RS for the similar time period. The results showed that the MWR and RS temperature profiles had minimal variations below 3.5 km for both 00:00 and 12:00 UTC. However, a moderate deviation was noted at mid and higher levels.
The variation in RH profile was noticed with a dry bias at lower levels and a wet bias at middle and higher levels. It was even larger at 00:00 UTC, which means that MWR-generated profiles (especially at 00:00 UTC) are significantly different from RS profiles. Also, a weak correlation and a high p-value between most of the datasets shows a large variation in derived parameters of the MWR and RS profiles.
Hence, the threshold values of indices or parameters developed with the studies of radiometer data cannot be explicitly implemented for forecasting through MWR profiles. Real time inputs received from MWRs should not be used isolated. These indices need to be correlated with local forecasting suggestions and thereafter be utilized for nowcasting purposes. These huge variations may be attributable to the neural network technique and the quality of historical data used to generate the MWR profile from raw data of brightness and temperature. After the neural upgrade of MWR, the profile sensitivity needs to be established vs. thunderstorm and fog events. Refinements of the threshold values of thermodynamic indices for MWR-based prediction may also be carried out on large historical datasets.
Similarly, correlation between different indices generated through MWR and RS profiles were calculated. The results showed that parameters of 00:00 UTC have no correlation. However, a total of five parameters showed moderate correlation for 12:00 UTC profiles, which shows that RH% variation has a profound impact on most of the indices and they cannot be implemented for nowcasting purpose in isolation.
As per Madhulatha et al. (2013), the superepoch analysis suggested that many thermodynamic parameters, lower-level RH, stability index at different levels, and lapse rate of equivalent potential temperature exhibited useful signals at least 3 h before the storm occurrence. Their analysis showed sharp changes in the thermodynamic parameters associated with storms. There are appreciable differences in the variations between thunderstorm and non-thunderstorm cases. However, in the present superepoch analysis most of the parameters under study remain insensitive prior to the occurrence of a severe weather phenomenon. At the same time, standard errors were huge. Parameters like total liquid, temperature difference, and total vapor density at 500-200 m gave no indication of dense fog events. Steep variation in the MWR profiles for similar weather makes it difficult for the forecaster to select any reliable nowcasting indices to predict thunderstorm and dense fog events.
Atmospheric instabilities, mainly convection, depend on temperature distribution and moisture availability (Leena, 2015), which are measured at very high resolution using MWR. However, based on the present study it can be inferred that MWR can only be utilized as an observation tool. Due to its inherent sources of error, MWR profiles cannot be exploited for the nowcasting purpose. There could be multiple reasons for this outcome of the study, being the most noticeable the difference between MWR and RS techniques for retrieval/observation of parameters. However, the results may vary if a greater number of cases are studied, a better neural network is treated and also the off-zenith profiles of MWR are considered for different geographical locations of the country.

