


 nueva página del texto (beta)
 Inglés (pdf)
 Artículo en XML
 Referencias del artículo
 Enviar artículo por email
 Citado por SciELO
  Similares en
SciELO
Similares en
SciELO 
 Permalink
1. Introduction
Stratospheric temperature characteristics are an important component to consider when studying global climate change. The trends of stratospheric temperature can guide the roles of anthropogenic and natural climate change mechanisms. According to the IPCC (2001, 2007), increases (decreases) in tropospheric temperatures and/or decreases (increases) in stratospheric temperatures provide insight into the influences of these mechanisms (Karl et al., 2006; Randel et al., 2009). Based on satellite data from the 1990s, decreases in the mean annual lower and mid-stratospheric temperatures were found by many researchers (Pawson et al., 1998; Randel et al., 2009; Maycock et al., 2018). Knowledge on these changes in stratospheric temperature is vital for estimating trends (Shine et al., 2003) and variations in stratospheric ozone (Ramaswamy et al., 2001; WMO, 2006; Randel et al., 2009). These researchers concluded that among the factors determining the global stratospheric temperature mean, the upper part of the stratosphere and lower area of the mesosphere had a cooling rate of at least 2 ºK/decade between 1980 and 2000. During this time, the lower stratosphere had a cooling rate of approximately half to 1ºK per decade, while that of the mid-stratosphere was approximately 0.5 ºK/decade. Through a model inter-comparison, Shine et al. (2003) attempted to set-up an agreement between the potential reasons for temperature decrease in the layers of the stratosphere. The relationship between observations and model values was not consistently strong in the middle and lower stratosphere, while the model fails to find a significant rate of cooling within the mid-stratosphere and the temperature trends in the lower stratosphere (Aquila et al., 2016). During the same period, the degree of mean stratospheric temperature trends was approximately 0.2 ºK/decade, which is highly correlated to the degree of trends in global mean surface temperature (IPCC, 2007).
Beneath the stratosphere is the troposphere, which interacts with the oceans and is thus directly affected by circumstances at the ocean surface. The stratosphere is linked to surface weather and climate variability. Extreme circulation events in the stratosphere are recognized to exert feedback on the troposphere (Baldwin et al., 2003). Moreover, the stratosphere is influenced by the propagation of waves up from the troposphere (Manzini, 2009). Modeling together with observational studies illustrates that the changes in sea surface temperature (SST) related to El Niño Southern Oscillation (ENSO) influence both tropospheric and stratospheric circulations (Reid et al., 1989; Seager et al., 2003; Manzini, et al., 2006; Xie et al., 2011, 2012; Feng et al., 2013). Domeisen et al. (2019) found that “El Niño leads to a warming of the polar stratosphere in both hemispheres, while the lower tropical stratosphere cools. These signatures are linked by a strengthened stratospheric circulation from the tropics to the polar regions. El Niño also leads to more frequent breakdowns of the stratospheric polar vortex. For La Niña, these effects tend to be opposite, though they are not always robust, suggesting nonlinear or non-stationary effects, long-term variability, and trends in the teleconnections”. Moreover, the Brewer-Dobson circulation strengthened during the positive phase of ENSO through the spread of vertical waves (Sassi et al., 2004; Calvo et al., 2010). Camp and Tung (2007) illustrated that ENSO has an effect on the Northern Hemisphere temperature in the polar stratosphere during winter. However, adjusting stratospheric temperature and circulation due to SST gradient changes remains unknown. Temperatures of the stratosphere are influenced not only by changes in SST but also by changes in ozone and by other greenhouse variations (Santer, 2003; IPCC, 2007). Chen et al. (2010) studied the source regions, spread tracks, and time of air mass movements from the stratosphere to the troposphere in the region of the Asian summer monsoon. Kodera et al. (1990) explained how climatic changes in the troposphere may be affected by the stratospheric procedure.
On global average, since 1979 surface air temperatures (SAT) were warm compared to tropospheric temperatures, and the troposphere was warm compared with the stratosphere (Pielke et al., 1998a, b; Brown et al., 2000; Stendel et al., 2000). Nevertheless, in the tropics and subtropics, warming is highly spatially variable and highly substantial (Christy et al., 2001; Gaffen et al., 2000). According to global observations, SAT has experienced continued warming since the late 1950s, whereas cooling of the stratosphere has been continuing since 1979 (IPCC, 2007). The reason behind this trend is the crucial role of greenhouse gases in cooling the stratosphere and warming the troposphere (Solomon, 1999; Karl et al., 2006; Ramaswamy et al., 2006; IPCC, 2007; Aquila et al., 2016, Maycock et al., 2018). Troposphere-stratosphere unifications characterized by this association occur at all temporal scales, from weekly variability (Kolstad et al., 2010) to long-term climate change (Sigmond et al., 2008; Scaife et al., 2012; Polvani et al., 2011; Karpechko and Manzini, 2012).
Many studies (Cubasch et al., 2001; Rind et al., 2008; Sigmond and Scinocca, 2010; Kidston et al., 2015) illustrate the cooling of the stratosphere and warming of the troposphere due to increased greenhouse gases. SSTs are related to the atmospheric greenhouse gas load. Increasing trends in the tropical SSTs are partly due to rising greenhouse gases. Nevertheless, SST variations can influence the dynamics of the troposphere extending to the stratosphere. Almost every instance of a large-amplitude tropospheric anomaly displays a strong link to the stratosphere, proposing that tropospheric variability would be less without the impact from the stratosphere (Baldwin and Dunkerton, 1999). Regarding the results of these studies, one can credibly hypothesize that SST may influence the activity of the stratospheric wave that drives the residual circulation in the stratosphere. The upper zonal winds of the troposphere increase according to the thermal wind association, and vertically broadcasted waves are deflected more poleward in the stratosphere (Olsen et al., 2007). Therefore, the residual circulation of the stratosphere is strengthened.
Moreover, the study of Olsen et al. (2007) suggests that SSTs significantly influence stratospheric circulation. Omrani et al. (2014) found that warming in the north Atlantic Ocean leads to changes in the extratropical stratosphere in early winter. SSTs have an important role in the atmospheric response in tropical and subtropical regions. Changes in the stratosphere during winter frequently cause significant adjustments in the circulation of the troposphere (Omrani et al., 2014). Additionally, these authors found that the stratosphere is an important element of subtropical atmospheric reactions to variability in the ocean, where it aids in atmospheric processes. These findings suggest that the prediction and simulation of the subtropical climate should improve by using stratosphere-resolving models to provide the best understanding of anthropogenic and natural climate change. Experiments by Omrani et al. (2016) show that north Atlantic Ocean (NAO) variability influences the coupled stratosphere-troposphere system. Kalnay et al. (1996) found that almost all alterations in the NAO were prolonged in the stratosphere and were detected in the stratospheric polar vortex in early winter. Scaife et al. (2005) found that changes in the stratospheric vortex lead to changes in the NAO. The interaction between the troposphere and stratosphere could enhance the NAO in winter and be sensitive to surface forcing. This means that stratospheric variability affects the annular modes and NAO (Black, 2002; Thompson et al., 2002; Kolstad et al., 2010). Atlantic Multi-Decadal Oscillation (AMO) phases (warm/cold) are related to the phases of the NAO (negative/positive) structure in late winter and weaken/strengthen the polar vortex of the stratosphere in early winter (Gastineau and Frankignoul, 2015; Keenlyside et al., 2015).
The current research is important because it is the first in the region to address the characteristics of stratospheric temperatures and their relationships with Atlantic SST and SAT during winter over Saudi Arabia. Section 2 of this paper covers the data and methodology. Changes in stratospheric temperatures in the lower (50 hPa), mid- (30 hPa) and upper stratosphere (10 hPa) are presented in section 3.1. Section 3.2 focuses on the association between SSTs over the Atlantic Ocean and SAT over Saudi Arabia. In section 3.3, teleconnections between the stratosphere and troposphere are examined. Finally, section 4 addresses the conclusions of this study.
2. Data and methodology
2.1 Data
In the current study, monthly of ERA-Interim data (Berrisford et al., 2011) with a resolution of 0.75º × 0.75º for the period 1979-2019 for lower stratospheric temperature at 50 hPA (T50), middle stratospheric temperature at 30 hPa (T30), and upper stratospheric temperature at 10 hPa (T10) is used. Similarly, the NCEP/NCAR reanalysis data (Kistler et al., 2001) with a resolution of 2.5º × 2.5º (Kalnay et al., 1996) for the period 1979-2019 for 2-m winter SAT (December to February) is used in the current study.
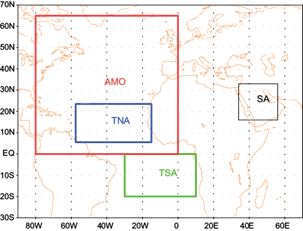
Saudi Arabia covers a wide region (approximately 2 250 000 km2) located between 15.5º-32.5º N and 32º-55º E (Fig. 1). It is characterized by a complex orography. Almazroui et al. (2012) estimated that the region comprises approximately 80% of the Arabian Peninsula.
2.2 Atlantic Ocean indices
The tropical northern Atlantic (TNA) and tropical southern Atlantic (TSA) indices were created following Enfield et al. (1999) as anomalies of the average monthly SST between 5.5º-23.5º N, 15º-57.5º W for TNA, and from 0º-20º S, 10º E-30º W for TSA. The northern tropical Atlantic (NTA) SST index time series anomalies were computed as averages over the area between 60º-20º W, 6º-18º N, and 20º-10º W, 6º-10º N. All SST data were obtained from the ERSST V3b dataset. Anomalies were computed and smoothed by a three-month running mean and superimposed onto 20 leading eigenvalue orthogonal functions. The Atlantic meridional mode (AMM) is well defined as the leading mode of non-ENSO coupled atmosphere/ocean fluctuations in the Atlantic Ocean. The principal component analysis finds patterns without reference to prior knowledge about whether the samples come from different treatment groups or have phenotypic differences. The spatial distribution pattern is defined over the area 21º S-32º N, 74º W-15º E. Two-time series of AMM are calculated through SST projection and the wind field at 10 m. Generally, it is more logical to use the SST index for the AMM because it is more representative of the coupled mode. The TNA, TSA, NTA and AMM time series are acquired from NOAA’s Earth System Research Laboratory (ESRL). AMO time series are computed from the Kaplan SST dataset, which is an index of the temperature in the north Atlantic basin (0º-65º N, 80º W-0º E). Wintertime series (December to February) were also calculated for all indices.
2.3 Methodology
Weighted areal averages of stratospheric temperatures during winter were calculated over the region of Saudi Arabia. The regression least squares method (Wilks, 2006) was used to estimate the linear trend in stratospheric temperature. In section 3.1 when analyzing trends, the choice of start and end dates of the time series is very important due to trend estimates can change dramatically by including or excluding a few years particularly when computing from relatively short time series (e.g., see Liebmann et al., 2010). So, to minimize period selection biases in warming/cooling anomalies we report, the basis of the 1979-2019 intervals selected to characterize the recent decadal behavior of stratospheric temperature variability. The non-parametric Mann-Kendall statistical test was used for the detection of a nonlinear trend within the T50, T30 and T10 time series and the testing of statistical relevance (Sneyers, 1990; Huth, 1999; Schonwiese and Rapp, 1997). The sequential version of the Mann-Kendall rank statistic method can be used to identify abrupt climatic changes (Mitchel et al., 1966; Sneyers, 1990). Many researchers have found that the mentioned method is suitable for detecting climatic changes in climatological time series (Goossens and Berger, 1986; Sneyers, 1990). The correlation technique is a straightforward procedure compared to other methods (such as principal component analysis) to access teleconnection patterns (Nigam, 2003). Koutroulis et al. (2012) explained that several natural physical systems are usually characterized by lead-lag relationships and play a critical role in correlational studies between time series. Cross-correlation analyses are very useful to investigate the manifestation of elements of large-scale climate variability in regional climate and are therefore applied in the current study to investigate relationships between Saudi Arabian stratospheric and surface temperature changes and indices descriptive of major modes of variability in the Atlantic atmospheric and oceanic environments. The time-frame of the lead-lag analysis in this study is ± 10 yr at a 1-yr temporal resolution.
3. Results and discussion
3.1 Characteristics of the stratospheric temperature
The means and linear trends in the lower, mid- and upper stratospheric temperature time series over Saudi Arabia at 50 hPa (T50), 30 hPa (T30), and 10 hPa (T10) during winter were calculated and plotted for the study period 1979-2019 (Fig. 2). The average (standard deviation) values for T50, T30, and T10 are −65.41 ºC (2.0 ºC), −57.02 ºC (2.3 ºC) and −43.74 ºC (2.54 ºC), respectively, for the entire period of study; however, year-to-year variations in T50, T30 and T10 are not clear. The T50 time series for the period 1979-2019 is highlighted in Figure 2a, accompanied by the findings of the linear trend analysis. A significant decreasing trend (R2 = −0.50) in winter for T50 occurred during the entire period (1979-2019). The analysis of temperatures in the mid-stratosphere (T30, Fig. 2b) and in the upper stratosphere (Fig. 2c) shows an insignificant decreasing linear trend (R2 = 0.20 for T30; R2 = 0.05 for T10). The statistical Mann-Kendall rank test clearly illustrates that the values for the T50, T30 and T10 non-linear trends are equivalent to −0.40 ºC (99% confidence level), −0.32 ºC (95% confidence level) and −0.16 ºC, respectively, over the entire study period. Hasanean (2004) and Hasanean et al. (2019) found similar results for the T50 trend over the Arabian Peninsula in separate studies.
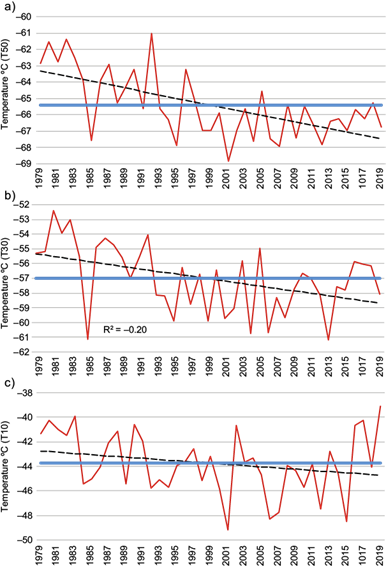
Fig. 2 Time series of stratospheric temperature at: (a) 50 hPa (T50), (b) 30 hPa (T30), (c) 10 hPa (T10) during winter in the period 1979-2019. The blue solid line represents the mean value for the entire period. Trends (black dotted line) are displayed for the entire period.
A very strong positive relationship between T50 and T30 (r = 0.78) exists at the 99% confidence level. Moreover, the relationship between T50 and T10 is strong (r = 0.50, 99% confidence level). Additionally, there is a moderate relationship between T30 and T10 (r = 0.37) at the 99% confidence level.
The Mann-Kendall’s t-test of abrupt changes for stratospheric temperatures at the lower stratosphere (50 hPa), mid-stratosphere (30 hPa) and upper stratosphere (10 hPa) are shown in Figure 3. A significant abrupt climatic change is evident at all three levels. Lower, mid-, and upper stratospheric temperatures show changes towards warming during the year 1992 for T50 and T30 and during the year 1983 for T10. Our analysis indicates that abrupt changes of stratospheric temperatures during those years may have resulted from the impact of volcanic eruptions. The largest volcanic eruptions occurred in the years of maximum stratospheric temperatures (the El Chichón eruption in 1982, the Colo eruption in 1983, and the Mt. Pinatubo eruption in 1992). These findings are in agreement with works from other researchers (e.g., Angell, 1997; Randel et al., 2009; Zossi and Fernández, 2011). For example, the 1982 El Chichón and the 1992 Mt. Pinatubo eruptions influenced the stratospheric temperature of the Northern Hemisphere (Pawson et al., 1998). The surface temperature showed cooling after the Pinatubo eruption, which caused changes in atmospheric circulation, while at the same time, the temperature in the lower stratosphere warmed (Self et al., 1996). Several past studies (e.g., Labitzke and McCormick, 1992; Young et al., 1994; Soden et al., 2002) illustrate the impacts of volcanic eruptions on temperatures in the lower stratosphere and at Earth’s surface. These researchers found that lower stratospheric warming and surface cooling were documented after a volcanic eruption. Aquila et al. (2016) stated that in the lower stratosphere, Mount Pinatubo and the solar cycle caused abrupt steps through the aerosol-associated warming and the volcanically induced ozone depletion. They also stated that in the middle and upper stratosphere, changes in solar irradiance are largely responsible for the step-like behavior of global temperature anomalies, together with volcanically induced ozone depletion and water vapor increases in the post-Pinatubo years.
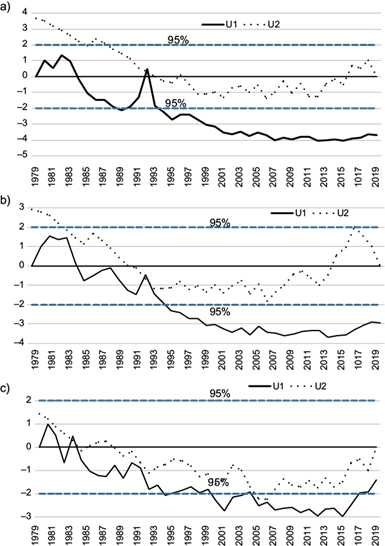
Fig. 3 Abrupt changes in temperature time series for (a) lower stratosphere (T50); (b) mid-stratosphere (T30); and (c) upper stratosphere (T10), as derived from the sequential version of the Mann Kendall test. U1: forward sequential statistic; U2: backward sequential statistic.
To better understand the dynamics of changes in stratospheric temperature, the time series of stratospheric temperatures in Saudi Arabia may be compared with time series of stratospheric temperature in the Northern Hemisphere’s tropical regions (0º-25º N), subtropical regions (25º-40º N), mid-latitude regions (40º-60º N), and polar regions (60º-90º N). Therefore, the correlation coefficient between the Saudi Arabian temperature time series during winter in the lower (T50), mid- (T30), and upper stratosphere (T10), and the winter stratospheric temperatures in those areas at the same levels were calculated (Table I) in the current study. A strong positive relationship (99% significance level) between the stratospheric winter temperature time series over Saudi Arabia and time series over the Northern Hemisphere (tropical, subtropical, and mid-latitude regions) in lower, middle and upper levels are evident in Table I. However, a weak relationship between the temperature time series in the lower, middle and upper stratosphere over Saudi Arabia and the polar region is observed. Salby and Callaghan (2003) showed the inverse relationship between stratospheric temperatures at high and low latitudes and affirmed that it was accompanied by a similar reversal trend in ozone (WMO, 1999, 2006). Such behavior of the subtropical and mid-latitude lower stratospheric temperature time series is the same as that over the tropics (Randel et al., 2009).
Table I Correlation coefficient (CC) between stratospheric temperature over Saudi Arabia and over the Northern Hemisphere (tropical [0º-25ºN], subtropical [25ºN-40ºN], mid-latitude [40ºN-60ºN], and Polar [60ºN-90ºN] regions) at T50, T30, and T10 during winter for the entire period (1950-2019.
| CC | Northern Hemisphere (0º-90º) | Tropical (0º-25º N) | Subtropical (25º-40º N) | Mid-latitude (40º-60º N) | Polar (60º-90º N) |
| Saudi Arabia T50 | 0.84* (T50) | 0.79* (T50) | 0.92* (T50) | 0.75* (T50) | −0.16(T50) |
| Saudi Arabia T30 | 0.68* (T30) | 0.61* (T30) | 0.96* (T30) | 0.86* (T30) | −0.13(T30) |
| Saudi Arabia T10 | 0.61* (T10) | 0.81* (T10) | 0.89* (T10) | 0.62* (T10) | 0.23(T10) |
*99% significance level.
3.2 Teleconnection between stratospheric temperature and sea surface temperature
Table II shows the correlation between all SST indices. All SST indices over the Atlantic Ocean are related to each other with the exception of the TSA regarding the TNA, AMO, and AMM. A strong positive association is observed between SST indices over the Atlantic Ocean. Although the areas of TNA and NTA are different, the results of the relationships between each index and other parameters are nearly the same. Additionally, the results of the relationship of NTA and AMM with other parameters are approximately the same. So, it is reasonable to use only the TNA, TSA and AMO indices (Fig. 1).
Table II Relationship between sea surface temperatures indices (SSTs) over the Atlantic Ocean.
| CC | TNA | TSA | AMO | AMM | NTA |
| TNA | 1 | ||||
| TSA | 0.24 | 1 | |||
| AMO | 0.84 | 0.42 | 1 | ||
| AMM | 0.83 | −0.12 | 0.71 | 1 | |
| NTA | 0.99 | 0.28 | 0.85 | 0.82 | 1 |
The relationships between stratospheric temperatures (T50, T30, and T10) and SST indices over the Atlantic Ocean TNA, TSA, and AMO are given in Table III and also shown in Figures 4-6. In general, a negative correlation between the SST over the Atlantic Ocean and stratospheric temperatures in the three levels (entire period: 1979- 2019) is found. A strong negative relationship (r = −0.41; 99% confidence level) exists between lower stratospheric temperature (T50) and the AMO index for the entire period (Fig. 4c). Moreover, a statistically significant negative relationship (r = −0.36) at the 99% confidence level between T50 and TSA (Fig. 4b) is evident. There is an insignificant negative relationship between T50 and the TNA (r = −0.17; Fig. 4a). Regarding the correlations among mid-stratospheric temperature, T30, and SST indices over the Atlantic Ocean, we found only a significant relationship between T30 and AMO (r = −0.32; 95% confidence level [Fig. 5C]), whereas an insignificant negative relationships between T30 and the TNA and TSA indices (Fig. 5a, b) was present. However, there is no relationship between upper stratospheric temperature (T10), with SSTs of the Atlantic Ocean (TNA, TSA, and AMO [Fig. 6a-c]).
Table III Correlation coefficient (CC) between stratospheric temperature over Saudi Arabia (T50, T30, and T10) and SSTs indices over the Atlantic Ocean for the entire period (1979-2019).
| CC | T50 | T30 | T10 |
| TNA | −0.17 | −0.12 | 0.08 |
| TSA | −0.36* | −0.10 | −0.02 |
| AMO | −0.41** | −0.32* | −0.03 |
*95% significance level; **99% significance level.
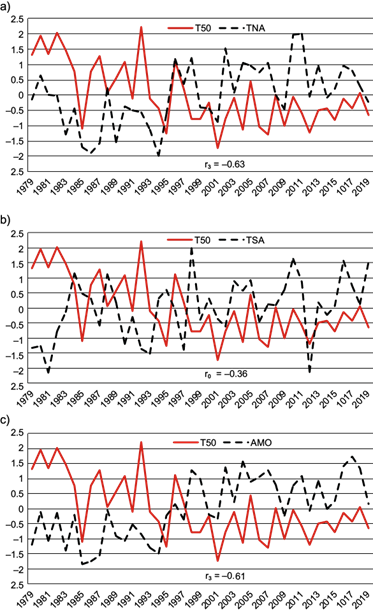
Fig. 4 Time evolution of standardized anomalies of the lower stratospheric temperature at 50 hPa (T50). (a) tropical North Atlantic (TNA), (b) tropical South Atlantic (TSA), and (c) Atlantic Multi-decadal Oscillation (AMO). rº is a correlation between two patterns at zero lag and rmax=3 is the maximum correlation at three lead.
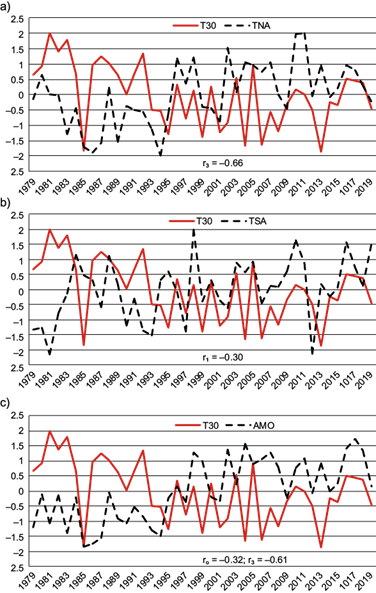
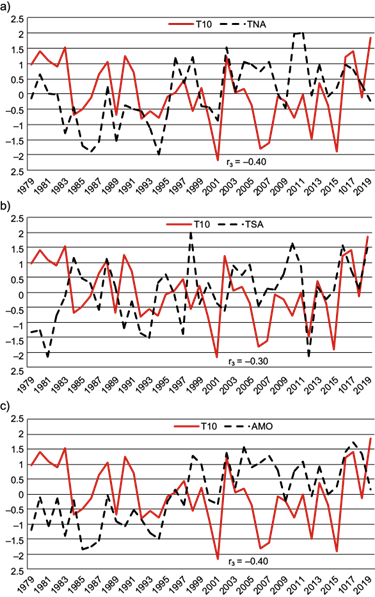
Regarding the results of our lead-lag cross-correlation analysis, a strong negative relationship between SSTs indices at three lead and stratospheric temperatures (Table IV) is present. A strong negative association between the T50 and TSA index at zero lead-lag is present. Additionally, only T30 is related to the TSA SST index at a one winter lead, which reveals a statistically negative relationship (95% confidence level). Moreover, there is a strong negative relationship between T30 and the TNA and AMO index over at least three winters (95% confidence level). There are three lead cross-correlations between the T10 and the SST indices over the Atlantic Ocean. For instance, a good negative association between T10 and the TNA (−0.40), TSA (−0.32), and AMO SST (−0.40) indices at a three winters lead is observed. A strong negative relationship between T50 and each of TNA (−0.63) and AMO SSTs (−0.62) with a 99% confidence level is also present.
Table IV Maximum lead-lag cross correlation between sea surface temperatures (SSTs) indices over the Atlantic Ocean and stratospheric temperature (ST).
| T50-SST | Lag/Lead | Correlation | T30-SST | Lag/Lead | Correlation | T10-SST | Lag/Lead | Correlation |
| T50-TNA | +3 | −0.63 | T30-TNA | +3 | −0.66 | T10-TNA | +3 | −0.40 |
| T50-TSA | 0 | −0.36 | T30-TSA | 1 | −0.30 | T10-TSA | +3 | −0.30 |
| T50-AMO | +3 | −0.62 | T30-AMO | +3 | −0.61 | T10-AMO | +3 | −0.40 |
From the above results, it is found that over the entire study period, the temperature in the lower, mid- and upper stratosphere is connected at three leads with TNA and AMO SST indices over the Atlantic Ocean. Therefore, the increase in SST over the Atlantic Ocean may lead to a decrease in the stratospheric temperature over Saudi Arabia. In addition, the temperature in the lower and mid-stratosphere is associated with the SSTs of the TSA index at zero lead-lag and one lag respectively.
3.3 Teleconnection between the surface and stratospheric temperatures
We also examined the teleconnection of Saudi Arabia’s winter time T10, T30, and T50 stratospheric temperature and SAT records with the estimation of correlation coefficients (see Fig. 7). Correlation coefficient calculations are performed between the winter SAT and T50, T30, and T10. Negative relationships (r = −0.32 and −0.35; 95% confidence level) between the Saudi Arabian winter SAT and the T50 and T30 time series are observed. A weak association between T10 and SAT (r = −0.10) over Saudi Arabia is found. The maximum correlations of STA with T50 and T30 are found at a zero lag (r = −0.32 and r = −35, respectively; statistically significant at the 99% confidence level). The maximum correlation between the STA and T10 (r = −0.10) is observed with a lead of four seasons. This result proposes that the SAT in the Saudi region is linked to lower and mid-stratospheric temperatures.
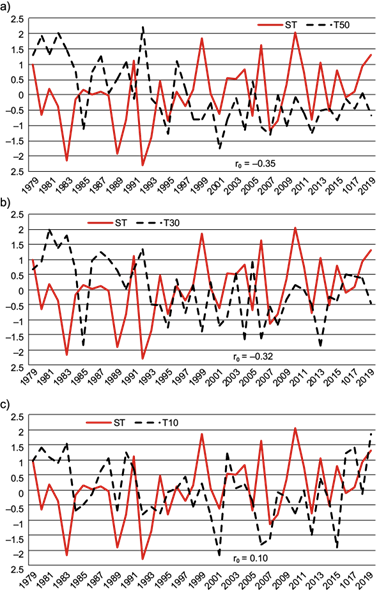
Fig. 7 Relationship between SAT and (a) T50, (b) T30, and (c) T10 over Saudi Arabia in winter during the period 1950-2019.
Since 1979, the global average temperature at the surface has been warmer than that in the troposphere, while the troposphere is warmer than the stratosphere (Hurrell et al., 2000; Pielke et al., 1998a, b; Stendel et al., 2000). A variety of observations confirm that the rate of SST warming in the tropics since 1979 has been higher than the warming observed in the atmosphere (Gaffen et al., 2000; Christy et al., 2001). According to global observations, the SAT started to warm from the late 1950s, while cooling of the stratosphere has continued since 1979 (IPCC, 2007). This is attributed to the crucial role of greenhouse gases in cooling the stratosphere and warming the troposphere (Karl et al., 2006; Ramaswamy et al., 2006; IPCC, 2007). A strong positive and negative relationship exists between the SSTs of the equatorial Pacific and the temperature of the lower tropical stratosphere (Reid et al., 1989). Troposphere-stratosphere concurrences characterized by this association exist at all timescales, from weekly variability (Kolstadet al., 2010) to long-term climate change (Sigmond et al., 2008; Scaife et al., 2012; Polvani et al., 2011; Karpechko and Manzini, 2012).
4. Summary and conclusions
Analysis of the stratospheric temperatures in the lower (T50), mid- (T30) and upper (T10) layers provides further insight into the characteristics of stratospheric temperatures. The linear trend of T50 in the winter over Saudi Arabia shows a significant decreasing trend (substantial cooling) for the entire period (1979-2019). Slight cooling in the mid- and upper stratospheric temperature (T30 and T10) is observed for the entire period. Additionally, standard deviation results show a relatively high variability, which means that variability in stratospheric temperatures is greater. Using the Mann-Kendall test, the non-linear trend shows a significant cooling for T50 and T30 but an insignificant cooling for T10. Additionally, from the correlations with stratospheric temperatures in the three layers, a good similarity between T50 and T30 is found, but the similarity is weak when T50 and T30 are compared with T10.
To determine the underlying forces of stratospheric temperature variation, stratospheric temperatures in Saudi Arabia are associated with time series of stratospheric winter temperatures over the Northern Hemisphere (tropical, subtropical, mid-latitude, and polar regions). A strong positive connection between time series of stratospheric winter temperature over Saudi Arabia and the tropical, subtropical, and mid-latitude regions of the Northern Hemisphere were found at the three levels. However, a very weak negative association between stratospheric temperature in wintertime series in the lower, mid-, and upper stratosphere over Saudi Arabia and polar regions was observed. At lower stratospheric temperatures, similar behaviors in tropical, subtropical, and mid-latitude regions are observed (Randel et al., 2009); moreover, the opposite association of stratospheric temperatures between high and low latitudes is found (Salby and Callaghan, 2003; WMO, 1999, 2006)
Regarding teleconnections between SSTs over the Atlantic Ocean (TNA, TSA, and AMO) and stratospheric temperatures over Saudi Arabia, it is concluded that there is an association between them. Generally, a negative correlation between SSTs over the Atlantic Ocean and stratospheric temperatures over Saudi Arabia is found. Notably, a strong negative relationship between SSTs over the TSA and AMO SSTs of the Atlantic Ocean and T50 is observed for the entire study period, while the relationship between TNA and T50 is absent. A statistically negative relationship between the mid-stratospheric temperature T30 and the AMO index exists for the entire period. Moreover, a very weak relationship between T30 and TNA and TSA SSTs indices is observed. In addition, the relationships between T10 and the SSTs of the Atlantic Ocean are absent.
To discover the physical mechanisms that contribute to Saudi Arabian stratospheric temperatures, the lead-lag cross-correlation method was used. Notably, SSTs indices of the Atlantic Ocean are linked with lower, mid- and upper stratospheric temperatures. Moreover, the TSA SST index is linked with the lower stratospheric temperature (T50) at a zero lag and mid-stratosphere (T30) is linked at one lead. Also, T50 and T30 are linked with TNA and AMO SST indices after three winter seasons. Additionally, T10 is linked with SSTs indices of the Atlantic Ocean after three winter seasons.
Two ways to clarify the effects of SSTs on stratospheric temperatures are:
SSTs are linked to greenhouse gases that warm the troposphere and cool the stratosphere (e.g, Cubasch et al., 2001; IPCC, 2007; Rind et al., 2008; Sigmond et al., 2008; Omrani et al., 2014).
SSTs influence the vertical propagation of tropospheric waves that extend to the stratosphere (Reichler et al., 2012; Hu et al., 2014; Kidston et al., 2015; Zhang et al., 2019). A reverse procedure can occur where air current movement in the stratosphere spreads down to impact the tropospheric circulation.
By inspecting the association between SAT and the stratospheric temperatures at the three levels (lower [T50], middle [T30], and upper [T10]) over Saudi Arabia, a coupling between them in winter is observed. Correlation analysis is used to determine the teleconnection between stratosphere and troposphere. There is good coupling of SAT with T50 and T30, but the coupling is weak between SAT and T10. Stratosphere-troposphere coupling is associated with changes in surface weather and is mainly observed in winter and early spring (Mohanakumar, 2008; Gerber and Polvani, 2009; Domeisen, 2012; Kunz and Greatbatch, 2013).

