nueva página del texto (beta)
 Inglés (pdf)
 Artículo en XML
 Referencias del artículo
 Enviar artículo por email
 Citado por SciELO
  Similares en
SciELO
Similares en
SciELO 
 Permalink
1. Introduction
The eastern North Pacific (ENP) warm pool is a part of the Western Hemisphere warm pool (Wang and Enfield, 2001), approximately encompassed by the area east of 120º W and west of Mexico and Central America, where the surface temperature is generally above 27 ºC. Although not as large as its Indo-Pacific counterpart, the ENP features similar large-scale atmospheric circulation, tropical convection, and tropical cyclone features and variability to that of the west Pacific warm pool (Misra et al., 2016). Tropical cyclones (TCs) that form in the ENP and their remnants are an important source of precipitation in Mexico and the southwestern United States (Englehart and Douglas, 2001; Ritchie et al., 2011; Domínguez and Magaña, 2018). On the intraseasonal time scale, the Madden Julian Oscillation (MJO; Madden and Julian, 1971, 1972; Maloney and Esbensen, 2003; Neena et al., 2014) modulates convection in this region during boreal summer, with notable northward propagation of convection anomalies (Jiang and Waliser, 2008, 2009; Maloney et al., 2008). Modeling evidence suggests that the ENP can support its own intraseasonal mode of variability (hereafter ENP ISO) in isolation from the Eastern Hemisphere, although variability in this region tends to phase-lock with the MJO (Jiang et al., 2012; Rydbeck et al., 2013). The ENP ISO has been implicated in the modulation of TC genesis and overall TC activity in this region (e.g., Molinari et al., 1997; Maloney and Hartmann, 2000, 2001; Higgins and Shi, 2005; Romero-Vadillo et al., 2007; Camargo et al., 2008; Klotzbach, 2010, 2014; Jiang et al., 2012; Slade and Maloney, 2013).
The MJO affects TC genesis by altering large-scale environmental variables including relative vorticity, humidity, and vertical wind shear, with the relative importance of different variables depending on basin (Camargo et al., 2009; Zhao and Li, 2019). By analyzing a genesis potential index (GPI) using reanalysis data over the global oceans, Camargo et al. (2009) showed that midlevel relative humidity fluctuations make the largest contribution to MJO composite GPI anomalies, followed by contributions from low-level absolute vorticity, with only minor contributions from vertical wind shear and potential intensity. In the ENP region, while midlevel humidity and low-level vorticity are the two most important contributors to ISO composite GPI anomalies (Camargo et al., 2009), the relative importance of each variable depends strongly on location and ISO phase (Jiang et al., 2012). Previous studies have reported that TC development is increased (by up to four times) when lower-tropospheric wind anomalies in the east Pacific associated with the ISO are westerly (when convection is enhanced) vs. easterly (e.g., Maloney and Hartmann, 2000; Aiyyer and Molinari, 2008). Barotropic energy conversions from the mean state to eddies during the convective phase of the MJO have been hypothesized to contribute to the increase of cyclogenesis by strengthening the easterly wave seed disturbances for TCs (Maloney and Hartmann, 2001). Barrett and Leslie (2009) attributed increased TC formation during the ISO’s convectively active phase to enhanced upper-tropospheric divergence. Given these impacts of the ISO on TC activity in the current climate, understanding changes of ENP intraseasonal variability under global warming and its influence on TC activity is of interest to people living in this region.
Much recent work has been conducted on MJO changes under global warming (see a review in Maloney et al., 2019). Global climate models generally predict that MJO precipitation amplitude will increase while MJO circulation strength increases at a slower rate or even weakens in the presence of global mean temperature warming (e.g., Takahashi et al., 2011; Arnold et al., 2013, 2015; Chang et al., 2015; Adames et al., 2017a, b; Bui and Maloney, 2018, 2019a, 2020; Rushley et al., 2019, among many others). Differences in the rate of change between MJO precipitation and wind are explained by increased static stability in the tropics under global warming in the presence of weak horizontal temperature gradients (Bui and Maloney, 2019b). In addition, MJO variance is projected to shift further eastward into the central equatorial Pacific in a warmer climate (Bui and Maloney, 2018). Most of the studies above have focused on MJO change in the Eastern Hemisphere, with ISO change in the ENP receiving less emphasis. The fact that the ENP ISO tends to be poorly represented in most global climate models is likely one reason for this lack of emphasis (e.g., Jiang et al., 2013; Lin et al., 2008).
ISO variance and northward propagation in the ENP were underestimated in the previous climate models in phase 3 of the Coupled Model Intercomparison Project (CMIP3; Lin et al., 2008). The fifth phase of CMIP (CMIP5) shows some improvements in the ENP ISO, although only a few models can capture the spatial pattern of the leading mode of intraseasonal variability (Jiang et al., 2013). CMIP6 (Eyring et al., 2016) provides another state-of-the-art multimodel dataset to advance our knowledge of climate variability and climate change. After documenting the ability of CMIP6 models to simulate ENP ISO precipitation and wind variability in current climate, we will examine how the ENP ISO changes at the end of the 21st century in the Shared Socioeconomic Pathways (SSP) with fossil-fueled development combined with 8.5 W m-2 forcing scenario (SSP585; O’Neill et al., 2016) in 14 CMIP6 models. We will then use a GPI to infer how the modulation of TC genesis by the ENP ISO may change in a future warmer climate. The effect of anthropogenic forcing on the mean TC activity including its frequency, intensity, and spatial distribution has been extensively studied in recent years (see the review of Knutson et al., 2010, 2020; Murakami et al., 2020), although relatively little work has examined how the intraseasonal modulation of TC activity may change. In particular, we will quantify the contributions from changes in ENP ISO dynamics including wind shear and vorticity anomalies (e.g., Liebmann et al., 1994; Maloney and Hartmann, 2000; Hall et al., 2001) and relative humidity anomalies (e.g., Camargo et al., 2009) to changes in the ENP ISO’s modulation of TC genesis in a future warmer climate.
We describe the CMIP6 models, observational datasets, and methodology in section 2. Section 3 examines projected ISO changes in the ENP at the end of the 21st century in the SSP585 scenario, followed by an examination of the impacts on TC genesis in section 4. The main conclusions are summarized in section 5.
2. Data and methodology
2.1 CMIP6 models and observational datasets
The historical and the Shared Socioeconomic Pathways (SSP) with fossil-fueled development combined with 8.5 W m-2 forcing scenario (SSP585; O’Neill et al., 2016) experiments from 14 CMIP6 models (Eyring et al., 2016) were used to investigate changes of the ENP ISO and its impacts on TC genesis under anthropogenic warming. The present and future climate were defined using 1986-2005 in the historical run and 2081-2100 in SSP585, respectively. The 14 CMIP6 models examined provide daily mean data that are necessary for ISO-related diagnosis. A brief description and the spatial resolution of the models used are given in Table I.
Table I List of the 14 CMIP6 models used in this study. Models determined to have a good eastern North Pacific ISO in the current climate are noted in bold. Eight models included in the GPI calculation are noted with *.
| # | Model | Description | Resolution |
| 1* | BCC-CSM2-MR | Beijing Climate Center, China | 1.125 × 1.125 |
| 2* | CESM2 | National Center for Atmospheric Research, USA | 1.25 × 0.94 |
| 3* | CESM2-WACCM | ||
| 4 | CNRM-CM6-1 | Centre National de Recherches Météorologiques, France | 1.4 × 1.4 |
| 5 | CNRM-CM6-1-HR | 0.5 × 0.5 | |
| 6* | EC-Earth3 | A European Community Earth System Model | 0.7 × 0.7 |
| 7 | EC-Earth3-Veg | ||
| 8 | GFDL-CM4 | Geophysical Fluid Dynamics Laboratory, USA | 2.5 × 2 |
| 9* | MIROC6 | Model for Interdisciplinary Research on Climate, Japan | 1.4 × 1.4 |
| 10 | MPI-ESM1-2-HR | Max Planck Institute Earth System Model, Germany | 0.94 × 0.94 |
| 11 | MPI-ESM1-2-LR | 1.875 × 1.875 | |
| 12* | MRI-ESM2 | Meteorological Research Institute, Japan | 1.125 × 1.125 |
| 13* | NorESM2-LM | Norwegian Climate Centre, Norway | 2.5 × 1.875 |
| 14* | NorESM2-MM | 1.25 × 0.94 |
Among these 14 models, 12 of them will be shown to produce a reasonable simulation of ENP intraseasonal variability in current climate, and only these models are used to examine changes of ENP ISO behavior with warming. These 12 models are indicated in bold in Table I. Due to the availability of variables that are needed to calculate TC potential intensity that goes into the calculation of genesis potential index (GPI), only eight of the 12 chosen models were included in the GPI calculation in section 4. These models are noted with an asterisk in Table I.
ENP ISO convective characteristics in the observed record are assessed using the Integrated Multi-satellitE Retrievals for Global Precipitation Measurement (GPM IMERG) version 6 (Huffman et al., 2018) and interpolated daily with outgoing longwave radiation (OLR) from the National Oceanic and Atmospheric Administration (NOAA) polar-orbiting satellite product (Liebmann and Smith, 1996). Observed ENP ISO wind variability is characterized using 850-hPa zonal wind from the fifth global reanalysis produced by the European Center for Medium-Range Weather Forecasts (ERA5; Hersbach et al., 2020). All of the observational analysis covers the period 2001-2019.
Both model output and observational data are converted to a daily mean and have been interpolated to a common grid of 2.5º (longitude) 2º (latitude) before analysis. Only boreal summer (May to October) is examined in this study.
2.2 ENP ISO composite and genesis potential index
To highlight boreal summer intraseasonal variability in the ENP, a local ENP ISO index was generated from the first principal component (PC1) of the leading combined empirical orthogonal function (CEOF; e.g., Wheeler and Hendon, 2004; Lee et al., 2013) of 20-100 day filtered 850-hPa zonal wind and OLR over the ENP domain (0º-30º N, 75º-125º W). Each field was normalized by its domain standard deviation before the CEOF analysis was conducted. The structure of this leading mode is shown in Figure 3, which explains 29.6 and 33.1% of the total variance in observations and historical simulation, respectively. The ENP ISO index created here is similar to that employed by Maloney and Hartmann (2001), except that a CEOF analysis is done rather than EOF analysis using only the 850-hPa zonal wind field. Maloney et al. (2008) and Jiang et al. (2013) similarly produced a local ENP intraseasonal index based on the leading complex EOF of 30-90 day filtered precipitation. In our analysis, days when the PC time series of the leading CEOF is greater than 1σ are used for composite analysis, corresponding to positive precipitation anomalies and anomalous low-level westerly winds. Composites based on negative deviations of the index have a similar pattern, but with opposite sign (see Fig. S1 in the supplementary materials).
We use the TC genesis potential index (GPI) developed by Emanuel and Nolan (2004) and discussed in detail by Camargo et al. (2007) to assess how ENP ISO changes affect TC genesis potential in a warmer climate. Following Camargo et al. (2009), the GPI is calculated as
where η is the absolute vorticity at 850 hPa (s-1), H is the relative humidity at 600 hPa (%), PI is the potential intensity (m s-1), and V shear is the magnitude of the vertical wind shear between 850 and 250 hPa (m s-1). The potential intensity (PI) is calculated based on Emanuel (1995) as modified by Bister and Emanuel (1998). Since daily values at sufficient vertical resolution are not available for most models to adequately calculate PI, we use monthly mean surface temperature and pressure and vertical profiles of atmospheric temperature and humidity. While this prevents a realistic depiction of intraseasonal PI variations, PI has been shown to only produce minor contribution to intraseasonal TC genesis potential variations in the east Pacific (Camargo et al., 2009).
To assess the individual importance of the variables that comprise the GPI for determining the ENP ISO GPI anomalies, the following method is used. First, the GPI is calculated where all three variables other than PI (i.e., η, H, V shear ) are allowed to fully vary. Then, we recompute the GPI such that two out of the three variables are allowed to vary, but with the climatological annual cycle of the remaining variable input. This quantity can then be subtracted from the GPI calculated using all variables to assess the importance of the variable of interest. This allows more nonlinearity in the calculation than setting all variables to the climatological mean as done in Camargo et al. (2009). The method therefore provides a better quantitative estimate of the relative importance of the different factors to intraseasonal variability of GPI anomalies.
3. Changes in the ENP ISO
3.1 Changes in summer mean state
We first briefly discuss the multimodel mean oceanic climatological May-October precipitation, 850 hPa zonal wind and OLR distributions over the eastern North Pacific (Fig. 1). Given our emphasis on warm pool intraseasonal variability and TC genesis potential, we only concentrate on oceanic fields in this analysis. Similar plots from satellite and reanalysis fields can be found in Maloney and Esbensen (2007) and Xie et al. (2005), and from CMIP5 models in Jiang et al. (2013). The multimodel mean precipitation in the historical CMIP6 simulation has the main axis of the ITCZ centered at around 9º N (Fig. 1a), coincident with the minimum OLR in the ITCZ region (Fig. 1c), which expands northward toward the coast east of 120º W. We note that the precipitation minimum over the cold waters west of Costa Rica Dome (9º N and 90º W; also see figure 4 in Xie et al., 2005) is still not well-produced in the CMIP6 models analyzed here. The 850 hPa zonal wind is dominated by an easterly component (Fig. 1e), although the flow at the surface is mean westerly near 10º N in the ENP warm pool (not shown here). This basic state flow has implication for air-sea interaction, since a westerly anomaly at the surface would produce enhanced wind speed and surface latent heat flux (Maloney and Esbensen, 2003) that has been argued to be important for the dynamics of ISO in the ENP (e.g., Maloney and Esbensen, 2007; Maloney et al., 2008).
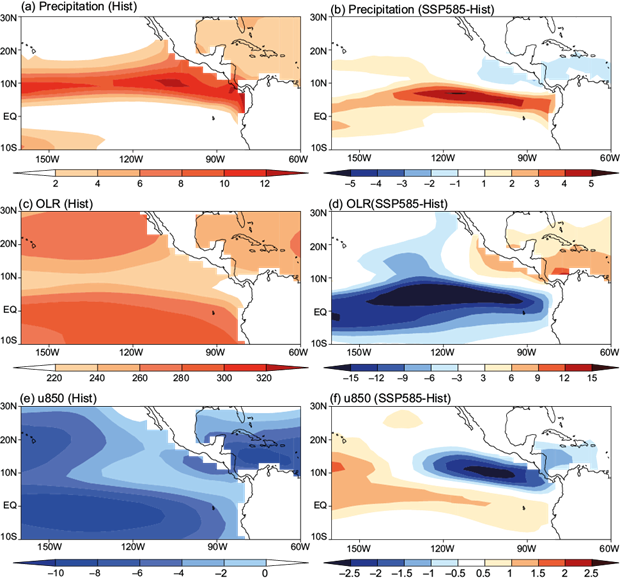
Fig. 1 Multimodel mean (from 14 CMIP6 models) spatial distribution of the boreal summer climatological mean. (a, b) Precipitation (mm day-1), (c, d) outgoing longwave radiation (OLR; W m-2), and (e, f) 850 hPa zonal wind (m s-1) for the historical simulation and differences between SSP585 and historical simulations, respectively. See Figure S2 in the supplementary material for the entire tropical pattern.
Under global warming, mean precipitation increases over the southern part of the ENP between 5º to 10º N and west of 150º W (Fig. 1b), suggesting a strengthening and southwestward shift of mean precipitation within the ENP intertropical convergence zone (ITCZ). The westward shift may be related to a more frequent occurrence of central Pacific El Niño in a future warmer climate (see Fig. S2 in the supplementary materials for the entire tropical pattern; Yeh et al., 2009). This feature is also clearly apparent in the OLR pattern (Fig. 1d). These projected changes in the mean state convection are also in agreement with previous results from the CMIP3 (Neelin et al., 2006) and CMIP5 (Jiang et al., 2013) datasets, and other models (Maloney et al., 2014). In general, the pattern resembles the “rich-get-richer” pattern of precipitation change found in previous warming studies (e.g., Chou et al., 2009). It is also worth noting that precipitation near the Mexico coast, where most tropical cyclones occur in current climate, tends to slightly decrease, consistent with previous findings of Jiang et al. (2013). Implications for future changes of tropical cyclogenesis in this region will be further discussed below.
3.2 Changes in the ISO amplitude over the ENP
We now analyze precipitation and wind anomalies over the ENP warm pool on intraseasonal timescales. Figure 2 shows the multimodel mean amplitude of intraseasonal variability (calculated as 20-100-day filtered variance fields) from the historical simulation and differences between SSP585 and the historical simulation. In the historical simulation, intraseasonal precipitation generally maximizes in regions of high mean precipitation, although the maximum is slightly shifted toward the coast relative to the mean precipitation pattern (Fig. 2a). The 850 hPa zonal wind variance peak occurs just south of the precipitation variance peak. The ENP ISO OLR variance peak (Fig. 2c) occurs to the west of the ISO precipitation and 850 hPa zonal wind variance maxima (Fig. 2e). The multimodel mean intraseasonal variability fields are generally consistent with those in observations (Maloney and Esbensen, 2003) and CMIP5 models (Jiang et al., 2013). Examination of individual models, including the model spread and the magnitude of variability compared to observations, is presented in Figure 4.
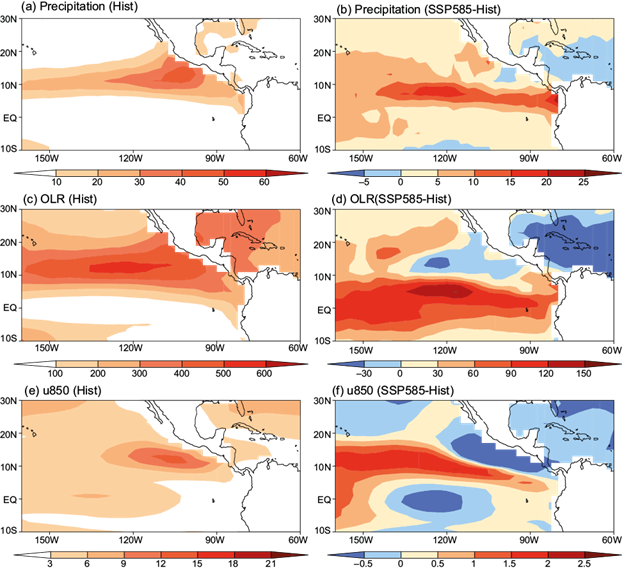
Fig. 2 Multimodel mean (from 14 CMIP6 models) spatial distribution of the boreal summer 20-100 day filtered. (a, b) precipitation (mm2 day-2), (c, d) outgoing longwave radiation (OLR; W2 m-2), and (e, f) 850 hPa zonal wind (m2 s-2) variance for the historical simulation and differences between SSP585 and historical simulations, respectively. See Figure S3 in the supplementary material for the entire tropical pattern.
Figure 2b, d and f shows the differences in multimodel mean intraseasonal variance between 2081-2100 and 1986-2005. Largely mimicking the mean precipitation changes shown in Figure 1, an increase in precipitation variance occurs between 5º and 10º N, and with a modest decrease in variance near a portion of the ENP Mexican coast. The southwestward shift of ENP ISO precipitation variance is also clearly seen in the OLR (Fig. 2d), where an opposite signed change of OLR variance occurs near the Mexican coast relative to that south of 10º N. A similar shift is also seen in the 850 hPa zonal wind variance field (Fig. 2f). While coastal precipitation variance changes are modest, reductions in the amplitude of wind variability are of greater amplitude. The relative weakening of intraseasonal wind variability relative to precipitation variability is consistent with that shown in previous studies for the MJO, which can be explained by increasing static stability of the tropical troposphere under climate warming (Maloney et al., 2019; see also Fig. S4). Interestingly, similar increases of MJO precipitation variance and weakening of MJO wind variance under global warming also occur over the Indian monsoon/Bay of Bengal region (see Fig. S3 in the supplementary material).
In order to identify the leading intraseasonal modes over the ENP in both observations and CMIP6 simulations, a CEOF analysis is conducted using the 850 hPa zonal wind and OLR. Spatial patterns of the leading CEOF from observations and the multimodel mean of the leading CEOF from individual models are shown in Figure 3 (see Fig. S4 for the pattern of the second CEOF), with the variance explained listed in the caption and on top of each figure. OLR amplitude in CEOF1 peaks between 10º-20º N in observations, with an 850 hPa zonal wind peak on its south flank, is consistent with Maloney and Esbensen (2003, 2005, 2007). The variability in this region also coincides with the ENP hurricane genesis region (see figure 1 in Maloney and Hartmann, 2000). While CMIP6 shows a similar pattern as observed, we note that the historical simulations tend to have higher variance that extends further to the west than observations. The leading EOF in SSP585 becomes slightly more diffuse and the peak amplitudes shift westward (cf. Fig. 3b, c), behavior that is possibly seen better in the difference plot (Fig. 3d, h). The amplitude of zonal wind and OLR in the leading EOF both decrease near the coast in SSP585 relative to the historical simulations. The explained variance of CEOF1 is also decreased in SSP585 relative to the historical period (e.g., 25.6 vs. 33.1%).
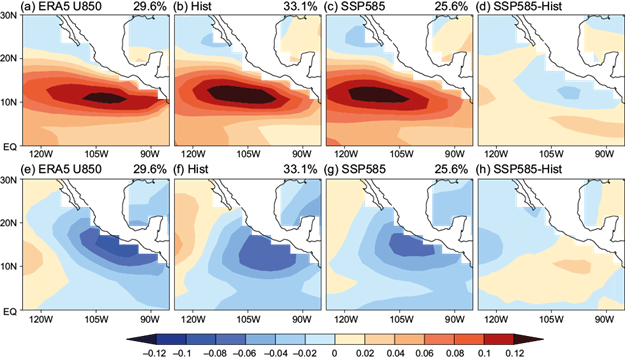
Fig. 3 Spatial distribution of the leading CEOF mode of 850 hPa zonal wind and outgoing longwave radiation (OLR) during boreal summer over the eastern north Pacific for (a, e) observations (explain 29.6% of the total variance), (b, f) mulimodel mean of the CMIP6 historical simulations (33.1% of total variance), (c, g) multimodel mean of the SSP585 simulations (25.6% of total variance), and (d, h) differences between SSP585 and historical simulations. See Figure S4 in the supplementary material for the spatial pattern of the second leading CEOF.
Motivated by Jiang et al. (2013), the fidelity in simulating the leading ENP ISO mode by each CMIP6 model is then objectively assessed by calculating the pattern correlation of the simulated CEOF1 against its observed counterpart. Pattern correlations between observed and simulated CEOF1 patterns over the ENP domain are calculated individually for 850 hPa zonal wind and OLR, and then a final pattern correlation score for a particular model is derived by averaging these two correlation coefficients. We also calculate the relative amplitude of models’ precipitation and wind to observations by computing the root mean square of the composite precipitation and 850 hPa zonal wind (shown in Fig. 5) over the domain of 10º-20º N, 95º-115º W. As shown in Figure 4, while most of the CMIP6 models produce a reasonable pattern correlation (> 0.8) relative to observations (x-axis), biases in the relative amplitude of ISO precipitation and wind (y-axis) are apparent, associated with overestimation of the amplitude of the ENP ISO 850 hPa zonal wind and underestimation of the amplitude of precipitation variability. The two models that have relatively low pattern correlations of 0.7 or less, i.e., MPI-ESM-2-HR and MPI-ESM-2-LR, are excluded from further analyses.
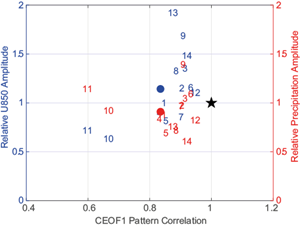
Fig. 4 The x-axis shows pattern correlation coefficients of CEOF1 between observations and CMIP6 historical simulations. The y-axes show relative composite amplitude of 850 hPa zonal wind (blue, left axis) and precipitation (red, right axis) of the models to observations averaged over the domain of 10º-20º N, 95º-115º W. The black star represents the observations and the circles represent the CMIP6 multimodel mean. The 14 CMIP6 models are indexed according to Table I.
Multimodel mean composite patterns of the remaining CMIP6 models’ precipitation, OLR and 850 hPa vector winds anomalies derived using days > 1σ in the time series of CEOF1, with a similar analysis for observations, are shown in Figure 5. Positive deviations of the index correspond to the enhanced intraseasonal convective phase in this region. In general, the CMIP6 multimodel mean shows a similar composite pattern to observations, with maximum precipitation occurring near the coast from 10º-20º N, except with smaller amplitude. As in observations, stronger ISO precipitation tends to be associated with westerly wind and negative OLR anomalies. Under global warming, the maximum precipitation anomaly tends to shift to the west, weakening the positive anomaly near the coastal region (Fig. 5c). Westerly wind anomalies also weaken with warming. The westward shift in the pattern of convection is also clearly seen in the OLR composites (Fig. 5f).
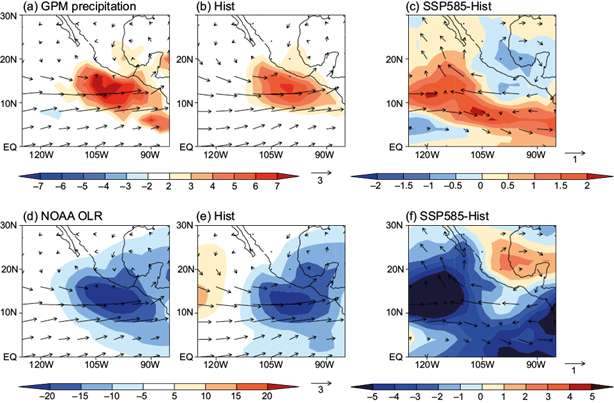
Fig. 5 Boreal summer 20-100 day filtered (a-c) precipitation (shaded, mm day-1), (d-f) OLR (shaded, W m-2) and 850 hPa wind vector (m s-1) composites based on the PC1 timeseries from (a, d) observations, (b, e) historical simulation and (c, f) differences between SSP585 and historical simulations. See Figure S1 in the supplementary material for the composites based on negative deviations of the PC1 timeseries.
We also examine changes in composite ISO precipitation and wind anomalies for each model averaged over the same domain (10º-20º N, 95º-115º W) as shown in Figure 5. In Figure 6, 10 out of 12 models show a weakening in the 850 hPa zonal wind anomalies in a warmer climate relative to present, with a multimodel mean decrease of about -4.7% K-1. ISO precipitation increase in most of the models (~1.9% K-1 in the multimodel mean), associated with the westward shift in the precipitation anomaly pattern. Note that we define the ENP ISO amplitude by computing the root mean square of the composited fields in Figure 5, and all the values have been normalized by the historical simulation and are expressed per unit global mean surface temperature warming. Results are also similar when using the standard deviation calculated from filtered fields to define the amplitude, rather than a composite analysis (not shown). Consistent with our previous studies for the global MJO (Bui and Maloney, 2018, 2019a), while ISO precipitation amplitude increases in most models with warming, wind amplitude increases at a slower rate or decreases with warming. This relationship is expected from an increase in tropical static stability with warming (Fig. S5 in the supplementary material; also see Bui and Maloney, 2019b).
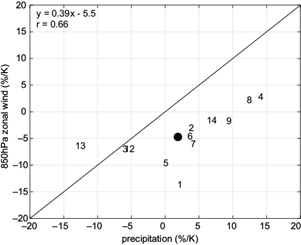
Fig. 6 Scatterplot of ENP ISO 850 hPa zonal wind amplitude (y-axis) and precipitation amplitude (x-axis) changes at the end of 21st century relative to historical simulation from 12 selected CMIP6 models averaged over the domain of 10º-20º N, 95º-115º W. All values have been normalized by the historical simulation and are expressed per unit global mean surface temperature warming (% K-1). The 12 selected CMIP6 models are indexed according to Table I. The black circle represents the multimodel mean.
4. Implications for TC genesis
To draw connections between ISO amplitude and structure changes and implications for the modulation of TC genesis in the ENP in a warmer climate, Figure 7 shows a composite for the three most important environmental variables to the intraseasonal modulation of TC genesis according to Camargo et al. (2009): mid-level relative humidity, low-level relative vorticity, and magnitude of vertical wind shear. Figure 7a-c shows the composite pattern of the 600 hPa relative humidity from observational analyses, the historical simulation multimodel mean, and the difference in SSP585 relative to the historical. ERA5 relative humidity anomalies peak within ISO convective areas (cf. Fig. 5). The CMIP6 anomalies tend to slightly underestimate the magnitude of relative humidity anomalies that are also more confined to coastal regions, with a prominent negative anomaly to the west of 120º W that is weaker in observations (Fig. 7b). Under global warming, the relative humidity anomalies become weaker near the coast and shift westward (Fig. 7c), consistent with the pattern of precipitation anomalies.
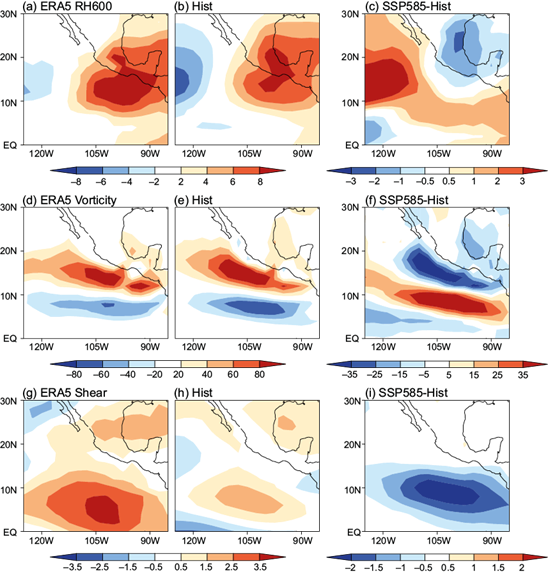
Fig. 7 Similar to Figure 5, but for composite (a-c) 600 hPa relative humidity (%), (d-f) 850 hPa relative vorticity (107 s-1) and (g-i) magnitude of vertical wind shear between 250 hPa wind and 850 hPa wind (m s-1) from (a, d, g) observations, (b, e, h) CMIP6 historical simulation multimodel mean and (c, f, i) differences between the SSP585 and historical simulations.
The 850 hPa relative vorticity field is characterized by cyclonic anomalies north of the axis of strongest wind anomalies, approximately coincident with the area of enhanced precipitation (cf. Figs. 5a and 7d-e). A band of anticyclonic vorticity anomalies occurs to the south of the axis of maximum winds, coincident with the narrow band of suppressed convection (between 8º and 10º N). Under global warming, vorticity anomalies weaken relative to the current climate (Fig. 7f), consistent with the weakening of the ISO circulation with warming. We also examine the change in composite eastern North Pacific vertical wind shear magnitude between 250 and 850 hPa levels (Fig. 7g-i). The anomalous vertical shear patterns are similar between observations and the CMIP6 multimodel mean with low shear anomalies occurring at the same location as cyclonic anomalies (cf. panels [d-e] and [g-h] in Fig. 7) with the maximum wind shear to the south (equator to 10º N). It is worth noting that the smaller magnitude of wind shear in the CMIP6 relative to ERA5 is because the field is averaged across multiple models that have peak variability in slightly different places, thus resulting in smaller multimodel mean composite amplitude. In a warmer climate, the vertical shear near the Mexico coast shows only modest changes in the region of positive vorticity anomalies (cf. panels [f] and [i] in Fig. 7), with greater reductions in anomalies to the south. In other words, both thermodynamic and dynamic changes suggest less favorable conditions during the convectively enhanced ISO phase for TC genesis in the traditional ENP TC genesis region (10º-20º N, 90º-120º W; also see their figure 1 in Maloney and Hartmann, 2000) in a future warmer climate. Individual models (not shown), as might be expected, produce noisier patterns than the multimodel means, as well as different amplitude responses, although the overall conclusions on the sense of the change are consistent with the multimodel mean.
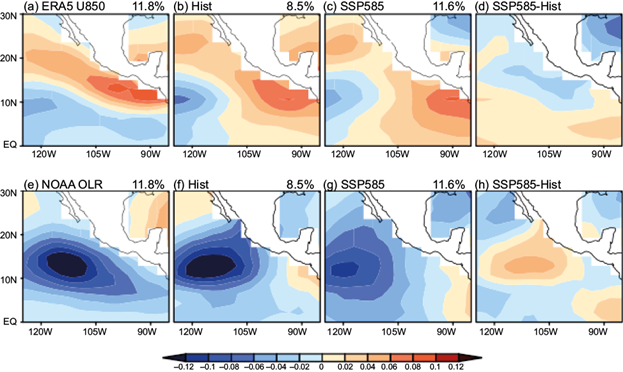
Based on the above and previous results from Camargo et al. (2009) and Jiang et al. (2012), we might expect that GPI anomalies that favor TC genesis in favored eastern North Pacific regions during the convectively active ISO phase will decrease with global warming. This is demonstrated in Figure 8, which shows the ENP ISO composite of GPI from the multimodel mean of eight CMIP6 models during the boreal summer. The multimodel mean does an excellent job capturing observed GPI variability in the TC genesis region near the Mexico coast, where positive genesis potential anomalies occur (Fig. 8a; also see their figure 1 in Maloney and Hartmann, 2000) in the region of positive precipitation anomalies (cf. Fig. 5). In SSP585, the peak of GPI tends to shift southwest, resulting in a reduction in anomalous GPI near the coast (Fig. 8c), consistent with the change in ENP ISO precipitation and wind anomaly patterns shown in Figure 5, and also the variables that go into GPI including relative humidity, vorticity, and shear shown in Figure 7.
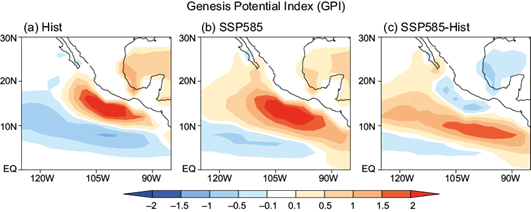
Fig. 8 Boreal summer GPI composite from eight CMIP6 models for (a) historical multimodel mean, (b) SSP585 multimodel mean, and (c) differences between SSP585 and historical.
To understand the pattern shift of GPI anomalies, we further decompose these and their changes in a warmer climate into the contributions from each environmental variable: relative humidity, absolute vorticity and magnitude of vertical shear (Fig. 9). As mentioned before, to conduct this calculation we allow two variables to vary while the third one is fixed to the corresponding annual cycle. The result of adding the three contributions calculated this way produces a similar anomaly pattern to the total field shown in Figure 8 (cf. Figs. 9a-c and 8), with a reduction of GPI anomalies near the coast with warming, and strengthening to the southwest. Both relative humidity and vorticity changes with warming are associated to the weakening GPI anomalies near the coast with warming and increase of GPI anomalies to the southwest (Fig. 9), consistent with the respective fields shown in Figure 7. The vorticity changes are also consistent with the reduction of ISO wind amplitude previously discussed. The effect of shear anomalies on GPI has a larger contribution than humidity and vorticity in increasing GPI anomalies away from the coast. The result generally highlights the importance of both dynamical and thermodynamic factors to the reduction of positive GPI anomalies during the enhanced ISO phase near the coastal region under global warming and suggests that the ISO will favor TC genesis over the region away from the coast in a future warmer climate.
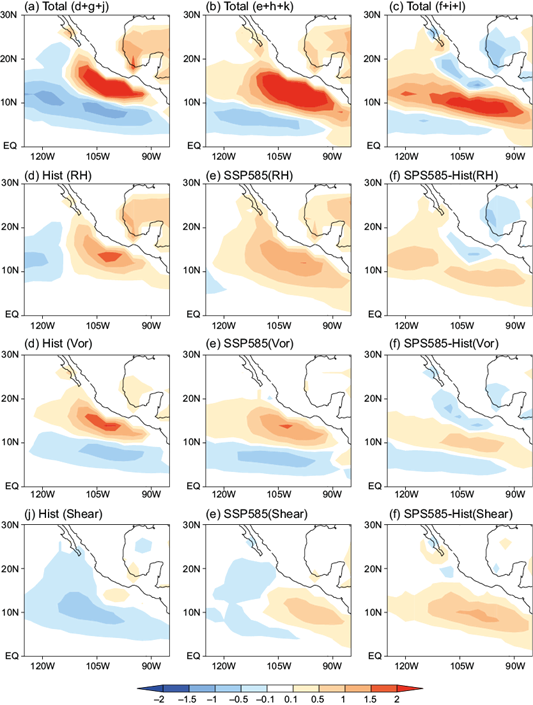
Fig. 9 Same as Figure 8, except for the contributions of the three main environmental variables (d-f) 600 hPa relative humidity, (g-i) 850 hPa absolute vorticity, and (j-l) magnitude of vertical wind shear between 250 hPa and 850 hPa to the GPI anomalies (shown in Fig. 8). The first row shows the result of adding the three components.
5. Conclusions
We have analyzed the historical and SSP585 simulations from 14 CMIP6 models to understand the change of boreal summer intraseasonal variability over the eastern north Pacific (ENP) with climate warming and its influence on tropical cyclone (TC) genesis. We specifically analyzed a genesis potential index (GPI) and its components to understand how individual genesis potential variables influence changes in GPI anomalies during ISO events with climate warming. Our primary conclusions are as follows:
In the ENP under global warming in SSP585, the CMIP6 multimodel mean shows decreases in intraseasonal precipitation and low-level westerly wind anomaly amplitude in regions near the Mexican coast (Figs. 2 and 5), although wind amplitude decreases are stronger (Fig. 6). The stronger decreases in ISO wind amplitude are consistent with those found in previous studies of the MJO in the Indo-Pacific region (Maloney et al., 2019).
The amplitude maximum for ENP intraseasonal precipitation and wind anomalies during enhanced ISO precipitation events also tends to shift southwestward in a warmer climate (Fig. 5c).
Positive ISO precipitation events are associated with weaker intraseasonal GPI anomalies near the Mexican coast with warming, and an enhancement of positive GPI anomalies to the southwest. A decomposition of the GPI anomalies into thermodynamic (i.e., relative humidity) and dynamic (vorticity and vertical shear) components was conducted to assess the importance of these factors for regulating GPI anomaly changes with warming. Relative humidity and vorticity changes during ISO events weaken positive GPI anomalies near the Mexican coast with warming and make genesis more favorable to the southwest. The impact of vertical shear anomaly changes is to favor genesis away from the coast.
The results here suggest that weakening of ENP ISO wind anomalies and a general southwestward shift of the ISO maxima in a future warmer climate would importantly impact TC activity in this region. In particular, TC genesis is projected to be less favored near the coast during ISO events and more favored to the southwest. The current study only focuses on the ISO timescale over the ENP, thus extending this analysis to examine other types of climate variability (such as with the ENSO) would be warranted. Although we found generally consistent results among models in ISO amplitude and pattern changes with warming, projected future changes still vary considerably in their details among the models (e.g., Fig. 6). Therefore, a larger ensemble of climate model simulations would help assess the robustness of our analysis. Recent studies (e.g., Sobel et al., 2019) show that aerosol cooling reduces TC potential intensity more strongly than greenhouse gases warming increase it. A more in-depth study with climate model simulations that can separate external forcing into its various components (e.g., greenhouse gases, aerosols) and natural variability (e.g., decadal variability) would be useful to clarify the impact of each forcing agent on the ISO and the regional TC activity.