


 nueva página del texto (beta)
 Inglés (pdf)
 Artículo en XML
 Referencias del artículo
 Enviar artículo por email
 Citado por SciELO
  Similares en
SciELO
Similares en
SciELO 
 Permalink
1. Introduction
Air pollution is a global problem that is principally caused by rapid demographic growth, uncontrolled urbanization, industrialization, high vehicle loads, and deforestation. These increase damage to the environment, which generates problems like ocean and soil acidification, ecosystem degradation, and threatens human health (Khaniabadi et al., 2017; Nowak et al., 2018). Emission sources can be of natural or anthropogenic origin and their adverse effects can reach local, regional, and global scales. The most common anthropogenic sources are industries, power plants, landfills, residential heating, and vehicles (Singh, 2017).
Atmospheric transport of pollutants occurs due to volatilized species and/or particles. Suspended particles (aerosol and dust) play an important role in the transport of pollutants around the environment, specifically those that have low volatility and aqueous solubility (Csavina et al., 2012). Deposition (dry or wet) of pollutants is an efficient mechanism for removing gases and particles from the atmosphere. Dry deposition is a mechanism of removal by turbulent transfer through gravitational settling onto a surface (land, water, buildings or plants) (Izquierdo and Avila, 2013). Wet deposition is dominated by two mechanisms: washout (below-cloud scavenging) and rainout (in-cloud scavenging) (Zheng et al., 2019). Dry and wet deposition vary from region to region, depending on the characteristics of air pollution (Anil, et al., 2017; Szép et al., 2017).
Suspended particulate matter in the atmosphere that contains a large variety of elements, can be deposited by wet or dry deposition, which together are called bulk deposition. Bulk deposition occurs when the collector sampler combines dry and wet deposition (Ma et al., 2019), the collector remains open throughout the sampling period. Bulk collectors, suitably located for daily inspection, can give results that are only 10-30% higher than those obtained with wet only collectors (Granat et al., 1996).
The deposition of major ions (Na+, NH4 +, K+, Ca2+, Mg2+, Cl−, NO3 −, SO4 2−) and metals has been studied in many urban and rural areas around the world (Facchini Cerqueira et al., 2014; Moreda-Piñeiro et al., 2017; Wright et al., 2018; Wu et al., 2018; Sharma and Kulshrestha, 2020). In the state of Nuevo Leon (NL) in northeastern Mexico, the Metropolitan Area of Monterrey (MAM) is one of the most industrialized, populous and contaminated cities in Mexico and Latin America (González et al., 2017). The accelerated industrial growth, together with the lack of urban planning, have resulted in serious air pollution problems in the MAM, mainly from ozone and particulate matter (Valdez Cerda et al., 2011). A few studies on rainfall deposition characteristics and mechanisms have been conducted in the recent past, yet they have only considered one sampling point within the MAM (Ramírez-Lara et al., 2016; Céron et al., 2018). The MAM does not have monitoring stations for wet or dry deposits; in fact, the only official network for monitoring atmospheric deposits in Mexico is located in the metropolitan area of Mexico City.
No study has been conducted so far to determine the possible dispersion of pollutants to rural areas surrounding the MAM. Moreover, there are no documented studies including as many monitoring points for this area of the country as the present study does.
The citrus region of the state, which is located in south-central NL, borders with the MAM. It is a region of great economic and cultural importance for the northeast of Mexico, where orange, tangerine and grapefruit have been produced for more than one hundred years and currently ranks fourth nationally as a citrus producer (Pantoja-Zaval and Flores-Vichi, 2018). The evaluation of elemental deposition and their possible sources of origin within the MAM and surrounding areas, specifically the citrus region, will aid in the improvement of air quality standards and the identification of possible effects on rural areas. In the present study, nine sites including urban and rural areas along an urbanization gradient were monitored during a year-long period. The main objectives were (1) to describe the characteristics of chemical element deposition by site and season and (2) to identify the deposition patterns among the nine monitoring sites and the comparison between urban and rural areas.
2. Materials and Methods
2.1 Study area
This work was carried out in the MAM which is a highly urbanized area (4,106,054 inhabitants) (SEMARNAT, 2016), as well as a two rural areas in NL (Linares and Allende). The MAM has a semidry and warm climate, with an annual average precipitation of 623 mm, mean temperature of 32 ºC, with extreme temperatures during summer (40 ºC) and winter (-2 ºC) (Gobierno del Estado de Nuevo León, 2016). The urban areas are represented by different industrial activities such as metallurgy, chemistry, petrochemistry, pharmacy, textiles, ceramics, tannery, electronics, automobiles, aviation, building materials, machine manufacturing, iron and steel foundries, paper, asbestos, cement and wood (Valdez Cerda et al., 2011). The rural areas are classified as touristic and agricultural citrus areas (Alcalá Escamilla and López López, 2017). In the rural areas the climate is semi-warm and subhumid, with an average of 749 mm of summer rainfall; annual average temperature of 22 ºC in one site (Linares) and 15.8 ºC in the other (Allende), with an extreme maximum of 40.1 ºC and an minimum of -2.4 ºC (INAFED, 2010).
The MAM is composed of 13 municipalities, only 6 of which were sampled in this study (Santa Catarina, General Escobedo, Monterrey, Guadalupe, Cadereyta Jiménez, and San Nicolás). The municipalities of the rural area considered are Allende and Linares. The sampling points in the urban area (MAM) were placed within the environmental monitoring stations belonging to the state government of NL. Sampling points in the rural areas were placed within the educational facilities of the Autonomous University of Nuevo Leon. Sampling points in the rural areas were located near agricultural citrus orchards. Table I shows the location of the monitoring sites, the altitude, and the distance of the monitoring site to downtown Monterrey, considered as the central point from which the sampling starts along the urbanization gradient. Sampling within the metropolitan area was chosen with a preferential trend from the center to the south of the metropolitan area, taking only one point to the north (General Escobedo), in order to connect the MAM with the southern region of the state of Nuevo Leon, through the National Highway 85, which is an important access road within the state and for the MAM. It connects the south of the country with the MAM, allowing for important commercial exchange in the area and thus leading to a high load of vehicular traffic. The selected rural areas are regions of commercial importance for the state (Allende and Linares). In addition to the relevance of their agricultural and handicraft products, these are regions that have recreational areas for the population living within the MAM, which are frequently visited on weekends or holidays. The locations of each monitoring site and the municipalities that were considered to carry out the present study are shown in Figure 1.
Table I Locations points of the monitoring sites, altitude, and distance to the MAM downtown.
| Point number on the map | Names of the monitoring sites | Coordinates | Altitude (m) | Distance to downtown (km) | |
| Latitude (W) | Longitude (N) | ||||
| 1 | Escobedo | 25º48”02’ | 100º20”39’ | 528.61 | 14.71 |
| 2 | Universidad | 25º43”45’ | 100º18”39’ | 516.97 | 6.44 |
| 3 | Obispado | 25º40”29’ | 100º20”30’ | 589.01 | 3.26 |
| 4 | Pastora | 25º40”03’ | 100º14”53’ | 495.60 | 6.18 |
| 5 | Pueblo Serena | 25º34”33’ | 100º14”54’ | 611.39 | 12.30 |
| 6 | Santa Catarina | 25º40”32’ | 100º27”53’ | 693.71 | 15.63 |
| 7 | Cadereyta | 25º36”02’ | 99º59”44’ | 332.98 | 32.51 |
| 8 | Allende | 25º17”15’ | 100º00”33’ | 438.92 | 52.16 |
| 9 | Linares | 24º47”45’ | 99º32”28’ | 379.53 | 124.15 |

2.2 Sampling methods
Deposition samples were collected with bulk samplers at each of the nine monitoring sites. The bulk samplers used in this study are described in Loya-Gonzalez et al. (2020). Three samplers were placed for each selected site on the roof of the environmental monitoring station with the aim of obtaining replications for each site. The monitoring period was a year-long from 30 January 2019 to 30 January 2020. The collection of samples was carried out after each rain event, considering a singular rain event with eight hours of dry period between events (Yáñez-Díaz et al., 2014).
The pH and electric conductivity of the collected volume of rainwater was measured in situ using a digital meter Oakton 007072-75. A volume of 125 mL of rainwater was then transferred to a sterilized polyethylene bottle and were immediately placed in an ice chest for transport to the laboratory for further analysis. Samplers were then rigorously rinsed with deionized water several times, and then were placed again at their fixed sampling points. Rain events in which collectors did not obtain a minimum sample volume of 125 mL for chemical analysis, were discarded.
2.3 Chemical analysis
All rainwater samples were first filtered through Whatman® No. 42 filters to reduce the volume of suspended solids and to minimize risks of obstruction on the instrument suction system. Following the US EPA 3010A method, 50 mL of the sample were taken for acid digestion, in order to eliminate the organic matter present and thus proceed to the measurement of the selected elements (Ca, K, Mg, Mn, Zn, Fe, Cu, Ni, Pb, Cd and Cr). The rest of the sample was kept refrigerated at 4 ºC for further analysis. For samples and solution standard preparation, 18.2 MΩ water and ultrapure HNO3 were used. A mixed calibration solution-stock was prepared from single element solutions by Accu Standard in 1% (v/v) HNO3. This stock was diluted for calibration of the MP-AES in the range 1 - 20 mg L-1 for Ca and 1 - 50 mg L-1 for K and Mg. The determination of metals was performed by the procedure described in Loya-Gonzalez et al. (2020). Sample analysis was carried out on an atomic emission spectrometer 4200 MP-AES Agilent Technologies. The analytical cycle of the 4200 MP-AES thus consisted of 30 seconds sample uptake, 15 seconds to stabilize, then reading elements at preselected wavelengths and finally rinsing for 30 seconds with 1% (v/v) HNO3. The regression analysis was performed for analytes, for which the result suggested acceptable data quality (R2=0.996; p≤0.01).
2.4 Statistical analysis
Deposition was calculated for each event as follows: multiplying the concentration of the measured element (mg L-1) obtained in the spectrophotometer by the volume (L) of sample collected, divided by the area occupied by the collector (0.0398 m2), then multiplied by a factor of 25 to bring everything to a square meter.
To estimate the annual accumulated deposition at each sampling site, a Shapiro-Wilk (p=95%) test was carried out to verify the assumptions of data distribution; Cu, Ni, Mn, Ca and K were found to follow a normal distribution, while Zn, Fe, Cd and Mg did not. Therefore, to compare monitoring sites, and urban with rural areas a T test was applied for the first group of elements and a Mann-Whitney U Test (p=95%) for the rest.
To determine differences in deposition between monitoring sites, rainfall events, seasons of the year and areas (rural versus urban) a Kolmogorov-Smirnov test (p=95%) was applied, finding that data did not follow a normal distribution. Thus, the use of the Kruskal-Wallis test was chosen (p=95%), when significant differences were found a post hoc of Kruskal-Wallis was applied to identify the couples that differed between monitoring sites, rainfall events and seasons. A Spearman correlation analysis was performed to find the relationships between the elements and thus, try to understand the possible sources of the elements measured.
A factor analysis by principal components (PCA) was selected and applied to the complete data set to reduce number of variables and gain insight. PCA was also carried out for each season of the year, in order to determine whether elements that make up the main components changed with seasons (González et al. 2018). The statistical analyses were performed using the SPSS® software (Statistical Package for Social Sciences, version 22 for Windows, SPSS Inc., Chicago, IL) and the RStudio© software (RStudio, version 1.2.5033 for Windows, 2009-2019, RStudio, Inc.).
2.5 Enrichment Factor (EF)
Enrichment Factors (EF) have been used since the 70's to discriminate between oceanic, terrestrial, and potentially other elemental sources in the atmosphere of remote regions (Ediagbonya 2016). Considering that the existing variation in the concentration of a given element on the environment is due to its natural lithological composition, the presence of it in quantities greater than its concentration in the crust suggests the influence of anthropogenic activities. Therefore, the EFs are calculated by normalizing the values found in the atmosphere to a conservative element (regularly Al and Fe for metals and Ca for larger ions), which is one that will be influenced almost exclusively by sources from the crust (Cable and Deng, 2018).
With the aim of knowing the possible sources of origin of the elements analyzed in the present study, the EF was calculated taking Fe as a conservative element for metals and Ca for the larger ions (Ca, K and Mn). The EF was calculated based on Equation 1.
where (X/Fe)sample is the ratio of bulk deposition of a given element in the sample, while (X/Fe)crust is the concentration ratio of the given element in the continental crust; elemental concentrations in the crust were obtained from Mason and Moore (1982). For the sample ratio, the Fe and Ca average concentrations for the Linares site was used as reference concentration due to the minor presence of sources of contamination near to the monitoring site.
EF values close to one for an element suggest that the crust material is a major source of this element. In practice, however, elements with values in the range 1 to 10 are not enriched in the atmosphere, implying a source from the crust. Elements with EF values in the range of 10 to 500 are considered moderately enriched, indicating higher concentrations of a particular element in atmospheric samples than would be expected from crust material. Finally, EF values higher than 500 showed highly enriched conditions, indicating strong anthropogenic contribution (Wu et al. 2018).
2.6 Backward trajectories
To identify the possible origin of the air masses that reached the rural areas (Linares and Allende) during the rain events analyzed for the period of January 2019-January 2020, air mass trajectories were tracked, taking as reference the rainfall events during two seasons of the year (winter and summer) and a monitoring point in the sites, taking into account 24 h before the rain event and the prevailing conditions during the rain event. The Hybrid Single-Particle Lagrangian Integrated Path Model (HYSPLIT) was used to determine back trajectories, based on 1º x 1º meteorological data (GDAS-Global Data Assimilation System) at 100, 500 and 1000 Above Ground Level (AGL).
3. Results and Discussion
3.1 Precipitation
A total of 422 rainwater samples were collected in 32 rain events totaling 448 mm of rainfall in the MAM, 532 mm in Linares and 782 mm in Allende during the one-year period (Fig. 2a). Most of the rain events sampled correspond to accumulated precipitation of less than 50 mm (90%); the highest precipitation event of the year corresponded to tropical storm Fernand (3-6 September 2019). This is a consistent finding at study sites located in semi-arid areas. Nevertheless, the average accumulated precipitation for these three areas in the last 30 years is higher than found in the present study for 2019, in which rains were scarce and tropical storm Fernand favored the increase in the annual accumulated precipitation (CONAGUA, 2020). The months with the highest number of rainfall events were March, September, and October. The monthly accumulated precipitation was higher in September, due to the influence of tropical storm Fernand. The average of a rain event was 28.62±2.57 mm, with a minimum value of 1.18 mm (site Linares) and a maximum value of 251.51 mm (all sites during Fernand storm). Fall was the season with the highest precipitation volume registered in this study, which is consistent with the regular rainy season for the region’s climate type.

Fig. 2a Annual accumulated precipitation by site, including the average annual accumulated precipitation in the MAM.
The trends of the monthly accumulated precipitation by monitoring site and the average monthly temperature can be seen in Figure 2b. No rain events are shown in the month of December because rain events only occurred between December 21 and 30. However, the rain recorded on those days was below 0.1 mm, on average, which was not enough to perform the chemical analysis. For this reason, no data points are presented for the month of December. The dominant annual winds for the MAM are from the east-northeast and southeast (Loya-Gonzalez et al., 2020), and for the rural areas from the east and southeast.

3.2 Electrical conductivity and pH
Figure 3 shows the average pH and electrical conductivity (EC) by month for each monitoring site, the minimum pH value observed was 5.90 (site Pastora) and the maximum 9.96 (site Linares), with an average of 7.15 ± 0.02. A higher value than the widely accepted background rainfall pH of 5.6 (Charlson and Rodhe, 1982), was to be expected because the predominant soil type in the region is Calcisol. The results obtained are consistent with those reported by other studies for the MAM (Ramírez-Lara et al., 2016) as well as with those reported by other studies showing that rainfall has alkaline pH in this region (Alves et al., 2018). The lowest pH values (5.90) were observed during the spring and the highest values (9.96) during the fall. The minimum values differ from a previous study that reported the lowest values in summer (Ramírez-Lara et al., 2016).

Fig. 3 a) pH and b) electrical conductivity (mS/cm) monthly mean values for each monitoring site. Within each graph, asterisks (*) denote significant (p<0.05) differences among sites in pH or electrical conductivity according to the Kruskal-Wallis test.
The EC shows an average of 153.96 ± 6.83 μS/cm, with a minimum value of 10 μS/cm (during tropical storm Fernand in September for all sites) and a maximum value of 814 μS/cm (during May in site Pastora). These values display a wide range, probably due to the prevailing atmospheric composition before and during a rainfall event, with changes depending on atmospheric dynamics. In contrary with pH, EC shows lowest (10 μS/cm) values during the fall, coinciding with the rainy season for the state. This may be due to a possible dilution of the ions present in the rain due to the greater precipitation in this season. Highest (814 μS/cm) electrical conductivity values were observed during spring, which also coincides with a season of scarce rain, with an exception for March which presented a high number of rain events.
The results of the Kruskal-Wallis tests applied to all the data (including all samples) indicate that the pH values did not show significant differences among the monitoring sites (p=0.86) nor between the urban and rural areas (p=0.500), but there were significant differences (p≤0.05) for the season of the year as well as the rainfall events. Post hoc Kruskal-Wallis test showed significant differences in pH values for the seasons, all seasons differ from each other (p <0.05), except for summer compared to autumn. In addition, significant differences between rain events were observed, where the events that stand out are March 28, April 1, and September 10, 2019. This may be due to the fact that during the months of March and September the amount of precipitation was greater than for the rest, therefore a lower pH value was found during these events due to a dilution effect.
Significant differences in EC values were observed (p≤0.05) between monitoring sites and rainfall events except for March and July, as can be observed in Figure 3 (b). Post hoc Kruskal-Wallis test showed significant differences for EC values between rainfall events, and the tropical storm Fernand event was significantly different to the rest. Also, monitoring sites Santa Catarina and Obispado were different from Allende, because Allende is a rural site with less industrial activity or traffic compared to Obispado and Santa Catarina sites in the MAM. Significant differences were observed between urban and rural areas due to different sources, with less anthropogenic emissions in rural areas. Post hoc test for seasons showed differences for all seasons, except for the combination spring-summer, in which the precipitation amount was scarce, the temperature was higher, and calm winds were more prevalent. In contrast, winter and autumn present more precipitation dates and amounts, stronger winds, and are influenced by the passage of cold fronts.
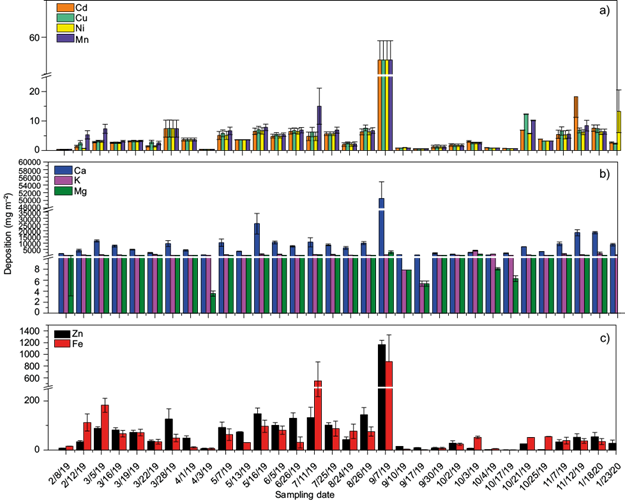
3.3 Individual rainfall event deposition analysis
The individual rainfall events were analyzed in order to detect differences among them and monitoring sites. The Kruskal-Wallis test shows significant differences for all elements analyzed between rainfall events and per monitoring site (p ≤ 0.05). Likewise, rainfall events show significant diferences between the urban and rural areas for Cd, Fe, Ni and Ca (p≤0.05), but not for Zn (p=0.654), Cu (p=0.296), Mn (p=0.579), K (p=0.537) and Mg (p=0.094); the post hoc Kruskal-Wallis test performed for rainfall events found that those corresponding to tropical storm Fernand showed differences in all elements with respect to other rainfall events. Results of a post hoc test between monitoring sites are shown in Table II. Remarkably, Fe in the Linares site was different from Universidad, due to Linares site being a rural site surrounded by natural vegetation. On the other hand, Universidad site is very close to emission sources like the metallurgical industries. Also, other sites (Escobedo, Santa Catarina and Pueblo Serena) inside the MAM were different to Universidad site in terms of Fe deposition. This can indicate that these sites were not influenced by the emission sources that affect the Universidad site. Aditionally, Linares site shows differences in Zn and Ca deposition with respect to the urban sites, and the reason why concentrations in Linares were used as baseline concentrations in the calculation of EF. Figure 4 shows the distribution of the average deposition by each rainfall event. It should be noted that deposition increased on September 07, due to tropical storm Fernand.
Table II Results of Post hoc Kruskal-Wallis test with Bonferroni correction for the elements that show significant differences between monitoring sites.
| Site 1-Site2 | Element | Test statistic | Adj. Sig. |
| Linares-Allende | Zn | 85.267 | 0.005 |
| Linares-Universidad | Zn | -107.085 | 0.001 |
| Escobedo-Universidad | Zn | -102.496 | 0.012 |
| Santa Catarina-Universidad | Zn | -99.922 | 0.010 |
| Santa Catarina-Allende | Cd | 98.761 | 0.010 |
| Linares-Universidad | Fe | -112.157 | 0.000 |
| Escobedo-Universidad | Fe | -109.321 | 0.005 |
| Santa Catarina-Universidad | Fe | -99.674 | 0.010 |
| Pueblo Serena-Universidad | Fe | -84.181 | 0.048 |
| Santa Catarina-Universidad | Cu | -88.392 | 0.047 |
| Santa Catarina-Allende | Ni | 88.492 | 0.019 |
| Escobedo-Allende | Ni | 85.512 | 0.048 |
| Escobedo-Allende | Mn | 88.096 | 0.034 |
| Escobedo-Universidad | Mn | -94.387 | 0.034 |
| Linares-Allende | Ca | 88.599 | 0.004 |
| Linares-Cadereyta | Ca | 111.044 | 0.001 |
| Linares-Universidad | Ca | -124.615 | 0.000 |
| Santa Catarina-Pastora | K | 95.85 | 0.005 |
| Pueblo Serena-Pastora | K | 89.856 | 0.006 |
| Escobedo-Universidad | Mg | -110.089 | 0.004 |
| Linares-Universidad | Mg | -108.923 | 0.000 |
| Santa Catarina-Universidad | Mg | -95.823 | 0.018 |
| Pueblo Serena-Universidad | Mg | -94.032 | 0.012 |
Asymptotic meanings are shown (two-tailed tests). The significance level is 0.05
3.4 Annual accumulated element deposition
The average annual accumulated deposition of the elements analyzed in this study is shown in Table III. The average fluxes (mg m-2 year-1) for all monitoring sites are placed in the following descending order Ca> K> Mg> Fe> Zn> Mn> Cu> Cd> Ni. It should be noted that lead and chromium measurements were carried out finding concentrations below the detection limit of the method used, for which they were not quantifiable.
Table III Average annual accumulated deposition (mg m-2 year-1) by chemical elements.
| Elements | Mean | EE | SD | Minimum | Maximum | Median |
| Ca | 202871.38 | 18996.97 | 56990.92 | 124959.89 | 291503.29 | 188566.57 |
| K | 10062.34 | 2041.42 | 6124.25 | 2884.37 | 20138.38 | 10415.87 |
| Mg | 5406.17 | 1920.06 | 5760.17 | 1538.20 | 19696.12 | 3528.58 |
| Zn | 2395.98 | 240.52 | 721.55 | 1737.52 | 4078.08 | 2227.54 |
| Fe | 2640.22 | 992.96 | 2978.88 | 538.45 | 8686.32 | 1375.04 |
| Mn | 151.49 | 15.33 | 46.00 | 101.57 | 239.38 | 140.01 |
| Cu | 136.34 | 10.02 | 30.06 | 102.81 | 199.30 | 132.69 |
| Cd | 134.09 | 14.17 | 42.50 | 97.29 | 212.41 | 123.02 |
| Ni | 131.15 | 10.69 | 32.07 | 95.90 | 195.60 | 126.79 |
The total number of data was nine for all the elements.
SD= standard deviation.
EE= standard error.
The Mann Whitney U test showed no significant differences between the nine monitoring sites for the annual accumulated deposition of Zn, Fe, Cd and Mg (p=0.317 for all elements). Also, the Mann-Whitney U test shows no significant differences between the urban and rural areas in the annual deposition for Zn (p = 1), Fe (p = 0.333), Cd (p = 0.222), and Mg (p = 0.889). In turn, the T test applied to the rest of the elements (Cu, Ni, Mn, Ca and K) showed significant differences between monitoring sites (p≤0.05 for all elements) and no differences when urban and rural areas where compared, K (p = 0.115), Cu (p = 0.096), Mn (p = 0.052), Ni (p = 0.097) with exception of Ca (p = 0.017). González et al. (2016) have shown that high concentrations of Ca are found in the MAM emitted by local construction industries and the exploitation of rich deposits of Calcite.
The trend of the annual accumulated deposition by monitoring site and element is illustrated in Figure 5. Notice that the annual deposition trend of metals is similar between monitoring sites, despite the great difference among the urbanization characteristics of sites and distance between them. Rural areas may be connected to the air basin of the MAM due to similarities in metal composition. Despite the fact that Fe and Zn deposition are higher at the Universidad site, the Mann Withney U test does not detect significant differences between this site and the rest, as previously mentioned. The high value of Fe and Zn may be due to the proximity of the Universidad site to metallurgical industries, that are one of the most important industrial activities in the region. In a previous study it was found that Fe was one of the main elements deposited via atmosphere at Universidad site, which was also determined in this study (Céron et al., 2018).

Fig. 5 Element annual average deposition by monitoring site. a) Cd, Cu, Ni and Mn, b) Zn and Fe, c) Ca, K and Mg.
It was expected to find the highest presence of Calcium due to the geochemical origin of the region. The predominance of Calcium in wet deposition flows has already been reported in a previous study (Ramírez-Lara et al., 2016), where it was concluded that Calcium suggests a significant contribution from the earth’s crust, which is reasonable because of the Calsisol soils dominant type in the MAM. This can also be related to the neutral pH found in this study as we can see in Figure 3. Moreover, industrial activity or exploitation of quarries are an important activity in the MAM, as already mentioned. The high presence of Zinc may be due to local industrial emissions sources and traffic within the urban area, that could even be affecting rural areas as well. A recent study reports that in wet deposition flows, the Zinc values may be relatively higher due to major solubility compared to the other chemical species (Siudek and Frankowski, 2017).
In order to know the possible origin of the elements studied, an Enrichment Factor (EF) was calculated taking as conservative elements Fe for metals and Ca for the major ions, the results of EF by each site are shown in Table IV. It can be observed that K and Mg showed values lower than one, so these elements are related to crustal material sources. In other hand, Mn shows values between 1 to 10 for all the sites, which is also related to crustal/soil material, but not for the Universidad and Santa Catarina sites (16.75 and 10.76 respectively), which may indicate a slight enrichment for the element in these sites of the MAM. The highest EF values were reached by Zn and Cd in all the sites, which are in a range greater than 500 EF values, which indicates a highly enriched condition, due to human activities. Finally, in a moderately enrichment value was found for Cu and Ni (values ranged from 50 to 210) for all sites, due to a certain antropogenic influence. The enrichment factor for Fe and Ca could not be obtained because these elements were selected as a conservative element for all calculations, however, it can be highlighted that during the post hoc tests of the deposition values per event compared between sites it was observed that the deposition of Fe and Ca in Linares was significantly different and lower than the Universidad site for example, which is strongly influenced by antropogenic emissions, as explained in section 3.3 of the manuscript.
Table. IV Enrichment Factors (EF) for each site by element, considering as conservative elements Fe (for metals) and Ca (for major ions).
| Monitoring site | Enrichment Factors (FE) | ||||||
| Zn | Cd | Cu | Ni | Mn | K | Mg | |
| Allende | 984.17 | 22622.82 | 82.85 | 59.63 | 5.09 | 0.10 | 0.03 |
| Linares | 918.66 | 23707.35 | 90.59 | 61.25 | 5.24 | 0.22 | 0.04 |
| Universidad | 2589.76 | 22661.39 | 230.74 | 63.74 | 16.75 | 0.43 | 0.25 |
| Escobedo | 1109.85 | 22844.67 | 98.24 | 59.63 | 5.17 | 0.09 | 0.05 |
| Obispado | 1682.87 | 28123.97 | 209.23 | 63.76 | 10.01 | 0.40 | 0.17 |
| Pastora | 1342.14 | 23017.24 | 121.38 | 59.86 | 9.55 | 0.72 | 0.18 |
| Santa Catarina | 1540.25 | 22775.78 | 121.88 | 130.56 | 10.76 | 0.16 | 0.10 |
| Pueblo Serena | 1306.32 | 31300.28 | 87.57 | 59.63 | 7.95 | 0.13 | 0.07 |
| Cadereyta | 1273.91 | 22769.32 | 104.19 | 62.43 | 5.06 | 0.07 | 0.04 |
Note: The average concentrations at Linares site was considered for the calculation of the sample fraction, the concentrations of elements in the crust was obtained from literature.
3.5 Distribution patterns of elements deposition and PCA analysis
With the purpose of recognizing distribution patterns of the elements through the monitoring sites and the possible source from which they come from, the correlation between the elements was analyzed and a factorial analysis of reduction of dimensions by principal components was used. In pollution analysis, the correlations between two metals regularly indicates that these elements come from the same source when the correlation is positive, while a negative correlation shows that they come from different sources (Naifar et al., 2018; Chen et al., 2019). The correlations showed to be significant between the elements analyzed, finding a high positive correlation for Cd-Cu, Cd-Ni, Cd-Mn, Cu-Ni, Cu-Mn and Ni-Mn. In addition to this, the rest of the elements showed medium to low positive correlations, as observed in Table V. Also precipitation amount shown a highly positive correlation with all the metals (at 0.78 to 0.98).
Table. V Spearman correlations coefficients for the bulk deposition of chemical elements (high correlations >0.8 are shown in bold).
| PREC | Zn | Cd | Fe | Cu | Ni | Mn | Ca | K | Mg | |
| PREC | .759** | .989** | .364** | .913** | .986** | .855** | .782** | .272** | .517** | |
| Zn | .731** | .575** | .739** | .732** | .778** | .664** | .311** | .501** | ||
| Cd | .355** | .905** | .977** | .857** | .783** | .287** | .530** | |||
| Fe | .406** | .346** | .605** | .476** | .435** | .461** | ||||
| Cu | .900** | .881** | .803** | .424** | .653** | |||||
| Ni | .844** | .790** | .259** | .50** | ||||||
| Mn | .796** | .461** | .692** | |||||||
| Ca | .475** | .618** | ||||||||
| K | .735** | |||||||||
| Mg |
** Correlation is significant at the 0.01 level (2 tails).
PREC= precipitation amount
Fe is poorly correlated with the rest of the elements, as Fe regularly comes from materials in the earth’s (Céron et al., 2018) this can be the reason of the poorly correlation, but in this study some sites are very close to metallurgic industries and others are in non industrial regions, due to the high differences in emission sources between the monitoring sites is possible that Fe was weakly correlated with other metals. The rest of the elements that showed strong correlations come from common anthropogenic sources, such as industrial and vehicular emissions. Depositions of Cd, Cu and Ni are attributed in various studies to the coal industries (Chen et al., 2019; Chia-Te et al., 2019), which is not applicable to this study. However, the metallurgical industry is one of the main activities carried out within the MAM and it should be the most likely source of emission for these highly correlated elements (Valdez Cerda et al., 2011; Céron et al., 2018; González et al., 2017). Mn has been attributed to industrial sources; reports showed that the presence of Mn in the atmosphere is related to metal-mechanical industries. As already mentioned, the MAM has extensive metallurgical industrial activity that can contribute Mn emissions (Quiterio et al., 2004; Zhou et al., 2014; González et al., 2017).
PCA was applied to identify which elements have the greatest influence on deposition. Metals are grouped in the first component, explaining most of the variance of the phenomenon studied. The matrix used for the PCA analysis consisted of 422 observations and 11 variables. Components with axis in values >1 were selected, from which two components were obtained, together explaining 74.88% of the total variance. The load graphic shows the grouping of elements within the two main components obtained, to explain deposition in a simple way (Figure 6).

Fig. 6 Load graph for the PCA analysis, elements in each principal component are indicated in red circles.
The CP1 has the greatest weight on the variability of the data. It explains 58.49% of the variance and it is made up of metals such as Cu, Zn, Ni, Mn and Cd. This component suggests that the origin of these elements can be related to vehicular and industrial emissions (McKenzie et al., 2009; Céron et al., 2018; González et al., 2017). One important aspect to address for this group, is the fact that they represent the rural area as well as the urban area. Therefore, it can be inferred that there is an influence of pollution across the urban gradient, affecting the surrounding rural areas which are connected by National Highway 85 -rural monitoring sites (Allende and Linares) are located at 1.66 and 0.8 km from the highway 85, respectively-. The CP2 which explains 16.38% of the variance, is made up of CE, pH and K, and can be associated with the neutral pH behavior of the rain samples, since to some extent it was somewhat constant for all sites. The rest of the elements do not seem to have such a dominant effect on the distribution of the variance. To support the precise influence between the urban and rural areas in the transport of substances that can be deposited, a study on backward wind trajectories was carried out for both rural areas, Linares site (Fig.7a and 7b) and Allende site (Fig. 8a and 8b) during the winter and summer. No backward trajectories are shown for the MAM since Loya-Gonzalez et al. (2020) reported that the MAM is an emitter source rather than a receiver site.

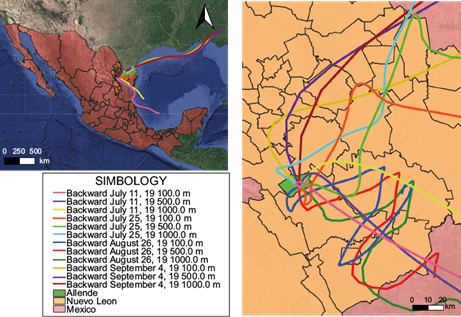
Fig. 7a Air mass backward trajectories at 100, 500, and 1000 m AGL for Linares site, for all winter collected rainfall events.

Fig. 7b Air mass backward trajectories at 100, 500, and 1000 m AGL for Linares site, for all summer collected rainfall events.
Figure 7a shows the backward wind trajectories (48 h) for all events collected during winter at the Linares site, at three different heights above ground level (100, 500 and 1000 m). Notice that most of the trajectories do not cross the MAM, only for 12 February 2019 to 100 AGL, the wind that came from the Pacific Ocean, entered through the Santa Catarina municipality, crossed the northern part of the MAM, then went down through the municipalities of Dr. González, Cadereyta Jiménez, General Terán, Montemorelos, finally reaching Linares. The dominant winds came from the north (USA), but they went through the eastern part of the state without crossing the MAM. Some winds also came from central Mexico or the Gulf of Mexico, entering mainly through the neighboring state of Tamaulipas and reaching Linares, which is located on the border between the state of Nuevo Leon and Tamaulipas.
The backward air mass trajectories (48 h) during summer are presented in Figure 7b, and represent all rainfall events collected at the Linares site during this season. Notice that most of the winds come from the southern part of the Gulf of Mexico. Only the trajectory on September 4, 2019 which corresponds to tropical storm Fernand, came from the northern part of the Gulf of Mexico, winds that had an origin near New Orleans and Atlanta. As can be seen, none of the trajectories crossed the MAM before reaching Linares; the only municipality of the MAM that is within the route of the summer trajectories is Cadereyta Jiménez where an oil refinery is located.
The backward air mass trajectories (48 h) at the Allende site for all the events collected during winter, are presented in Figure 8a, show that most of the winds come from the center of the country; only on 8 February 2019 the winds came from the north, crossing the northern of the State of Sonora and Chihuahua, until reaching Allende, without crossing the MAM. Only the trajectory of 5 March 2019 at an AGL of 500m, completely crossed the MAM from the northernmost part in Apodaca municipality and left through the municipality of Santiago, reaching Allende.

Fig. 8a Air mass backward trajectories at 100, 500, and 1000 m AGL for Allende site, for all winter collected rainfall events.
The backward air mass trajectories (48 h) at the Allende site for all the events collected during summer, are presented in Figure 8b, show that most of the winds come from the north (USA), especially during July and September. Also, these trajectories crossed the MAM before reaching Allende. On the other hand, during August the winds preferentially come from the Gulf of Mexico, entering Allende from the municipalities of Linares and Montemorelos. Therefore, the MAM can influence the presence and concentration of elements found at the Allende site, especially during summer. In contrast, little or almost no influence of the MAM at the Linares site can be confirmed for the seasons analyzed.
3.6 Seasonal variation in element deposition and PCA analysis
Seasonal deposition was analyzed to determine the influence of seasonality on deposition behavior for the chemical elements during the studied period, as seen in Figure 9. Deposition of Zn and Fe was higher during autumn, an increasing trend observed in the deposition of these elements from winter to autumn. Similarly, deposition of Cd, Cu, Ni and Mn increase from winter to autumn, reaching maximum values during autumn. In contrast, deposition of K is largest in winter and decreases in the rest of the seasons. Finally, Ca and Mg show a maximum in autumn and remain fairly constant throughout the other seasons.
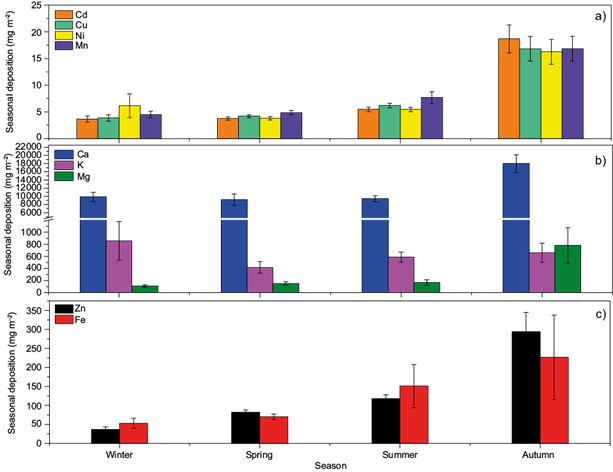
Fig. 9 Seasonal variation of deposition (mg m-2) of a) Cd, Cu, Ni and Mn, b) Ca, K and Mg, and c) Zn and Fe.
In the case of deposition variability between seasons, the Krusakall-Wallis test shows significant differences for all elements (p≤0.05) except for Fe (p=0.444). Post hoc tests between seasons and differences between couples of seasons for each element are shown in Table VI. Results show that the spring-autumn, spring-summer, and winter-autumn pairs present the largest differences for all elements.
Table VI Results of Post hoc for Kruskal-Wallis test with Bonferroni correction for the elements that show significant differences between seasons.
| Season 1- Season 2 | Element | Test statistic | Adj. Sig. |
| Spring-Summer | Zn | -97.545 | 0.000 |
| Winter-Summer | Zn | -135.703 | 0.000 |
| Spring-Autumn | Zn | 48.563 | 0.008 |
| Autumn-Summer | Zn | 86.721 | 0.000 |
| Winter-Autumn | Cd | -60.109 | 0.046 |
| Spring-Summer | Cd | -55.524 | 0.001 |
| Spring-Autumn | Cd | -57.665 | 0.001 |
| Winter-Autumn | Cu | -63.969 | 0.027 |
| Winter-Summer | Cu | -77.218 | 0.003 |
| Spring-Autumn | Cu | -52.073 | 0.004 |
| Spring-Summer | Cu | -65.323 | 0.000 |
| Winter-Autumn | Ni | -60.178 | 0.045 |
| Winter-Summer | Ni | -64.792 | 0.023 |
| Spring-Autumn | Ni | -47.555 | 0.011 |
| Spring-Summer | Ni | -52.169 | 0.003 |
| Spring-Summer | Mn | -52.114 | 0.003 |
| Spring-Summer | Ca | -46.055 | 0.013 |
| Spring-Autumn | K | -57.864 | 0.001 |
| Spring-Winter | K | 75.802 | 0.002 |
| Spring-Summer | K | -88.728 | 0.000 |
| Spring-Summer | Mg | -51.518 | 0.004 |
| Spring-Autumn | Mg | -55.300 | 0.001 |
Asymptotic meanings are shown (two-tailed tests). The significance level is 0.05
The PCA carried out to detect the grouping of variables in each season is shown in Table VII, where the factor loads for the components obtained according to the season of the year are displayed. Notice that 11 variables were analyzed, but the amount of data per season varied, with winter having 41 data points, autumn 171, summer 107 and spring 103. The rotated factors for the PCA components for each season were obtained using a varimax method with Kaiser normalization. The groups of elements that make up each component vary by season, reflecting a strong influence of the prevailing seasonal climate conditions on their deposition.
Table VII PCA factor loadings for each season (PCA loadings >0.7 are shown in bold).
| Variables | Winter | Spring | Summer | Autumn | ||||
| CP1 | CP2 | CP1 | CP2 | CP1 | CP2 | CP1 | CP2 | |
| Zn | 0.916 | 0.821 | 0.975 | |||||
| Cd | 0.959 | 0.986 | 0.988 | 0.894 | ||||
| Fe | 0.935 | 0.67 | ||||||
| Cu | 0.905 | 0.948 | 0.945 | 0.977 | ||||
| Ni | 0.984 | 0.988 | 0.978 | |||||
| Mn | 0.753 | 0.825 | 0.882 | |||||
| Ca | 0.842 | 0.813 | 0.721 | 0.937 | ||||
| K | 0.939 | 0.964 | 0.822 | |||||
| Mg | 0.775 | 0.909 | 0.968 | 0.493 | ||||
| Eigenvalue | 4.25 | 1.84 | 4.75 | 2.94 | 5.33 | 2.43 | 5.96 | 1.04 |
| % of variance | 47.27 | 20.38 | 47.51 | 29.47 | 59.28 | 27.05 | 66.27 | 11.58 |
| % accumulative | 67.65 | 76.98 | 86.33 | 77.85 | ||||
Note: Components extracted with Varimax rotation method with Kaiser normalization.
The elements that prevail independently of season and are always part of the CP1 of each seasonal analysis are Cd and Cu, which reflects a constant source of emission throughout the year, primarily due to industrial emissions. During spring, CP1 grouped by Zn, Cd, Cu, Ni and Mn, as in the global CP1 (Fig. 6), showing an influence of industrial/vehicular emissions sources. On the other hand, the CP2 grouped by Fe, Ca, K and Mg, which can be related to natural emissions, except for Fe depositions in Universidad site, which is related to metallurgical emission sources. During autumn most of the elements were grouped within CP1 (Zn, Cd, Cu, Ni and Ca), as in the global CP1 (Fig. 6) while in CP2 the K was the dominant variable, maybe due to strong winds during this season that can carry more dust to the atmosphere. Summer, shows two components and is clearly separated in CP1 elements like Cd, Cu, Ni and Zn (anthropogenic influence) from the CP2 Mn, Ca, K and Mg mostly from natural emissions (e.g. crustal dust). During winter, the elements that make up CP1 are Cd, Cu and Ca, which together could come from anthropogenic emissions due to industrial activity or exploitation of quarries; CP2 is made up of Fe, Mn and Mg which are related to crustal material, except for Fe as already mentioned above. Winter shows a very peculiar behavior, because cold fronts influence the prevailing northerly winds -from the USA- as seen in backward trajectories at Linares and Allende sites (Figs. 7 and 8), affecting dispersion and pollutant concentrations. Winter is the most polluted season due to particulate matter (González-Santiago et al., 2011), and should be studied further to better understand the behavior of deposition during this season.
3.7 Comparison between the deposition values obtained versus those reported in other studies
Table VIII shows a comparison between the annual average deposition fluxes reported for each site in this study with others reported in the literature, where bulk deposition and some exclusively wet deposition are also used. The data reported by other studies allows us to identify how most of the values reported in this study were above the values of other studies in almost all cases. The Zn values for the University site of the present study are higher than those reported in previous literature. In addition, for the rest of the sites analyzed, this research shows a relative high value compared to most of the studies that are reported in Table VIII.
Table VIII Comparison between the deposition flows for present study and those reported in literature in mg m-2year-1 (Ca, K and Mg are reported in kg ha-1 year-1).
| Locations-monitoring period | Zn | Fe | Cd | Cu | Ni | Mn | Ca | K | Mg | References |
| Escobedo-2019-2020 | 115.83 | 35.90 | 6.49 | 6.85 | 6.39 | 6.77 | 83.31 | 2.62 | 1.23 | This study |
| Universidad-2019-2020 | 226.56 | 384.28 | 7.04 | 9.16 | 7.04 | 13.30 | 149.69 | 6.50 | 4.48 | This study |
| Obispado-2019-2020 | 115.77 | 93.38 | 5.70 | 6.76 | 5.58 | 7.10 | 161.95 | 8.01 | 2.57 | This study |
| Pastora-2019-2020 | 106.07 | 65.48 | 5.86 | 6.32 | 5.75 | 7.24 | 89.79 | 9.59 | 2.46 | This study |
| Pueblo Serena-2019-2020 | 132.90 | 74.73 | 11.18 | 7.07 | 6.99 | 9.01 | 97.18 | 4.10 | 10.37 | This study |
| Santa Catarina-2019-2020 | 106.08 | 64.44 | 5.89 | 6.49 | 9.35 | 6.94 | 103.97 | 2.38 | 0.91 | This study |
| Cadereyta-2019-2020 | 193.61 | 46.30 | 8.87 | 9.67 | 8.96 | 9.03 | 167.27 | 2.40 | 1.28 | This study |
| Allende-2019-2020 | 158.05 | 72.74 | 10.99 | 11.07 | 10.87 | 11.32 | 139.13 | 8.92 | 1.96 | This study |
| Linares-2019-2020 | 76.45 | 34.07 | 5.49 | 5.76 | 5.39 | 5.60 | 55.34 | 4.17 | 1.04 | This study |
| Xiangtan (Urban), China 2016-2018 | 73.09 | NA | 1.14 | 6.41 | 1.57 | NA | NA | NA | NA | (Feng et al., 2019) |
| Zhuzhou (Traffic), China 2016-2018 | 169.6 | NA | 2.13 | 13.62 | 1.9 | NA | NA | NA | NA | (Feng et al., 2019) |
| Zhuzhou (Rural), China 2016-2018 | 24.07 | NA | 1.29 | 4.2 | 1.69 | NA | NA | NA | NA | (Feng et al., 2019) |
| Linares 2016-2017 | 13.01 | 52.15 | NA | 2.91 | NA | 18.02 | 76.25 | 20.4 | 9.39 | (Luna-Robles et al., 2019) |
| Yangtze River Delta-XC, China, 2016 | 22.52 | NA | 0.34 | 12.02 | 26.32 | NA | NA | NA | NA | (Ma et al., 2019) |
| Yangtze River Delta-XS, China, 2016 | 26.06 | NA | 1.28 | 6.9 | 25.42 | NA | NA | NA | NA | (Ma et al., 2019) |
| Yangtze River Delta-BF, China, 2016 | 29.66 | NA | 0.26 | 11.07 | 23.49 | NA | NA | NA | NA | (Ma et al., 2019) |
| CU-ZMVM, 2003-2004 | NA | 118.41 | 1.35 | NA | 4.92 | 21.53 | NA | NA | NA | (García-Martinez, 2007) |
| Rancho Viejo Mexican state, 2003-2004 | NA | 34.83 | 0.56 | NA | 1.21 | 3.07 | NA | NA | NA | (García-Martinez, 2007) |
| Daya Bay, China 2015-2017 | 84.5 | 189.3 | 0.12 | 3.97 | 1.7 | 47.4 | 14.93 | 3.38 | 7.56 | (Wu et al., 2018) |
NA=not available.
Fe values for the University site are higher than those reported in the Daya Bay in China (Wu et al., 2018) and they are also higher than those reported for the CU-Metropolitan Area of the Valley of Mexico (García-Martínez, 2007), as well to the other values obtained for the rest of the monitoring sites of this investigation. Furthermore, the Cd reported here exceeds all values of other studies given in Table VIII, and the Ni value is only exceeded by the location reported from Yangtze River Delta in China (Ma et al., 2019). In the case of Mn deposition, Luna-Robles et al. (2019) in Linares, Mexico, and Wu et al. (2018) in Daya Bay, China, showed greater depositions values than those obtained in all sites in this study. Calcium exceeds all values reported in other studies, but in the case of Linares site the Ca deposited is lower than the reported for the same site during 2016-2017 (Luna-Robles et al., 2019). K and Mg values reported by the previous study in Linares site are higher than in this study, only Mg values in Pueblo Serena site are greater than those previously reported (Luna-Robles et al., 2019).
4. Conclusions
A total of 422 rainwater samples were collected in 32 rain events. An average pH of 7.15 ± 0.02 was found, indicating the presence of neutralizing substances in rainwater, influenced by predominantly calcareous soils in the study region. The average EC was 153.96 ± 6.83 μS/cm and exhibits high variability throughout the year.
Rainfall events show significant differences for all the deposited elements analyzed and between monitoring sites (p≤0.05). Likewise, they show significant diferences between urban and rural sites for Cd, Fe, Ni and Ca (p≤0.05), but not for Zn (p=0.654), Cu (p=0.296), Mn (p=0.579), K (p=0.537) and Mg (p=0.094). Post hoc test showed that tropical storm Fernand marked the difference for all the elements with respect to other rainfall events. Also, a remarkable difference was found between the Linares site with respect to Universidad site, for Fe and Ca deposition.
The annual accumulated deposition follows a descending order Ca> K> Mg> Fe> Zn> Mn> Cu> Cd> Ni and does not show significant differences in the annual deposition amounts between urban and rural areas (p=0.317), with the exception of Ca (p=0.017). High correlations can be observed between metals, especially Cd-Cu, Cd-Ni, Cd-Mn, Cu-Ni, Cu-Mn and Ni-Mn, primarily due to the influence of industrial (metallurgical) and vehicular emissions. PCA shows that Cu, Zn, Ni, Mn, and Cd, represent an important pathway in the deposition phenomena, and they reflect that both the urban and rural areas studied maintain the same behavior for this group of elements, which denotes that the rural areas could be connected to the air basin of the MAM. It was not expected that deposition patterns would be similar between urban and rural areas with such different types and levels of activity, nor that they would present similarities regarding the deposition of toxic metals such as Cd.
Enrichment Factors calculated for all elements at each site, using Fe and Ca as conservative elements, showed that Zn and Cd exhibit a high enrichment, while Cu and Ni have a moderate enrichment in all sites. On the other hand, only K, Mg and Mn were not enriched, except for EF values for Mn in Universidad and Santa Catarina, where enrichment was moderate.
Seasonal deposition showed that Fe, Zn, Cd, Cu, Ni, Mn, Ca, and Mg were higher during autumn; in contrast, K was higher during winter. Seasonal PCA shows that during spring and summer deposition separates more clearly into metals and elements of crustal origin, like the global PCA. On the other hand, during winter and autumn, the patterns change with respect to those reported by the global PCA and the rest of the seasons, maintaining a particular pattern for autumn and for winter.
Backward trajectories of rain events collected during winter and summer, at Linares and Allende rural sites, showed that only for Allende site a possible carry-over of pollutants is observed during summer, since winds preferably come from the northern part of the MAM during that season. However, it is recommended to carry out further analyzes on winds throughout the year, to more clearly detect possible sources of emissions that could affect Allende and Linares sites.
It is important to continue with the implementation of studies that define the deposition along the urban gradient of the MAM, separating wet and dry depositions, due to the high urbanization and the increasing problems of air pollution. Furthermore, it is necessary to evaluate the deposition of toxic metals to establish government strategies aimed at improving air quality and ensuring an environment free of toxic substances for human and ecosystem health.

