


 nueva página del texto (beta)
 Inglés (pdf)
 Artículo en XML
 Referencias del artículo
 Enviar artículo por email
 Citado por SciELO
  Similares en
SciELO
Similares en
SciELO 
 Permalink
1. Introduction
Tuberculosis (TB) afflicts humanity since ancient times (Daniel, 2009; Smith et al., 2009; Turco and Byrd, 2001; Narasimhan et al., 2013). Mycobacterium tuberculosis (Mtb) predominantly causes pulmonary TB (PTB) but has the potential to affect any organ of the human body (Stead, 1965; Anderson et al., 2015).
It was not long ago that discussion began on emerging new risk factors for the activation of TB (Smith et al., 2014). One of those emerging risk factors is exposure to air pollution (indoor and outdoor), which can negatively modulate treatment responses (Kim, 2014). Multiple studies suggest that particulate matter (PM) is the air pollutant component related to an increased risk of TB development. The initial findings of associations between outdoor air pollution and PTB appeared at the end of the first decade of the 2000s (Cohen and Metha, 2007). A study conducted in Los Angeles, California, found that exposure to elevated levels of PM2.5 had a statistically significant association with smear-positive TB (Jassal et al., 2013). In North Carolina, a relationship was demonstrated between PM2.5 and the population’s susceptibility to developing PTB (Smith et al., 2014). A study conducted in the city of New Taipei, Taiwan, reported that chronic exposure to PM10 delays sputum culture conversion in patients with PTB (Chen et al., 2016). Delayed effects of PM10 and PM2.5 exposures on the incidence of TB were found in Shanghai (Wang et al., 2019).
The state of Baja California, Mexico, has the highest PTB incidence rate in the country. As of 2016, the state’s average incidence rate was 47.6/100,000 inhabitants, while the national average was 13.8/100,000 (POEBC, 2017; CENAPRECE, 2017). Mexicali, the capital of Baja California, also presents a high incidence of PTB, exceeding 423 new cases per year (an incidence rate of around 42.4/100,000) (SUIVE, 2015). In addition to the PTB problem, the city is characterized by sustained high pollution levels that are predominantly caused by PM10 and PM2.5 suspended in the air (Osornio et al., 2011; Reyna et al., 2012; Reyna et al., 2017; Reyna et al., 2018). The city, being at the Mexico-United States of America (USA) border, is exceptionally dynamic from a commercial, industrial and agricultural perspective. It has two border crossing checkpoints with the USA, where long queues of vehicles wait to cross into the neighboring country, emitting significant amounts of pollutants. There are two thermoelectric power plants and one geo-thermoelectric power plant in the vicinity. A large part of Mexicali’s outskirts does not have paved roads, and roads are poorly maintained. Vehicular density is one of the highest in the country, and vehicle emissions are not controlled. Large agricultural areas on both sides of the border are pesticides are continuously sprayed, and farming fields are burned seasonally. Many restaurants cook with charcoal or firewood, resulting in uncontrolled emissions from charbroiling or frying meat. In addition to these PM sources, the region’s extreme weather and aridity contribute to the high levels of PM pollution in the city (Watson and Chow, 2001; Reyna et al., 2012; ERG, 2019).
In the current study we explored the associated risk of PM exposure with PTB. Although most of the existing scientific studies use monthly or annual observation windows, the evidence suggests the possibility of shorter windows of exposure. Therefore, we examined the associations between PM exposures and PTB using weekly observation windows of continuous and categorical exposure (i.e. high and low pollution categories) up to 12 weeks before the PTB diagnosis.
2. Materials and Methods
2.1 Study Population
The study population consisted of individuals with PTB of all age groups and gender diagnosed between 2003 and 2007 who had resided in Mexicali for at least one year. The diagnosis of PTB (ICD-10: A15) required the presence of the following parameters: Ziehl-Neelsen stain positive sputum smear, clinical and chest x-ray manifestations characteristic for TB, and a suspected epidemiological history.
2.2 Clinical Data
Time-series data from 2003-2007 on PTB were made available by the Epidemiology Department (ED) of the Mexican Institute of Social Security, which records all new PTB cases. Individuals with PTB and HIV coinfection or Diabetes mellitus were excluded from the study. As per WHO guidelines (WHO, 1998), the ED obtains and evaluates three sputum smears and defines a new PTB case as a person with at least two out of three Ziehl-Neelsen stain positive sputum smears. In some instances, sputum smear-negative cases require a sputum culture to confirm PTB. However, those cases were not included in the current study, leaving the possibility of missing false-negative PTB cases; and in very rare cases including false positive cases with Nocardia sp. infection (Muricy et al., 2014).
Data in the current study is organized into weekly overall counts and counts by gender. We describe the total distribution by age groups (i.e. 0-14, 15-24, 25-34, 35-44, 45-54, 55-64, > 65 years) and age groups according to gender.
2.3 Meteorological Data
We worked with meteorological data [i.e. temperature (Temp) and relative humidity (Rh)] obtained from the Department of Meteorology at the Engineering Institute of the Autonomous University of Baja California, as published previously (Reyna et al., 2012). The data are organized as time-series (2003-2007) of daily averages and weekly averages.
2.4 PM 10 and PM 2.5 data
PM10 and PM2.5 data were provided by the Environmental Protection Secretary (SPA) of the State Government of Baja California, the National Institute of Ecology and Climate Change (INECC), and the United States California Air Resources Board (CARB). Time-series of daily averages and weekly averages were calculated as reported previously (Reyna et al., 2012).
2.5 Biostatistics
The associations between PM10 or PM2.5 and PTB were calculated using Poisson regression models and are expressed as relative risk (RR) and estimated 95% confidence intervals (CI), adjusted for over-dispersion. The effects of PM on PTB were analyzed by gender and for the entire study population.
The baseline models were first estimated and then applied to assess PM10 and PM2.5 exposures. Baseline models were constructed by separately testing each of the dependent variables (e.g. PTB time-series according to gender) and adjusting for different independent control variables (see below). The models were specified with the Poisson regression algorithm in the NCSS9® software (NCSS, 2013).
We used the following control variables for the estimation of our baseline models: unlagged (i.e. Lag0) and lagged versions up to 12 weeks (i.e. Lag1 - Lag12) of Temp, Rh, the square of Temp and Rh and sinusoidal structural terms for seasonality (Katsouyanni et al., 1996), as well as the long-term linear and squared trends; time indicator variables were created for each year, month and week of the PTB diagnosis, taking as reference the first week, first month and first year; for age, the proportion of 65< year olds was taken as reference; for gender, the proportion of females was taken as reference. The control variables were included one-by-one when adjusting the baseline models. We started with the meteorological variables, then the structural and time variables, and, finally, age and gender. Only those variables contributing to a statistically significant (p<0.05) increase in the deviance were accepted for the baseline model specification.
We assumed having adequate models when the residual autocorrelation coefficients did not exceed the confidence limits (α = 0.05).
Once we developed the models, the baseline models were tested separately for PM10 and PM2.5 at Lag0 and up to 12 weeks (Lag1 - Lag12).
The PM levels were assessed as continuous or as categorical exposure (i.e. low and high pollution). To evaluate categorical exposure, we created two indicator variables. The “Low Pollution” category took the value of 1 when PM levels were equal to or less than the federal 24-hr average limit of 75 μg/m3 for PM10 or 45 μg/m3 for PM2.5 as regulated in the Official Mexican Standards (SSA, 2014). Otherwise, it was assigned the value 0. The “High Pollution” variable took the value of 1 when PM levels were above the federal limits for PM10 or PM2.5 and otherwise, took the value of 0.
To obtain the effect of the PM pollutant on PTB in the weeks of high pollution, the indicator variable “Low Pollution” and its interaction with the respective pollutant (i.e., PM10 or PM2.5) were included in the model. The coefficient associated with the variable of the PM pollutant without interaction is taken as the effect on PTB in the weeks of high pollution. Thus, the PM variable’s coefficient would show the main effect of the category for a high level of PM pollution.
As with the baseline model estimation, it was assumed that the final models constructed were adequate when the residual autocorrelation did not show statically significant coefficients (α = 0.05). Any significant residual autocorrelation coefficient was controlled using the corresponding autoregressive PTB terms.
3. Results
3.1 Population and PTB
During the five year study period (2003-2007), 1,748 new PTB cases were recorded in Mexicali, which had 896,394 inhabitants in 2007 (INEGI, 2020). Of the 1,748 PTB cases studied, 1,253 were male and 495 female, with 61 PTB cases under the age of 15 years; 32 male and 29 female. There were noticeable differences in the PTB incidence rate over the study period, with the highest PTB case rate recorded in 2006 and the lowest in 2004. The incidence of PTB was higher in the period from winter to spring in 2004 and 2006, and the period from spring to summer in 2003, 2005, and 2007. Table I shows the PTB incidence rates estimated for 2003 - 2007, and by season.
Table I Total counts and rate [N(%)]/100.000-inhabitants of PTB by season (2003 - 2007).
| Season | Year | |||||
| 2003 | 2004 | 2005 | 2006 | 2007 | 2003-2007 | |
| Winter | 85(10.49) | 92(11.04) | 74(8.65) | 104(11.88) | 83(9.26) | 438 |
| Spring | 98(12.09) | 108(12.96) | 106(12.38) | 114(13.02) | 85(9.48) | 511 |
| Summer | 98(12.09) | 60(7.20) | 91(10.63) | 86(9.83) | 97(10.82) | 432 |
| Fall | 61(7.52) | 46(5.52) | 80(9.35) | 82(9.37) | 98(10.93) | 367 |
| Total | 342(42.21) | 306(36.73) | 351(41.00) | 386(44.10) | 363(40.50) | 1748 |
Population for the years 2003, 2004, 2006 and 2007 were estimated by the author, based on official figures reported by INEGI [INEGI, 2000; INEGI, 2005; INEGI, 2009; INEGI, 2010].
In general, the highest number of PTB cases occurred in men (2.5 males per female). Most of the cases occurred in the 25-34 year age group. The 35-44 year age group had the highest rate of men (4.0 males per female). Table II shows the PTB incidence according to age group and gender.
3.2 Meteorology and Pollution
In general, the dry-hottest seasons occurred during spring (March 21-Jun 20) and summer (June 21-September 22), and the wet-coolest seasons occurred between fall (September 23-December 21) and winter (December 22-March 20). Table III shows the Temp, Rh and PM in Mexicali according to year and season for the entire period studied.
Table III Average levels for the meteorological variables and PM, per year and season, in Mexicali (2003-2007).
| Season | Year | |||||
| 2003 | 2004 | 2005 | 2006 | 2007 | 2003-2007 | |
| Temperature | 25.38 | 24.62 | 25.12 | 25.49 | 24.90 | 25.09 |
| Winter | 18.01 | 16.65 | 16.87 | 16.95 | 17.22 | 17.14 |
| Spring | 26.05 | 27.86 | 26.67 | 27.30 | 26.58 | 26.89 |
| Summer | 34.92 | 34.44 | 34.80 | 35.57 | 34.78 | 34.90 |
| Fall | 22.53 | 19.51 | 22.15 | 22.13 | 21.02 | 21.47 |
| Relative humidity | 41.98 | 39.34 | 38.99 | 33.41 | 34.00 | 37.54 |
| Winter | 46.68 | 47.29 | 56.15 | 37.60 | 33.30 | 44.20 |
| Spring | 34.90 | 30.40 | 30.39 | 29.39 | 31.14 | 31.25 |
| Summer | 41.99 | 33.68 | 33.87 | 34.07 | 35.37 | 35.59 |
| Fall | 45.35 | 45.98 | 35.53 | 32.57 | 36.19 | 39.12 |
| PM10 | 100.66 | 93.48 | 86.29 | 85.71 | 90.16 | 91.26 |
| Winter | 111.87 | 95.13 | 75.85 | 104.94 | 99.28 | 97.41 |
| Spring | 87.99 | 77.85 | 74.23 | 64.53 | 80.46 | 77.01 |
| Summer | 92.33 | 92.42 | 77.55 | 69.35 | 83.11 | 82.95 |
| Fall | 110.45 | 108.53 | 117.51 | 104.01 | 97.77 | 107.65 |
| PM2.5 | 56.61 | 58.04 | 66.23 | 60.49 | 61.85 | 60.64 |
| Winter | 67.72 | 62.18 | 58.64 | 76.63 | 71.39 | 67.31 |
| Spring | 43.77 | 47.60 | 53.66 | 44.63 | 52.29 | 48.39 |
| Summer | 45.62 | 49.33 | 57.49 | 41.96 | 52.04 | 49.29 |
| Fall | 69.32 | 73.06 | 95.11 | 78.73 | 71.69 | 77.58 |
Temperature in ºC; relative humidity in %; and PM10 and PM2.5 in μg/m3.
The highest PM10 and PM2.5 levels occurred during the wet-coolest seasons, with concentrations exceeding the federal annual average limits of 40 μg/m3 and 12 μg/m3, respectively (SSA, 2014), for every year studied. The federal 24-hr average limit of 75 μg/m3 for PM10 was exceeded on 219 days in winters, 181 days in springs, 201 days in summers, and 268 days in falls, resulting in a total of 869 exceedances during the study period. The federal 24-hr average limit of 45 μg/m3 for PM2.5 was exceeded on 302 days in winters, 248 days in springs, 262 days in summers, and 351 days in falls, resulting in a total of 1,163 exceedances during the study period.
Figures 1 and 2 present the distribution of PTB cases and PM levels between 2003 and 2007. Figure 1 presents the number of PTB cases and mean PM concentrations according to the months for the duration of the entire study. Figure 2 presents the distribution of PTB cases for each month, according to PM10 (Figure 2A) and PM2.5 (Figure 2B) concentrations.
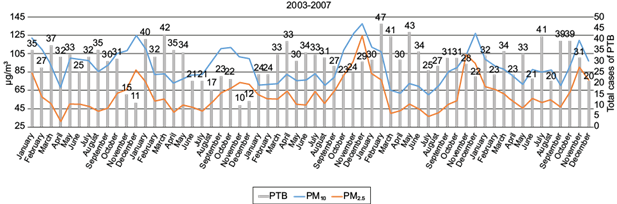
Fig. 1 Time series of the monthly mean PM10 (blue line) and PM2.5 (orange line) concentrations and the monthly number of PTB cases (gray bars) in Mexicali between 2003 and 2007. Interestingly, peak particle concentration preceded a peak in the number of cases suggesting seasonality. The models used in the study identified a time related statistically significant association in which existing elevated PM concentrations anteceded a ~3% increased risk for the diagnosis of PTB.
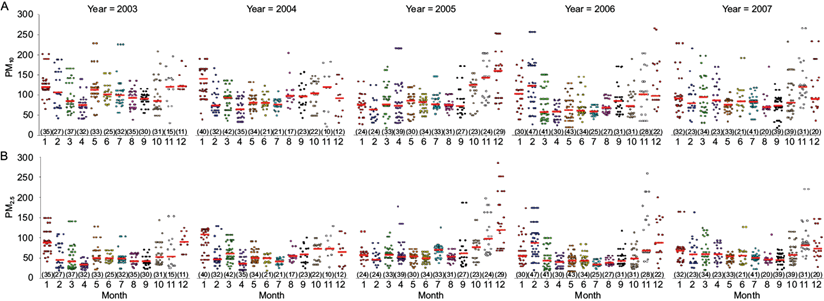
Fig. 2 Distribution of all PTB cases (colored dots) diagnosed by month (1 = January to 12 = December) according to the PM concentration at the diagnosis time. This graphical representation shows the increased PM concentration (A = PM10, B = PM2.5) values during the cold months and the increase in the number of cases during the warmer months. The short horizontal red line indicates the position of the median for each dispersion cloud and the numbers in parentheses indicate the total monthly count of PTB cases.
3.3 Pollution Exposure
The models showed statistically significant results (p<0.05) in some of the Poisson regression coefficients associated with the PM studied for the full population and for both genders. Table IV shows every most significant lag time regression coefficient associated with the PM and their statistics by continuous exposure and by high pollution exposure category (i.e. pollution levels above and below the 24-hr average limit for PM10 (75 μg/m3) and PM2.5 (45 μg/m3)). The Poisson regression coefficients were used to calculate changes in the RRs of PTB if the concentration of the PM10 or PM2.5 were increased by 10 µg/m3 of air, also shown in Table IV. Figure 3 graphically depicts the RR percentage increases of PTB by groups, for the 10 µg/m3 increment in PM10 or PM2.5.
Table IV Summary statistics of the Poisson regression analysis by PM exposure (i.e. continuous and high pollution exposure category) for the full population and by gender, and rate ratios (RRs) increases of PTB due to each increment of PM10 or PM2.5 by 10 µg/m3 of air in Mexicali, Baja California. Only the most significant lag time is presented.
| Lag (Weeks) | b (CI 95%) | RR (CI 95%) | P | ||
| All population | |||||
| PM10 | 10 | Continuous | 0.0023 (-0.0001, 0.0048)a | 1.0238 (1.0212, 1.0263) | 0.062 |
| ≤ 75 | Ref | ||||
| > 75 | 0.0036 (0.0002, 0.0070)a | 1.0365 (1.0330, 1.0401) | 0.040 | ||
| PM2.5 | 10 | Continuous | 0.0031 (0.0004, 0.0058)a | 1.0316 (1.0288, 1.0344) | 0.025 |
| ≤ 45 | Ref | ||||
| > 45 | 0.0039 (0.0007, 0.0071)a | 1.0394 (1.0361, 1.0428) | 0.018 | ||
| Males | |||||
| PM10 | 10 | Continuous | 0.0028 (0.0000, 0.0056)b | 1.0282 (1.0253, 1.0311) | 0.055 |
| ≤ 75 | Ref | ||||
| > 75 | 0.0045 (0.0005, 0.0083)b | 1.0459 (1.0419, 1.0500) | 0.023 | ||
| PM2.5 | 10 | Continuous | 0.0033 (0.0000, 0.0064)b | 1.0340 (1.0308, 1.0371) | 0.031 |
| ≤ 45 | Ref | ||||
| > 45 | 0.0041 (0.0001, 0.0077)b | 1.0418 (1.0381, 1.0456) | 0.024 | ||
| Females | |||||
| PM10 | 11 | Continuous | 0.0050 (0.0010, 0.0090)c | 1.0510 (1.0468, 1.0551) | 0.014 |
| ≤ 75 | Ref | ||||
| > 75 | 0.0051 (0.0002, 0.0104)c | 1.0526 (1.0471, 1.0582) | 0.057 | ||
| PM2.5 | 11 | Continuous | 0.0042 (0.0005, 0.0089)c | 1.0430 (1.0381, 1.0479) | 0.077 |
| ≤ 45 | Ref | ||||
| > 45 | 1.0052 (0.0001, 0.0105)c | 1.0532 (1.0476, 1.0588) | 0.056 | ||
PM10 and PM2.5 in μg/m3.
a Adjusted for: temperature Lag12; weeks of diagnosis - 13, 36, 47, 51; sinusoidal terms - sixth order; age group proportion - 15-24 years old; year of diagnosis - 2004; and, PTB Lag18.
b Adjusted for: month of diagnosis - December; weeks of diagnosis - 13, 21, and 47; PTB male Lag7, 12, and 18.
c Adjusted for: square of relative humidity Lag0; the month of diagnosis - February, March; age group proportion - 0-14 and 15-24 years old; and, PTB female Lag11.
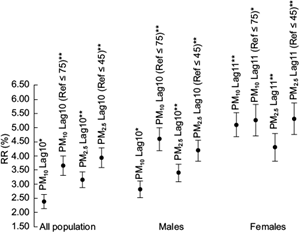
Fig. 3 RR increases of PTB by group due to an increment of 10 µg/m3 in PM. 95% confidence interval. * p<0.10. ** p<0.05.
The RR for the development of PTB in males and the totality of cases remained similar and was statistically significant (p<0.05), and borderline significant (p<0.10) for the continuous PM10 exposure. The RRs associated with the PM10 or PM2.5 were slightly higher for the male PTB cases. Female PTB cases had an increased RR with broad confidence intervals compared with the RR for all the cases. Observed increased RRs were statistically significant only when considering continuous PM10.
After model adjustments, the analysis showed a 10-week delayed effect for PM10 and PM2.5 in all PTB and the male PTB cases (p<0.05), and borderline significance (p<0.10) for continuous PM10 exposure. An 11-week delayed effect occurred in the female PTB case population when considering continuous PM10 exposure (p < 0.05). In the full PTB case population, the RR rose by 2.4% (95% CI: 2.1, 2.6) for each 10 µg/m3 increase of PM10 in the continuous exposure and by 3.6% (CI: 3.3, 4.0) in the high pollution exposure category, and by 3.2% (CI: 2.9, 3.4) for each 10 µg/m3 increase of PM2.5 in the continuous exposure and by 3.9% (CI: 3.6, 4.3) in the high pollution exposure category. In male PTB cases, the RR rose by 2.8% (CI: 2.5, 3.1) for each 10 µg/m3 increase of PM10 in the continuous exposure and by 4.6% (CI: 4.2, 5.0) in the high pollution exposure category, and by 3.4% (CI: 3.1, 3.7) for each 10 µg/m3 increase of PM2.5 in the continuous exposure and by 4.2% (CI: 3.8, 4.6) in the high pollution exposure category. In female PTB cases, the RR for development of PTB rose by 5.1% (CI: 4.7, 5.5) for each 10 µg/m3 increase of PM10 in the continuous exposure and by 5.3% (CI: 4.7, 5.8) in the high pollution exposure category, and by 4.3% (CI: 3.8, 4.8) for each 10 µg/m3 increase of PM2.5 in the continuous exposure category and by 5.3% (CI: 4.8, 5.9) in the high pollution exposure category.
As an example, Table V shows the Poisson regression coefficients with their respective confidence intervals and p-values obtained by including the continuous exposure of PM2.5 delays in the baseline model for the full population. The most significant effect was in Lag 10.
Table V Poisson regression coefficients (b) for PTB incidence in the full population by lags time of the continuous exposure of PM2.5
| Lag (Weeks) | b (CI 95%) | P |
| 0 | 0.0014 (-0.0016, 0.0045) | 0.362 |
| 1 | 0.0029 (0.0001, 0.0058) | 0.046 |
| 2 | 0.0012 (0.0017, 0.0040) | 0.424 |
| 3 | 0.0005 (0.0034, 0.0024) | 0.741 |
| 4 | 0.0005 (0.0022, 0.0033) | 0.706 |
| 5 | 0.0005 (0.0022, 0.0032) | 0.727 |
| 6 | 0.0012 (0.0014, 0.0039) | 0.355 |
| 7 | 0.0016 (0.0011, 0.0043) | 0.248 |
| 8 | 0.0013 (0.0014, 0.0039) | 0.345 |
| 9 | 0.0009 (0.0018, 0.0037) | 0.516 |
| 10 | 0.0031 (0.0004, 0.0058) | 0.025 |
| 11 | 0.0007 (0.0022, 0.0036) | 0.631 |
| 12 | -0.0010 (0.0040, 0.0019) | 0.490 |
4. Discussion
We found associations between PM levels and PTB case numbers in the population that was studied. Our findings suggest that PM levels above the Official Mexican Standards (i.e. a 24-hr average of 75 μg/m3 for PM10 and 45 μg/m3 for PM2.5) increase the risk of PTB with a greater statistical significance in males than in females. Our results coincide with those in a recent study by Wang et al. (2019) that used months as the observation units and found that the numbers of TB cases increased by 8% and 4% for each PM2.5 and PM10 increment of 10 μg/m3, respectively. In the current study the number of PTB cases increased by 3.2% and 2.4% for each 10 µg/m3 increment of PM2.5 and PM10, respectively, and for the continuous exposure (borderline significant (p<0.10) for PM10). Increases of 3.9% and 3.6% for each 10 µg/m3 increment of PM2.5 and PM10 we observed for the high pollution exposure category.
The RR found in this study showed a ~10-week lagged PM effect in all the groups analyzed. A recent study using four different monthly windows of exposure to PM2.5 before PTB diagnosis found an association after three-months of exposure (RR=1.020 for each increment of 10 μg/m3) (Liu et al., 2018). The RR decreased strongly by increasing the exposure window (i.e. 6, 9, 12 months).
The published articles cited in our study show differences in the estimated risks (including the risks found in our study) for the development of TB on PM exposures. This is likely due to the differences in the methodologies, algorithms, control variables, types of TB studied, regions and sociodemographic characteristics, or the composition of the PM in the various studies and study sites. When looking at various PM exposure periods (i.e., 1, 3, 6, 9, 12 months) it is apparent that the risk of TB development becomes uniformly critical around the three-month exposure period with decreasing significance at longer exposure periods. The results presented in the current study with shorter exposure periods indeed suggest the existence of a critical three-month lag exposure, identifying a 10 and 11-week delayed (lag) effect when testing for weekly PM and PTB associations. This time lag relates to an apparent seasonality of the two phenomena (new PTB and PM pollution). The adjustments of our model suggest that temperature and relative humidity are not responsible for the associations found between PM levels and PTB case numbers. Further studies are warranted to explore the likely contribution of behavioral and environmental variables that contribute to the seasonality in PTB incidence rates. For example, more people spend more time in indoor environments during colder seasons of the year where they may be exposed additionally to indoor PM levels from household heating.
Three-month PM exposure periods may be critically influencing the reactivation of PTB in persons with preexisting latent infection with Mtb, an important aspect that still requires further exploration. In a recent study in Wuhan, China, associations between PM levels and TB incidence rates were explored using the day as a unit of measurement. That study found statistically significant associations (p<0.05) only in lag 7 (days) for 10 μg/m3 increments in PM10 or PM2.5 (Huang et al., 2020). However, the meaning of short lag periods remains to be evaluated, and its biological plausibility explored.
The findings from our time-series analysis are supported by recent studies from our group that suggest that PM10 and PM2.5 inhibit human antimycobacterial immune mechanisms. These studies also indicate that PM effects on human host immunity induced by Mtb are manifested differently, depending on the season during which ambient PM was collected for in vitro studies (Rivas-Santiago et al., 2015). Other studies from our group found that the urban PM2.5 suppresses antimycobacterial T cell (Ibironke et al., 2019) and alveolar macrophage functions (Torres et al., 2019). Immunosuppression induced by PM exposures may underlie increased risks of new Mtb infection or development of PTB in the population of Mexicali, where TB is considered endemic.
This study has several limitations. Diagnosis of PTB based on sputum smear positivity alone does not have the sensitivity and specificity of sputum cultures. Also, as indicated above, associations between weather seasons and PTB incidence rates may be confounded by exposure to indoor air pollution, tobacco smoke and crowding effects in congregated settings. It was also not possible to assess the population at risk for PTB development from Mtb infection and PM exposure as the proportion of the Mexicali population with positive tuberculin skin test is very high due to universal BCG vaccination coverage.
5. Conclusion
This study suggests that PM air pollution may contribute to the development of PTB in the population of Mexicali. Diagnosis of PTB showed a lag of 10 or 11 weeks relative to seasonally elevated PM levels. Mexicali, Baja California, has a high incidence of TB and high PM10 and PM2.5 levels that consistently exceed the acceptable air quality limits of the Official Mexican Standards. PM exposures may be an essential factor in contributing to the high incidence of PTB in Mexicali’s population. These preliminary results warrant further research using different statistical models, longitudinal cohort study designs and the assessment of confounders such as socioeconomic and nutritional status, HIV coinfection, Diabetes mellitus, tobacco smoking, indoor air pollution, and the use of illicit drugs and alcohol.

