


 nueva página del texto (beta)
 Inglés (pdf)
 Artículo en XML
 Referencias del artículo
 Enviar artículo por email
 Citado por SciELO
  Similares en
SciELO
Similares en
SciELO 
 Permalink
1. Introduction
Among the various characteristics of the Amazon region, are the high rainfall levels that occur in this area - which exceed 2000 mm per year (Figueroa and Nobre, 1990; Rao and Hada, 1990) - and its potential to function as a great source of heat and moisture for South America and for the energy balance of the global atmosphere. Evaporation is the main source of water vapor in most of the tropical troposphere (Folkins and Martin, 2005), and deep convection is the main mechanism for vertically distributing moisture and heat, via mostly Cumulonimbus (Cb) extending to the tropopause and producing intense rain. Therefore, variations in intensity, diurnal distribution and location of deep convection plays an important role in weather and climate of this region. The rainfall regime, among other factors, varies depending on the topography and proximity to rivers, as has been shown by many authors (Greco at al., 1990; Marengo, 1992; Cutrim et al., 2000; Angelis et al., 2004; Machado et al., 2004; Fitzjarrald et al., 2008; Santos e Silva, 2013; Tanaka et al., 2014; Ahmed and Schumacher, 2015; Baba, 2016; Ahmed and Schumacher, 2017; Machado et al., 2018).
Weather and climate of the Amazon basin are affected by, among other factors, the position of the Intertropical Convergence Zone (ITCZ) which modulates the rainy and less rainy seasons in the region. (Uvo and Nobre, 1989; Cavalcanti et al., 2009). In addition to isolated deep convection, Squall Lines (SLs) (Kousky, 1980; Cohen et al.,1995; Alcântara et al., 2011; Germano et al., 2017; Germano and Oyama, 2020) predominate through Amazonia and challenge numerical weather forecasting models. The presence of diferent convective regimes and the complex interactions betweenthe surface and the atmosphere have hindered testing convective parameterizations in this region (Betts and Jakob, 2002; Betts, 2003; Sherwood et al., 2004; Grabowski et al., 2006; Allan and Soden, 2007; Neelin, Peters and Hales, 2009; Sherwood et al., 2010; Bengtsson et al., 2011; Del Genio and Wu, 2012; Lee et al., 2013; Santos e Silva, 2013 ; Hottovy and Stechmann, 2015; Santos e Silva and Freitas, 2015; Schiro et al., 2016; Lintner et al., 2017; Freitas et al., 2018; Schiro and Neelin, 2019).
One of the main difficulties in numerical prediction is to associate atmospheric moisture with precipitation, which can vary in linear or non-linear ways, depending on the degree of organization of convection and the time interval analyzed (Bengtsson et al., 2011; Masunaga, 2012; Back et al., 2017). It has already been shown that strong and organized convection with large areas of stratiform clouds, has a greater contribution to rainfall in humid tropical atmospheres (Tan et al., 2013; Deng et al., 2014). Other research suggests that convection models are producing excess moisture in the boundary layer, perhaps because the parameterization schemes for this layer are too mixed (Sherwood et al., 2010; Itterly et al., 2018; Kuo et al., 2020), which probably leads to early precipitation. And the simulation of insufficient moisture transport can lead to less active convection, which can make it difficult to trigger deep convection (Vilà-Guerau de Arellano et al., 2020). On the other hand, modeling successfully captures the interannual variability of precipitation in relation to large-scale phenomena such as ITCZ, representing well the migration of convective activity throughout the year, especially over the continent (Sousa et al., 2018).
Several studies (Adams et al., 2009; Ahmed and Schumacher, 2015; Wolding et al., 2020) indicate that the way in which convective parameterizations deal with the relationship between thermodynamic stability, convective initiation and intensity, determines the nature of simulated precipitation in deep convective regimes, such as in the Amazon. In other words, the thermodynamic conditions of the atmosphere are extremely important for convective initiation, cloud formation and precipitation development in tropical regions (Gille and Mota, 2014). So, the daytime convection cycle, its sensitivity to atmospheric conditions and its representation in numerical models is of fundamental importance to understand its role in the climate system (Adams et al., 2015; Itterly et al., 2018). And in addition to thermodynamic instability, the wind shear could play a fundamental role in initiation and suppression of convection (Adams et al., 2009; Rudolph and Friedrich, 2014).
Therefore, given the importance of the behavior of moist convection, this study presents an analysis of diurnal and seasonal distributions of shallow and deep convective events, combined with the analysis of thermodynamic profiles before and during the occurrence of selected events. The results may be use- ful in improving the forecast of events of intense moist convection, mainly in the short term.
This paper is organized as follows: Section 2 describes the data and methodology; Section 3 shows the results and discussions of diurnal and seasonal analysis of the convectives events, the termodinamic analysis of the some events selected and their atmospheric stability. Conclusions are presented in Section 4.
2. Methodology and Dataset
The study area in centered in the city of Belém-PA (01º 27’ 18” S; 48º 27’ 09” W) (Fig. 1), which is located in eastern Amazonia and has an average annual rainfall above 3000 mm. The rainy season spans from December to May, while the less rainy season occurs from June to November (Figueroa and Nobre, 1990).
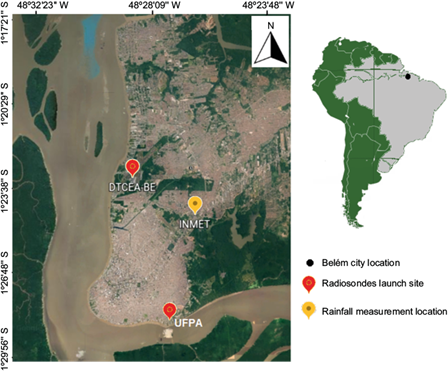
Fig. 1 Location of the study area and rainfall data collection points (INMET) and launch of radiosondes (DTCEA-BE and UFPA). Since, the distance in a straight line from INMET to DTCEA-BE is 5 km; INMET to UFPA is 7 km and DTCEA-BE to UFPA is 10 km.
Hourly rainfall data from January 2008 to December 2010 were obtained from the Instituto Nacional de Meteorologia (INMET) and data from radiosondes launched at 00 and 12 UTC (21 and 00 Local Time (LT), respectively, from the Destacamento de Controle do Espaço Aéreo de Belém (DTCEA-BE) were used for the thermodynamic analysis of the atmosphere. Additional radiosondes obtained during the Balanço Atmosférico Regional do Carbono na Amazônia (Mini-BARCA) experimental campaign from 9 to 30 June 2008 were also used, launched at 06 and 18 UTC at the Universidade Federal do Pará (UFPA).
Cloud Top Temperature (CTT) data were obtained every 15 minutes from the in the infrared channel 4 (11 μm) of the Geostationary Operational Environmental Satellite (GOES 12), pixel resolution of 4 x 4 km.
The decis technique was used to select the events with intense rain, which divide a data set into ten equal parts (decis). The ninth decil was used to determine the top 10% of the most extreme values from the series. This technique was applied to the hourly rainfall data, and an average value of 15 mm h-1 was obtained as the minimum threshold for an intense rain event. Thus, all rainfall events with values equal to or greater than 15 mm h-1 were classified as convective events.
A second method was used to subclassify the events into Deep Convective Events (DCE) and Shallow Convective Events (SCE), according to cloud vertical extent. The CTT data was used since the lower the absolute value of CTT, the greater the cloud vertical development (Houze, 1993). Spatial averages were estimated from the point closest to the location of the raingauge site (INMET), which was assumed as the center of the study area. The nine CTT values surrounding the raingauge site were averaged into a single value every 15 minutes, corresponding to an area of 144 km2. Considering that the horizontal scale of a single storm varies from 10 to 30 km, it was possible to represent, at least, a local convective event using average CTT values.
Only spatially-averaged 15-min CTT values corresponting to full hours were used to match the rainfall data frequency. In the absence of CTT data for the full hour, the average CTT values for the prior 15 minutes were considered. This was performed in about 20% of the data.
Studies for different regions of South America have used different CTT values to define deep convective clouds associated with moist convection ranging from 230 K to 2060K (Silva Dias et al. (2002): 230 K; Vila et al. (2008) and Ribeiro et al. (2019): 235 K; Greco et al. (1990): 240 K; Machado et al. (2004): 260 K). In this work, events with CTT ≤ 235 K were assumed to be DCE. The threshold CTT for SCE was taken to be 271K based on Tanaka (2014).
To ensure that CCT values indeed corresponded to clouds, a maximum CTT value corresponding to warm cloud base temperature, was estimated as 289K for a 1500 m cloud base height. Thus, CTT values of up to 289 K could represent the presence of clouds. Then, for all convective events with rainfall ≥ 15 mm h-1, those with CTT ≤ 235 K were classified as DCE, while events with 235 < CTT > 289 K were classified as SCE.
Radiosondes that took place up to three hours before the time of occurrence of maximum rain caused by each DCE or SCE were considered to determine the vertical atmospheric profile. However, since radiosondes were launched at 00 and 12 UTC, hindered the analysis. It was possible to select only three events in which radiosonde data was available before the time of maximum rain, and another five events in which the radiosonde was launched during the rain (Table I).
Table I Events selected for the analysis of the thermodynamic profile and stability of the atmosphere. Five events are SCE and three are DCE. On 01/20/2008 and 05/06/2010 the radiosonde took place three hours before the rain; on 05/12/2010 two hours before and on the other days, the radiosonde coincided with the time of the rain.
| Event date | Time of rain ≥ 15 mm h-1 (UTC) | Radiosonde time (UTC) | Event type |
| 01/20/2008 | 15 | 12 | SCE |
| *06/13/2008 | 18 | 18 | SCE |
| 07/07/2009 | 00 | 00 | DCE |
| 08/04/2009 | 00 | 00 | DCE |
| 05/06/2010 | 15 | 12 | SCE |
| 05/12/2010 | 02 | 00 | SCE |
| 05/28/2010 | 00 | 00 | SCE |
| 11/14/2010 | 00 | 00 | DCE |
*Only selected event with rain greater than 15 mm h-1, in which radiosonde was launched at UFPA during the Mini-BARCA experiment.
In an attempt to obtain a larger sample to analyze the atmospheric thermodynamic conditions for DCE and SCE, an alternative classification was made including all rainfall events ≥ 1 mm h-1, maintaining the same cloud-based criteria. Under these conditions, it was possible to consider 42 events (Table II). These events were selected in such a way that we tried to obtain two cases for situations in which radiosondes were launched at the hour, one hour, two hours and three hours before the occurrence of DCE and SCE. Also, the separation was made by season.
Table II Events selected for the analysis of the thermodynamic profile and stability of the atmosphere, considering rainfall equal to or greater than 1 mm h-1, CTT ≤ 235 K for DCE and 235 <CTT> 289 K for SCE.
| Event type | Time between radiosonde and rain ≥ 1 mm h-1 | Radiosonde time (UTC) | Season | |||
| 0 hour | 1 hours | 2 hours | 3 hours | |||
| DCE | 01/21/2010 | 04/10/2009 | 12/26/2008 | 01/14/2010 | 0 | Rainy |
| 04/23/2010 | 04/29/2010 | 04/13/2010 | 04/25/2010 | |||
| 01/25/2010 | 02/21/2009 | 04/02/2009 | 01/15/2008 | 12 | ||
| 04/08/2010 | * | 05/02/2009 | * | |||
| 06/11/2009 | 06/16/2009 | 06/17/2010 | 08/14/2009 | 0 | Less rainy | |
| 06/16/2010 | 06/24/2010 | 06/30/2010 | * | |||
| 06/02/2008 | * | * | * | 12 | ||
| * | * | * | * | |||
| SCE | 05/15/2008 | 05/05/2008 | 04/24/2009 | * | 0 | Rainy |
| 02/04/2009 | * | 05/21/2010 | * | |||
| 01/27/2008 | 02/18/2010 | 02/26/2009 | 01/30/2008 | 12 | ||
| 04/04/2009 | 03/22/2010 | 01/08/2010 | 02/16/2009 | |||
| 06/19/2010 | 06/14/2010 | * | 06/15/2009 | 0 | Less rainy | |
| 08/07/2010 | 08/15/2010 | * | * | |||
| 06/08/2009 | * | * | 06/01/2009 | 12 | ||
| * | * | * | * | |||
* There is no information.
The analyzes of the events shown in Table II were performed separately from those shown in Table I, since the criterion of rain intensity used for the two sets is different. And to perform averages for a given time interval, between the radiosonde and the convective event, 00 and 12 UTC were considered. For example: to obtain the average profile representative of one hour before the occurrence of DCE, profiles measured at 00 and 12 UTC were used to represent the DCE that occurred at 01 and 13 UTC. And as for each interval (same time, one, two or three hours before the convective event occurs) a maximum of two profiles was selected, so each average profile represents the average of a maximum of four profiles. And even if using these criteria, it was not possible to obtain an average profile to represent the conditions of the atmosphere two hours before the occurrence of an SCE, during the less rainy season, as it was not possible to select any radiosonde for these conditions. Therefore, in the analysis of the average temperature profiles, mixing ratio and wind components, the average profile, two hours before the occurrence of SCE, during the less rainy season, will not be analyzed.
From the average temperature and humidity profiles, graphs were also made to analyze the differences (anomalies) between the DCE and SCE profiles, for the two seasons, specified.
Vertical profiles of air temperature and humidity, wind speed and direction were analyzed for the selected events. The stability of the atmosphere was estimated from the Convective Available Potential Energy (CAPE), representing the kinetic energy that the parcel gains from the environment to ascend in the atmosphere. CAPE was calculated from Equation (1), suggested by Emanuel et al. (1994):
where: LFC is the Level of Free Convection, the level at which the parcel would become positively buoyant by ascent; EL is the Equilibrium Level, where the parcel would be neutrally buoyant; Tvp is the virtual temperature of the parcel; Tve is the virtual temperature of the environment, in the interval between the base (LFC) and the top of the cloud (EL); g is the acceleration due to gravity (equal to 9.8 m s-2) and dz represents the thickness of the layer.
Table III shows the CAPE values and the conditions of the atmosphere associated with them, according to Bluestein (1993), and these intervals will be used for comparison purposes with the results found in this study.
Table III CAPE values and associated instability conditions. Adapted from: Bluestein (1993)
| CAPE (J kg-1) | Atmospheric conditions. |
| 0 < CAPE < 1000 | Limit for deep convection formation. |
| 1000 < CAPE < 2500 | Moderate deep convection. |
| 2500 < CAPE < 4000 | Strong deep convection. |
| CAPE > 4000 | Extreme deep convection. |
3. Results and Discussions
3.1 Diurnal and seasonal distribution
Following the methodology described in the previous section, 94 events were identified for the entire study period, of which 60 are DCE and 34 are SCE. From the 60 DCE events, 34 occurred in the rainy season (December to May) and 26 in the less rainy season (June to November), while the SCE events were distributed in 25 in the rainy season and 9 in the less rainy season. The hourly distribution of the rain intensity of these events, by season, is shown in Figure 2, where it can be seen that most events occurred between 15 and 22 UTC (12 and 19 LT, respectively), corresponding to approximately 86% of the total events, of which 55% occurred in the rainy season. This distribution shows a diurnal cycle of the events associated with the expected solar radiation forcing at the surface and local convection in the absence of dynamic forcings. In addition, there is a tendency for DCE to occur at times closer to 00 UTC (21 LT), during the less rainy period and, proportionally, the reduction in the number of SCE between the two periods was more significant. In other words, during the less rainy period, the DCE tended to be more frequent than the SCE, and because the DCE depend more on daytime heating for their formation (because at this time of the year the local convective activity predominates), they caused more “late” rains in relation to the rainy season.
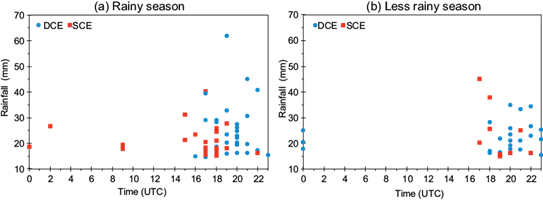
Fig. 2 Hourly distribution of DCE (blue circles) and SCE (red squares) in Belém, in the rainy (a) and less rainy (b) seasons, from January 2008 to December 2010.
Another explanation for the higher frequency of heavy rains in the afternoon/night in the city of Belém is the influence of sea breeze circulation, when there is a greater thermal contrast between the continent and the ocean (Kousky, 1980; Germano et al., 2017; Germano and Oyama, 2020). This sea breeze circulation is responsible for most of the rainfall that occurs in the region in the less rainy season, and it is important in the organization of SL close to Foz do Amazonas, as SL are often formed along the convergence zone of the sea; they enter the continent and reach the city of Belém in the late afternoon (Cohen et al., 1995). In addition, in the study area, the presence of a river breeze occurs between 12 and 00 UTC in the northwest quadrant, and it can be observed throughout the year (Germano et al., 2017). So, the breeze circulation process could also justify the “delay” in the occurrence of DCE between the rainy and dry seasons.
As shown by Santos et al. (2012), for the years 2005 and 2006, the maximum rainfall values observed in Belém - at 17 UTC (2005) and at 19 UTC (2006) - occurred when the local horizontal wind showed a rotation, varying from northeast to southwest, due to the effects of sea and river breeze circulations, in both seasons. Angelis et al. (2004) also found similar results for the same study area from 1998 to 2000, when a higher frequency of rainfall events was observed in the afternoon, with a peak of 39 events at 18 UTC (15 LT). However, these authors defined any value above 0 mm h-1 as a rain event.
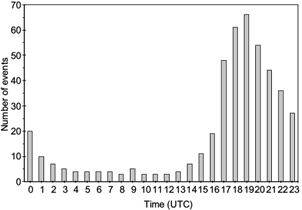
On the other hand, Tanaka et al. (2014), analyzing six years of hourly rainfall data for Central Amazonia (Manaus and surroundings), found a higher occurrence of rain events ≥ 1 mm h-1 in the morning and afternoon. The frequency of events was higher in the forest areas, with peaks between 12 and 16 LT, while in urban areas the peaks occur between 10 and 14 LT. However, the localities representative of the urban area of Manaus are located closer to the Rio Negro, when compared to the representative forest areas, and, according to the authors, this condition allows these areas closer to the river to suffer the effect of river breeze in the modulation of the diurnal rainfall cycle, which justifies the higher frequency of rain events in the early morning hours in the urban area. Therefore, this indicates that the behavior of the diurnal rainfall variation is different between the urban areas of Belém and Manaus. On the other hand, analyzing the occurrence of rain events in Belém, according to the conditions in Manaus (rain ≥ 1 mm h-1), Figure 3 shows that the highest frequency of events occurs between 17 and 22 UTC (14 and 19 LT), a little later than that observed in the urban area of Manaus. Therefore, this indicates that the behavior of the daytime rainfall variation is different between the urban areas of Belém and Manaus. But the diurnal cycle of rainfall in these urban areas seems to be modulated by the process of breeze circulation, even at different times.
3.2 Thermodynamic analysis
3.2.1 Events with rainfall equal to or greater than 15 mm h -1
In order to facilitate the thermodynamic analysis, the events that presented rain and observation of the atmosphere profile at 00 UTC (07/07/09, 08/04/09, 05/28/10 and 11/14/10) were analyzed together, while events that occurred at different times (01/20/09, 06/13/08, 05/06/10 and 05/12/10) were analyzed separately.
Figure 4 shows the vertical temperature profiles for 01/20/2008, 06/13/2008, 05/06/2010 and 05/12/2010, when cases of SCE occurred. These temperature profiles were measured three hours be- fore (01/20/2008 and 05/06/2010), two hours befo- re (12/05/2010) and at the time of intense rain (06/13/2008). Figure 4a indicates a small temperature difference between the analyzed profiles. At most levels, over the depth of the atmosphere, air temperature tended to be higher on 05/12/2010 at 00 UTC (21 LT), when the observation occurred two hours before the rain event (green line), showing a warming trend of the atmosphere before shallow convection. On 06/13/2008, the temperature profile variation was slightly more accentuated than in the other cases, perhaps due to the fact that the measurements took place during the rain and were carried out at 18 UTC (15 LT), time when the atmosphere tends to be more unstable than at 00 or 12 UTC. The lower temperature values from the surface to 850 hPa for the days 01/20/2008 and 05/06/2010 may be related to the fact that the measurements were taken at 12 UTC (09 LT), before solar heating is fully effective. Figure 4b shows the corresponding diferences in profiles for SCE cases that occurred two hours before and at the time of the rain (green line) and three hours before and during the rain (blue and black lines). It is clear that in practically all the low and medium troposphere, the temperature was higher two hours before the occurrence of the SCE, than at the time of occurrence of an event in this category. And there was a tendency for temperature to be lower for the cases that occurred 3 hours before the rain, which is more evident on 01/20/2008.
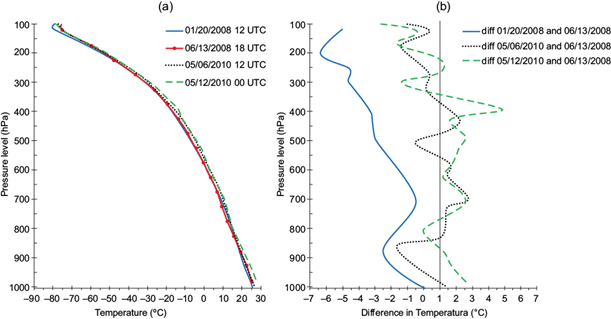
Fig. 4 (a) Vertical air temperature profiles: three hours before (01/20/2008 and 05/06/2010), two hours before (05/12/2010) and at the time of rain (06/13/2008), for cases of SCE in Belém-PA. And (b) Differences vertical air temperature profiles between cases that ocorred two hours before e in the at the time of rain (green line) and three hours before e in the at the time of rain (blue and black lines).
Figure 5 shows the air temperature profile for cases of convective events, in which the rain coincided with the 00 UTC radiosonde launch. The DCE events that occurred on 07/07/2009, 08/04/2009 and 11/14/2010, and the SCE event on 05/28/2010.
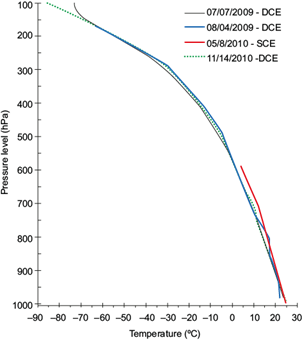
Fig. 5 Vertical air temperature profiles measured at the time of the occurrence of intense rain events, for cases of DCE (blue lines) and SCE (red line) that occurred in Belém-PA, at 00 UTC, on 07/07/2009, 08/04/2009, 05/28/2010 and 11/14/2010.
From surface up to 589 hPa, on 05/28/2010, the temperature is almost always higher than in other events. To the pressure levels lower that 589 hPa (higher altitudes) there is no data available for that day 05/28, but for the other days it is observed that, above 589 hPa, there was a tendency for the temperature to be higher on 08/04/2009, up to ~270 hPa. For 07/07 and 08/04/2009, temperatures were lower from the surface to 925 hPa, probably because it had already rained before the most intense rain events (25 mm on 07/07 and 20.6 mm on 08/04/2009) recorded at the time of launching the radiosonde (00 UTC). For 07/07 rain of 1.6 mm was observed at 23 UTC on 07/06, while on 08/04 two rain values were observed, one of 2.2 mm at 22 UTC, and another 0.6 mm at 23 UTC on 08/03, and this may have caused the greatest variation in the temperature profile (in the sup-500 hPa layer), in relation to the other three cases. Therefore, these less intense rainfall events, which occurred before the time of the radiosonde, started a cooling process at low levels of the atmosphere in these two days. On 05/28 and 11/14/2010 rain was recorded only at 00 UTC but due to the fact that it precipitated only during the radiosonde time, the low-level cooling (surface to 900 hPa) was not detected as it was observed on other days. In addition, rains were slightly less intense, with values of 18.6 and 18 mm, on 05/28 and 11/14/2010, respectively.
As observed through the air temperature profiles, this variable presents small variations between the cases analyzed, but the most important thing to mention is the fact that there is a tendency for the temperature to be higher at low levels when SCE occurs, as in figure 4, in which all cases are SCE, the air temperature close to the surface was higher than 25 ºC, while in figure 5, the temperatures close to the surface were up to 25 ºC, with higher values observed throughout the profile of day 05/28/2010, which was the only case of SCE analyzed in the figure. So, in order to obtain a better visualization of the tendency of increasing air temperature in the lower atmosphere, when SCE occurs, figure 6 was created, in it are the air temperature profiles of all the events analyzed up to the level of 589 hPa (last level that has measures of 05/28/2010). Again, it is possible to notice that the temperature tended to be higher when SCE occurred, mainly from the surface up to approximately 850 hPa. And when the temperature was measured two hours before the rain (dashed red line) it was higher than all other cases.
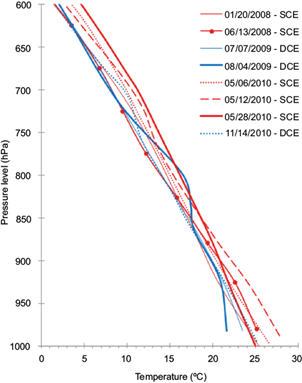
Fig. 6 Vertical air temperature profiles for all DCE (blue lines) and SCE (red lines) selected in the studied period, in Belém-PA.
Even if a comparison is made between the SCE profiles that occurred at the same time of rain observation (06/13/2008 and 05/28/2010) with all the DCE (07/07/2009, 04/08/2009 and 11/14/2010) - which were also measured at the same time of the rain - the temperature is observed to be higher during the SCE. This result indicates that when there is more intense convection, a more pronounced atmosphere stabilization occurs. And this decrease in temperature can be caused by downdrafts, which bring cold, dry air from inside to outside the cloud. This can be seen mainly through the DCE profiles of 07/07 (thin continuous blue line) and 08/04/2009 (thick continuous blue line), when the rain started before the most intense rain observation time. That is, the cooling of the atmosphere started before the time of temperature measurements and the most intense rain.
Figure 7 shows the vertical profiles of the mixing ratio for the events that occurred at different times. The highest humidity values occurred in the boundary layer and, from the surface to 720 hPa, the atmosphere was more humid on 05/12/2010, and less humid on 06/13/2008. Above 550 hPa, the atmosphere was more humid on 01/20 and 06/13/2008.
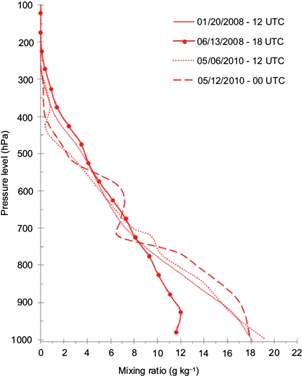
Fig. 7 Vertical profiles of the mixing ratio: three hours before (01/20/2008 and 05/06/2010), two hours before (05/12/2010) and at the time of rain (06/13/2008), for cases of SCE in Belém-PA.
On 06/13/2008 the radiosonde was started at 17:34 UTC, and the rain of 38 mm observed at 18 UTC is equivalent to all rain that fell between 17:01 and 18 UTC, that is, the measurement of the profile of that day’s humidity occurred during the rain, when the humidity of the atmosphere was decreasing, which justifies a drier atmosphere than the other cases. In addition, this event occurred in June, when the atmosphere tends to be less humid.
As already mentioned, on 05/12/2010 the measurement of the humidity profile occurred two hours before the 26.6 mm rainfall event, showing that the atmosphere was more humid before the rainfall. Likewise, on 01/20/2008 and 05/06/2010, when measurements were taken three hours before the rain, the atmosphere was less humid than two hours before, and more humid than the case when the measurement was performed during the rainy season (06/13/2008). This result suggests humidity increases as the time of intense rain approached, and t tended to dry the atmosphere during its occurrence.
These results are similar to those found in Central Amazonia, where it was observed that an increase in humidity in the lower troposphere occurred at the beginning of deep convection (Schiro et al. 2016). However, in Central Amazonia the intense data collection carried out during the GoAmazon experimental campaign gave the opportunity to analyze how the variability in the vertical structure of humidity and the conditional instability of the environment control the beginning of deep convection, both for smaller scale convection and in mesoscale (Schiro and Neelin, 2019). But despite the low sampling of events analyzed in this research, it is possible to observe similar patterns.
It has been observed that even for mid-latitude regions, the humidity at 850 hPa is a good indicator of severe rain events (Silva et al., 2015). The behavior in the vertical humidity profile observed in Belém is similar to that found by Rocha (2010) in Manaus, where the humidity between 850 and 700 hPa exerts a certain control in convective events. Schiro et al. (2016) found that humidity was higher at the time of rainfall and slightly lower before and after. They also showed that at levels below 800 hPa, mainly below 900 hPa, before and during rainfall it was more humid than after, possibly because of the cold pools. And in the upper troposphere (above 400 hPa), the humidity was higher during and after the rains. And this behavior of the highest humidity during rain at upper levels, can also be seen in Figure 7, on 06/13/2008, when the humidity was higher than in the other cases, above the level of 500 hPa.
Figure 8 shows the behavior of humidity during the occurrence of rainfall at 00 UTC for cases of DCE and SCE. Up to the level of 925 hPa the humidity was higher for the case of DCE that occurred on 11/14/2010, with a maximum value of 20 g kg-1 at the surface. On 05/28/2010 it was more humid above 925 hPa, while on 07/07/2009, in the surface-820 hPa layer the atmosphere was less humid, just as on 08/04/2009 lower humidity is observed in the surface-600 hPa layer. The behavior of humidity in the last two days is consistent with that found in the temperature profiles, when a cooling of the atmosphere was observed, due to rain having started before the launch time of the radiosonde. The idea that the de- crease in temperature could have been caused by downward currents of cold and dry air is reinforced by the decrease in humidity.
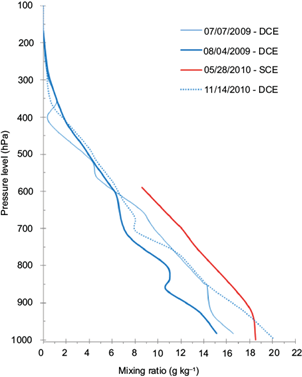
Fig. 8 Vertical profiles of the mixing ratio measured at the time of the occurrence of intense rain events, for cases of DCE (blue lines) and SCE (red line) that occurred in Belém-PA, at 00 UTC, on 07/07/2009, 08/04/2009, 05/28/2010 and 11/14/2010.
In general, the moisture profiles show significant differences between the different cases analyzed (Fig. 9), and the most interesting thing is that during the SCE that occurred on 05/28/2010 the layer of 925-589 hPa in the atmosphere was more humid than on the other days analyzed, and the DCE of 11/14/2010 showed the highest humidity from the surface to 925 hPa. Two more SCE occurred, one on 6 May 2010, when the humidity was relatively high in the lower atmosphere and the other on 12 May, when the humidity also showed significant values in the 925-760 hPa layer. This shows that in that month the atmosphere was quite humid, which may have favored the occurrence of three SCE with rainfall rates above 15 mm h-1. On 6 May the humidity values are not as high as on 12 May and 28 May, may be due to the rain that fell on 5 May, between 19 and 23 UTC, which possibly kept the atmosphere less humid (above the level of 930 hPa) until the radiosonde launch time at 12 UTC on 6 May.
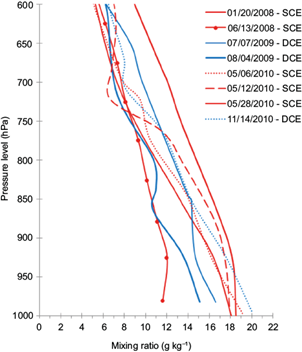
Fig. 9 Vertical profiles of the mixing ratio for all DCE (blue lines) and SCE (red lines) selected in the studied period, in Belém-PA.
Meteorological observations in May 2010 (Climanálise, 2010a) indicate that the formation of SL and the northernmost position of the ITCZ contributed to the highest accumulated rainfall observed in the far north of the Amapá, in the northwest and north of Pará and in the northeast of Roraima. Rainfall in these areas exceeded monthly climatology by more than 100 mm, while the monthly anomaly was 85.1 mm in Belém resulting in na accumulated total of 390.6 mm. These results confirm that the atmosphere was more humid in May 2010.
Figure 10 shows the variation of the wind components for the analyzed cases. The event on 06/13/08 has no wind information. In general, the zonal component (Fig. 10a) is easterly in almost the entire troposphere, advecting moisture from the Atlantic Ocean to the continent.
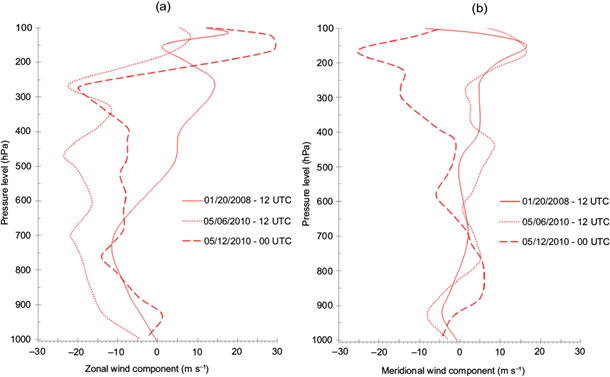
Fig. 10 Vertical profiles of the zonal (a) and meridional (b) components of the wind: three hours before (01/20/2008 and 05/06/2010) and two hours before (05/12/2010) heavy rain, for cases of SCE in Belém-PA.
The vertical wind shear in the lower troposphere was larger on 05/06/2010, while on 05/12/2010 it was larger in the 930-760 hPa layer, indicating that the shear was more intense at the time of occurrence of the rainfall. This variation of the wind with height in the atmospheric boundary layer favors the instability of the layer.
The meridional component (Fig. 10b) was weaker than the zonal component and presented irregular profiles. On 01/20/2008 and 05/06/2010, from the surface up to ~750 hPa, the predominant wind was northerly, and with southerlies above that level. On May 12, 2010, the meridional component was almost reversed: southerly in the 880-625 hPa layer and northerly above. The most important point of the meridional component is the greatest shear that occurred in the surface-925 hPa layer in the three cases analyzed.
The vertical profile of the wind components at the time of the occurrence of SCE and DCE, at 00 UTC, are shown in Figure 11. As can be seen, at the time of rain, on average, the zonal component was more intense than at times before the rain (Fig. 10) and predominantly easterly, from the surface to the upper troposphere. The wind shear was also strong at low levels in all four cases, mainly on 08/04/2009. From the surface to ~600 hPa, the northerly winds predominated on 05/28 and 11/14/2010, and southerly winds predominated on 07/07 and 08/04/2009. Strong shear was observed at low levels on 05/28 and 11/14/2010.
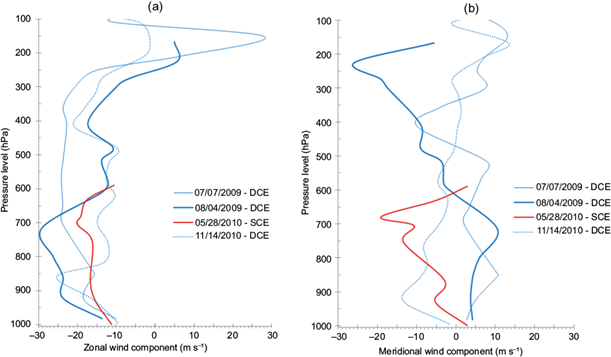
Fig. 11 Vertical profiles of the zonal (a) and meridional (b) components of the wind, measured at the time of the occurrence of intense rain events, for cases of DCE (blue lines) and SCE (red lines) that occurred in Belém-PA, at 00 UTC, on 07/07/2009, 08/04/2009, 05/28/2010 and 11/14/2010.
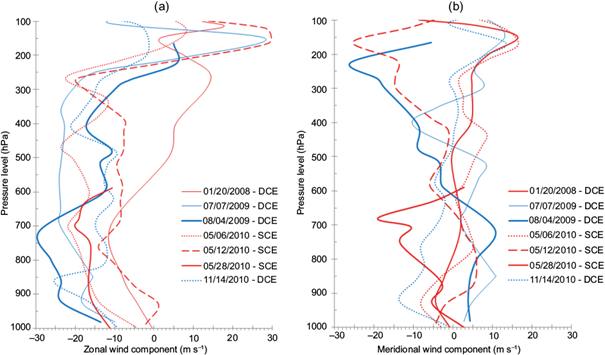
By comparing the wind components between all SCE and DCE (Fig. 12), it is possible to notice that there is really a predominance of easterly winds at low and mid-levels even reaching the upper troposphere, except for the 01/20/2008 in which the wind becomes westerly at 500 hPa. On average, wind shear is large from the surface up to 850 hPa, proving to be stronger in the three cases of DCE, confirming that wind shear plays an important role in deep convection (Adams et al., 2009; Baba 2016). Regarding the meridional component, only larger low-level shear is observed between SCE and DCE and no difference above.
3.2.2 Events with rainfall equal to or greater than 1mm h -1
The following analyzes correspond to DCE and SCE associated rainfall ≥ 1 mm h-1, evaluating aver- age profiles measured at the same time, one, two and three hours before the occurrence of DCE and SCE, for the rainy and less rainy periods.
Figure 13 indicates that the temperature profiles do not show significant variations between them, but note that during the rainy season (Fig. 7a) there is a slight tendency for higher temperature from the surface to 700 hPa, two hours before the occurrence of SCE, similar behavior observed in Figures 4 and 6.
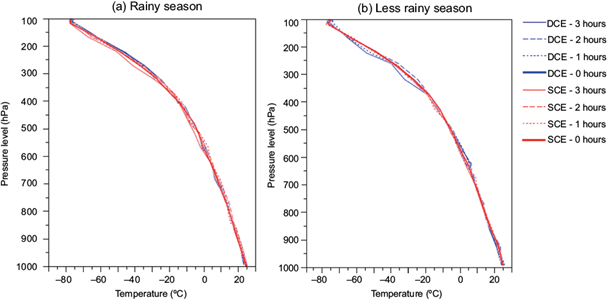
Fig. 13 Vertical air temperature profiles during, one, two and three hours before the occurrence of DCE (blue lines) and SCE (red lines), for the seasons: (a) rainy and (b) less rainy, in Belém-PA.
At pressure levels below 400 hPa, higher temperature is observed during both seasons and for both types of events, indicating an increase in temperature as the time of convective events approaches, consistent with the release of latent heat of condensation. In addition, lower temperature values are observed three hours before the rain for SCE (DCE) in the rainy season (less rainy).
In order to better visualize the small temperature differences between the DCE and SCE profiles, Figure 14 shows variations at all levels for both seasons. On average, smaller variations (around 1 ºC) are observed between the surface and approximately 700 hPa, with larger variations (up to 5 ºC) above. It is possible to better visualize the highest temperature values for SCE two hours before the rain, in the rainy season (Fig. 14a), as the temperature differences between DCE and SCE are negative, from the surface to approximately 500 hPa. Unfortunately, it is not possible to see if the same occurs for the less rainy season, due to the lack of data.
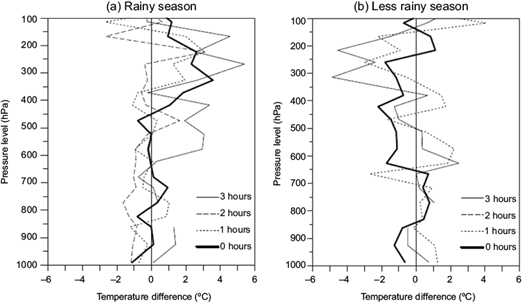
Fig. 14 Differences in the average vertical air temperature profiles between DCE and SCE, during, one, two and three hours before the occurrence of these events, for the seasons: (a) rainy and (b) less rainy, in Belém- PA.
Once again, it can be seen that at low levels, in both seasons, and during the rainy season, the temperature is lower for cases of DCE (negative anomalies), indicating that the presence of downward currents, which bring dry and cold air from higher levels, are more intense in the presence of deep convection. In addition, during convective events the solar radiation absorbed by the surface is less than the total energy supplied to the atmosphere (Machado, 2000).
Interestingly, at altitudes above 500 hPa, temperature anomalies are on average positive (negative) during the rainy season (less rainy), before and during the rainfall events. This suggests that the air temperature plays different roles in the intensification of shallow and deep convection in the rainy and less rainy seasons.
Figure 15 shows the average vertical profiles of the mixing ratio, for the rainy and less rainy seasons. Between ~975 to 850 hPa in the reainy season (Fig. 15a), humidity was higher two hours before the occurrence of SCE (similar to that observed in figure 7, for the event of 05/12/2010). It is not possible to observe the behavior of the average humidity profile, two hours before the occurrence of SCE, in the less rainy season, because no event was found in this category. In contrast, between surface and 850 hPa during the rainy season (Fig. 15b), the atmosphere was less humid for both DCE and SCE (similar to the case of day 06/13/2008, shown in Figure 7). On average, the humidity was higher during the rainy season, at pressure levels above 825 hPa, being more evident for SCE (DCE) in the rainy season (less rainy), a behavior consistente with Schiro et al. (2016).
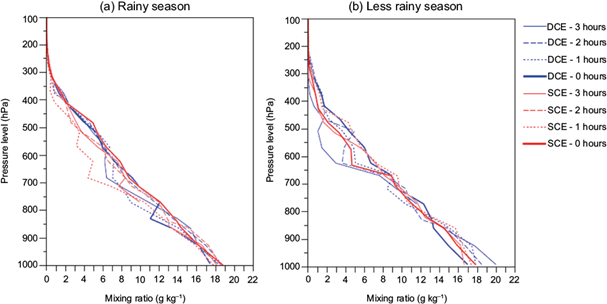
Fig. 15 Vertical profiles of the mixing ratio during, one, two and three hours before the occurrence of DCE (blue lines) and SCE (red lines), for the seasons: (a) rainy and (b) less rainy, in Belém-PA.
Note that from the surface up to 850 hPa profiles in the rainy season are not too different from those in the less rainy season. In the rainy season low humidity near the surface is observed closer to the time of occurrence of DCE; the opposite is observed for cases of SCE; and before the rain, humidity is always higher for DCE. In contrast, at mid-levels (between 675 and 450 hPa), humidity increases as the DCE occurrence time approaches (Fig. 15b). In summary, these results were expected, since before precipitation, more humid air parcels ascend in the atmosphere to form convective clouds, and after precipitation initiates, humidity tends to be higher at mid- and upper-levels, and lower at low-levels mainly associated with downdrafts which bring cold, dry air towards the surface. Further, results indicate that these downdrafts are more intense for DCE.
Figure 16 shows the differences in the average humidity profiles between DCE and SCE. Note that in the rainy (Fig. 16a) and less rainy (Fig. 16b) seasons, the maximum variations occurred in the 850 to 500 hPa layer, indicating that humidity in this layer is important for convective activity. The maximum differences (about 4 g kg-1) are observed ~600 hPa in the two seasons; positive (negative) humidity anomalies are also observed before the occurrence of DCE in the rainy (less rainy) season. The large differences observed around 600 hPa indicate the presence of a slightly “drier layer”, more evident in the less rainy season, which suggests the existence of less humid air outside the convective region. Thus, the entrainment of ambient air is important for shallow and deep convection.
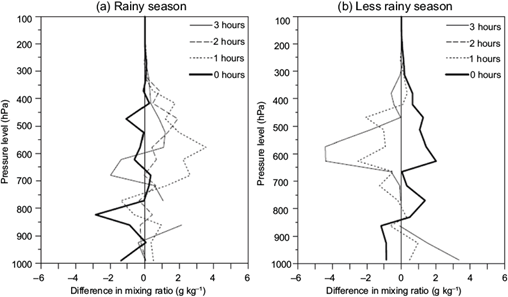
Fig. 16 Differences in the average vertical profiles of the mixing ratio between DCE and SCE during, one, two and three hours before the occurrence of these events, for the seasons: (a) rainy and (b) less rainy, in Belém- PA.
In the rainy season there is a predominance of positive anomalies before the rain and negative anomalies during the rain event, from the surface to approximately 350 hPa. Similarly in the less rainy season, but only from the surface up to 850 hPa. Negative anomalies before the rain and positive anomalies during the rain are observed above, reinforcing observations in Figures 7, 8 and 9.
In summary, during the rainy season the atmosphere is more humid (less humid) before (at the time) the occurrence of DCE. Similarly in the less rainy season, but only at low levels (up to 850 hPa), since at mid- and upper levels the atmosphere is more humid before (during) the occurrence of SCE (DCE).
Figure 17 shows the average vertical profiles of the zonal and meridional components of the wind, for the same temporal conditions shown in Figures 13 and 15. The largest variability in the average profiles of the two wind components is observed as the time of occurrence of convective events approaches. The zonal component is predominantly easterly east the entire atmosphere, mainly during the less rainy season (Fig. 17b) associates with the southeast trade winds. The meridional component oscillates between northerly and southerly throughout the troposphere, with more significant variations during the less rainy season (Fig. 17d).
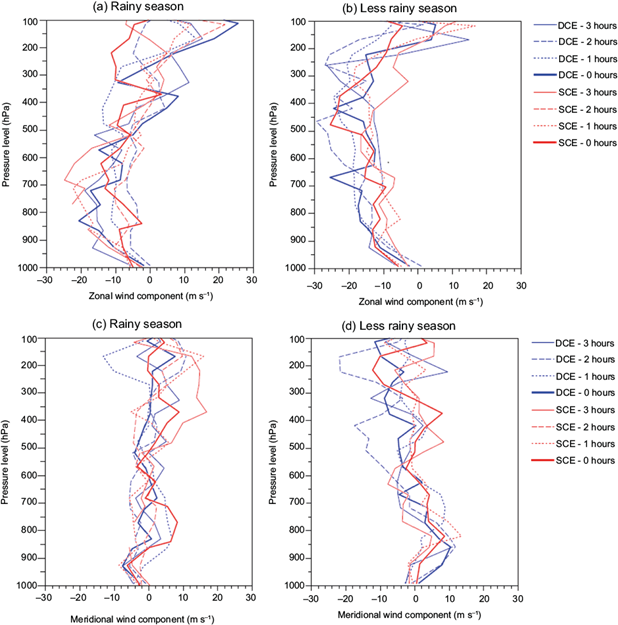
Fig. 17 Vertical profiles of the zonal (a and b) and meridional (c and d) components of the wind during, one, two and three hours before the occurrence of DCE (blue lines) and SCE (red lines), for the rainy and lesser seasons rainy season, in Belém-PA.
The shear in the two wind components is quite significant between the surface and ~850 hPa in both rainy seasons for all events, but mainly for cases of DCE that occurred during the rainy season. Thus, the wind shear plays a significant role in deep convection, as also seen in Figure 12.
3.3 Atmospheric stability analysis
Table IV facilitates the analysis and discussion of the stability of the atmosphere, displaying CAPE, maximum rainfall observed for all the convective events analyzed, time corresponding to the CAPE value (launch of the radiosonde), as well as, the number of hours between radiosonde and observation of the maximum rainfall.
Table IV CAPE values, rainfall, duration of rainfall, time of launching of the radiosonde and number of hours that the radiosonde before the time of occurrence of rain events.
| Date | Event type | CAPE (J kg-1) | Rainfall (mm h-1) | Rain duration (hour) | Radiosonde time (UTC) | Time between radiosonde and rain (hour) |
| 01/20/2008 | SCE | 3850 | 21,4 | 15 | 12 | 3 |
| 06/13/2008 | SCE | 409 | 38,0 | * | 18 | 0 |
| 07/07/2009 | DCE | 1187 | 25,0 | 6 | 00 | 0 |
| 08/04/2009 | DCE | 600 | 20,6 | 4 | 00 | 0 |
| 05/06/2010 | SCE | 3433 | 31,2 | 9 | 12 | 3 |
| 05/12/2010 | SCE | 2867 | 26,6 | 1 | 00 | 2 |
| 05/28/2010 | SCE | 19 | 18,6 | 2 | 00 | 0 |
| 11/14/2010 | DCE | 5624 | 18,0 | 8 | 00 | 0 |
CAPE values greater than zero are observed in all events analyzed, which is the limit for deep convection formation (Bluestein, 1993), with both the lowest (19 J kg-1) and the highest (5624 J kg-1) observed at the time of rain on 28 May and 14 November 2010, respectively. In both cases the rain started at the same time as the radiosonde launch. On 28 May 18.6 mm were recorded in two hours. On 14 November the atmosphere was quite unstable (classified as extreme deep convection) when the rain started, which lasted for 7 hours accumulating 30.8 mm. The release of latent heat during the rain together with the evaporation of the rain itself may have contributed to the instability. Even though CAPE was depleted during the rain event, at 12 UTC CAPE was still 2828 J kg-1, a condition of strong deep convection.
The rain of the 28 May 2010 was not associated with any larger-scalr meteorological system, and the small cluster of clouds over the study area, suggests the development of CAPE due to daytime heating (thermodynamic forcing). On the other hand, on 14 November 2010, areas of instability were associated with increased heat and humidity in the interior of the continent, especially in the north of the North and Northeast regions. There was widespread cloudiness, from 13 to 18 November 2010, which may have masked the formation of cumulonimbus cloud lines which form along the North and Northeast coast of Brazil (Climanálise, 2010b). So, the high CAPE value found for 14 November can be justified by the strong instability of the local atmosphere and the possible presence of SL. And it is important to highlight that this intense instability was associated with an DCE, which presented the highest humidity values, from the surface to 925 hPa (Fig. 9), among all the analyzed events.
The second highest CAPE value (3850 J kg-1) occurred on 20 January 2008, associated with an SCE, but characterized as strong deep convection, according to Table III. On that day, the rain started at 15 UTC, three hours after the radiosonde launch, and lasted until 05 UTC of the following day, accumulating 35.2 mm. And between 08 UTC on 21 January and 12 UTC on 22 January, slight rain was observed (0.2 - 1.4 mm). This shows that although the rain lasted 15 hours, it was intermitente and likely associated with a larger-scale meteorological system. This was confirmed by Climanálise (2008a) showing the presence of SL and organized convection associated with the ITCZ closer to the coast of the North and Northeast regions of Brazil between 16 and 20 January.
The third and fourth highest CAPE values were for SCE and occurred on 6 May 2010, (3433 J kg-1) and 12 May (2867 J kg-1), about three and two hours before the maximum rain events rain, respectively. Table III indicates strong deep convection conditions on both days, possibly favored by the combination of dynamic and thermodynamic forcing, but convective trigger dominated by dynamics (Gille and Mota, 2014). As discussed in relation to Figure 7, high rainfall values observed in northern Pará in May were associated with SL and the location of the ITCZ. On 7 May, the day following the SCE, 101.6 mm were recorded in 24hrs, the highest observed in May 2010.
The second and third lowest CAPE values were 409 and 600 J kg-1, which occurred, respectively, on 13 June 2008 (SCE) and 4 August 2009 (DCE), at the same time of the rain. CAPE remained below the limit for deep convection formation (1000 J kg-1). Rain started after 17 UTC on 13 June, and until 21 UTC 48.4 mm were recorded. It is not possible to inform the duration of the rain, as the data has flaws from 22 UTC until 11 UTC the next day. No SL event was observed on the 13 June and the ITCZ had moved further to the north (Climanálise, 2008b). Thus, CAPE was only due to thermodynamics forcing. Likewise, the event of 4 August 2009 also depended more on thermodynamics forcing, since the rain was caused by a cluster of convective clouds (Fig. 18).
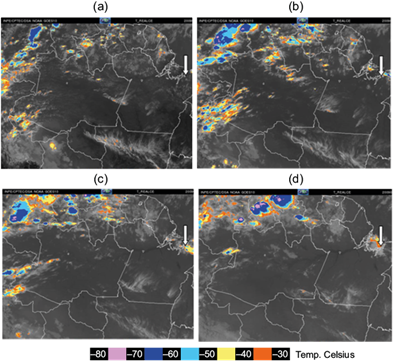
Fig. 18 Enhanced images of cloud top temperature, from the GOES 10 satellite, (a) at 18 UTC and (b) at 21 UTC on 08/03/2009; (c) at 00 UTC and (d) at 04 UTC on 08/04/2009. The region shown is the northern region of Brazil, where the study area is indicated with a white arrow.
Figure 18 shows enhanced images of the cloud top temperature, from the GOES 10 satellite, and where the study area is identified by white arrows. The images are from 3 August at 18 UTC (Figure 18a), showing intense convective activity (15 LT); at 21 UTC of the same day (Figure 18b), time of rain onset and where (in relation to Figure 18a) an intensification and displacement of the cloud cluster in the ocean-continent direction is perceived. At 00 UTC on 4 August (Figure 18c) low CAPE (32 J kg-1) and warmer CTT indicate that the system was weakening and dissipating at 04 UTC (Figure 18d).
On 7 July 2009 there was also the occurrence of an DCE, when the CAPE was 1187 J kg-1 (moderate deep convection, Table III). The radiosonde launch coincided with the time of the rain event, which started after 22 UTC on 6 July and ended before 05 UTC on 7 July. Unfortunately, there are no Climanálise publications for July 2009, but through satellite images (not shown) some isolated cloud clusters are observed above the study area, indicating that CAPE was favored by daytime heating.
Considering the dissipative losses, the CAPE required in tropical regions to support deep convection must be at least 1000 J kg-1 (Williams and Renno, 1993). Therefore, the cases reported here in which heavy rainfall occurred with low CAPE values are noteworthy. In addition to the fact that thermodynamic observations were made at the time of the rain (which reduces the CAPE), the rains from these events may have been caused by some meteorological system (playing the role of the dynamic force), because CAPE is essential for the development of storms only in the absence of larger scale forcers (Mota and Nobre, 2006). As previously discussed, the analysis of Climanálise and the satellite images indicate the presence of a medium-to large scale meteorological system only on 13 June 2008 (considering only days with CAPE below 1000 J kg-1). In the other two cases (4 August 2009 and 28 May 2010), the low CAPE values were the result of rains coinciding with radiosonde launches.
It is important to also note that almost all the SCE (except the event of 28 May 2010) occurred in the presence of a meteorological system (Table V), which may force air parcel ascent (Mota et al., 2007) resulting in deep convection even for low CAPE values. In this study, the only SCE that presented a low CAPE in the presence of a meteorological system, was 13 June 2008.
Table V CAPE values and meteorological systems active during the events analyzed.
| Date | Event type | CAPE (J kg-1) | Meteorological system active |
| 01/20/2008 | SCE | 3850 | ITCZ |
| 06/13/2008 | SCE | 409 | ITCZ and SL |
| 07/07/2009 | DCE | 1187 | Local convection |
| 08/04/2009 | DCE | 600 | Local convection |
| 05/06/2010 | SCE | 3433 | ITCZ and SL |
| 05/12/2010 | SCE | 2867 | ITCZ and SL |
| 05/28/2010 | SCE | 19 | Local convection |
| 11/14/2010 | DCE | 5624 | Local convection and SL |
The three cases of DCE, on the other hand, occurred when there was a predominance of local convection but only the event on 14 November 2010 had a high CAPE value. However, despite the fact that in these three cases the maximum rainfall was observed at the time of radiosonde launch, in the cases of 7 July and 4 August 2009 the rain started two hours before, suggesting that CAPE may have increased before rain initiation.
However, when analyzing mean CAPE values (Table VI) of the events described in Table II, note that CAPE tends to be greater before the occurrence of convective events in both seasons, with the highest values observed in the rainy season, mainly two and three hours before the occurrence of DCE. And although there is no CAPE information two hours before SCE occur in the less rainy season, CAPE values are higher.
Table VI Average CAPE values, at the same time, one, two and three hours before the occurrence of DCE and SCE, and for the rainy and less rainy seasons.
| Event type | Time between radiosonde and rain ≥ 1 mm h-1 | Season | Average per season | ||||
| 0 hour | 1 hours | 2 hours | 3 hours | ||||
| DCE | 777 | 42T2 | 2916 | 2211 | Rainy | 1582 | |
| 1726 | 1200 | 1082 | 1859 | Less rainy | 1467 | ||
| SCE | 1188 | 997 | 897 | 1491 | Rainy | 1144 | |
| 1261 | 1452 | * | 1419 | Less rainy | 1377 | ||
*There is no information.
Therefore, from Table VI, in the rainy and less rainy periods there was a greater availability of potential convective energy in the study area when DCE occurred, being greater in the rainy season. While for SCE cases, CAPE was higher during the less rainy period.
In summary, the conditions of atmospheric stability when analyzed case by case for DCE and SCE events with precipitation ≥ mm 15 mm h-1, indicate an important role of dynamics for both the occurrence of DCE and SCE, in agreement with previous studies (Mota and Nobre, 2006; Tavares and Mota, 2012; Gille and Mota, 2014; Santos, Mota and Rocha, 2014). And for events with precipitation ≥ 1 mm h-1, CAPE was larger during the rainy season with DCE, and that SCE need higher CAPE during the less rainy season.
4. Conclusions
This study analysed convective events that occurred in the city of Belém-PA, from January 2008 to December 2010, classifying them in DCE and SCE. For events that caused rain equal to or greater than 15 mm h-1, it was observed that 86% of them occurred between 15 and 22 UTC (12 and 19 LT, respectively), and 55% occurred during the rainy season. On the other hand, considering events that caused rainfall equal to or greater than 1 mm h-1, it was observed that the highest frequency occurred in the same interval, approximately, with a maximum at 19 UTC (16 LT). That is, lower and higher intensity rains are directly related to greater convective activity, which occurs in the region during the afternoon and early evening.
The variation in the vertical profile of the air temperature was small, but there was a tendency for it to be greater when SCE occurred, mainly on the surface up to approximately 800 hPa. And the average values of this variable indicate different behaviors, between the rainy and less rainy seasons, in the intensification of shallow and deep convection.
The average humidity profiles showed behaviors similar to those analyzed on a case-by-case basis. It was observed that the maximum variations, in the DCE and SCE profiles, occurred in the 850 to 500 hPa layer, indicating that the humidity in this layer has great importance for the convective activity. It was also seen that during the rainy season the atmosphere was more humid (less humid) before (at the time) the occurrence of DCE. And the same occurred in the less rainy season, between the surface and 850 hPa, because in the medium and high troposphere the humidity was higher before the (on the hour) occurrence of SCE (DCE).
For all the cases analyzed, the zonal component of the wind showed a predominance of easterly winds throughout the entire troposphere, mainly during the less rainy season, when the study area receives greater influence from the southeast trade winds. The southern component was weaker and had irregular profiles, with more significant variations during the less rainy season. In both components, on average, strong shear from the surface to 850 hPa was observed, in both seasons, for all events, but mainly for cases of DCE, showing that the wind shear has a significant role in deep convection.
On the other hand, the analysis of the stability of the atmosphere, carried out through CAPE, showed that it was greater than zero in all the analyzed events, agreeing with the limit condition for the formation of convection. Case-by-case analyzes show that dynamic forcing plays an important role in the formation of intense convection, from the shallowest to the deep- est. While, the average values showed that the highest values of CAPE were observed about 2 to 3 hours before DCE and SCE, while the lowest values occurred in the hour of rain, since the rain reduces the CAPE. In addition, the highest mean values of CAPE were observed when DCE occurred during the rainy season, and in the cases of SCE the CAPE was higher during the less rainy season.
Although some results are similar to those already found by other authors, it is important to emphasize that in this research it was prioritized to use precipitation events equal to or greater than 15 mm h-1, and precipitation events equal to or greater than 1 mm h-1 were used with the objective of obtaining more events to differentiate the behavior of DCE and SCE between the rainy and less rainy seasons, since, in the first classification, the number of events was low. And even if using different precipitation intensity criteria, it was possible to observe similar results between the two data sets. Therefore, the results presented in this article may be relevant for numerical modeling studies and to be used as indicators of convective events in the short-term forecast. However, it is of fundamental importance to use a larger sample of events to analyze, mainly, the effect of seasonality.

