


 nueva página del texto (beta)
 Inglés (pdf)
 Artículo en XML
 Referencias del artículo
 Enviar artículo por email
 Citado por SciELO
  Similares en
SciELO
Similares en
SciELO 
 Permalink
1. Introduction
The city of Rio de Janeiro (CRJ) is located in the Southeast region of Brazil and is the capital of Rio de Janeiro state (RJ), which is an important economic, cultural, and tourist center in the country. The city is considered a World Heritage Site by the United Nations Educational, Scientific, and Cultural Organization (UNESCO) and is the second-largest Brazilian metropolis, responsible for the second-largest Gross Domestic Product (GDP) in the country. The presence of three massifs (Tijuca, Pedra Branca and Gericinó), the proximity of the Atlantic Ocean, the Guanabara Bay and the Sepetiba Bay (Fig. 1), produce a great spatial variability of precipitation in the region, which according to Pristo et al. (2018) varies between 912 mm of total annual rainfall in the north of the city and 2546 mm over the Tijuca massif.
During the rainy season (from October to April), much of the Southeast region of Brazil is affected by the occurrence of heavy rainfall events (HRE) that cause natural disasters such as landslides and floods, which have strong impacts on the population (Seluchi and Chou, 2009; Dereczynski et al. 2017; Nery and Malvestio, 2017; Reboita et al., 2017).
Several of these extreme events are caused by the South Atlantic Convergence Zone (SACZ), known as one of the main systems modulating the weather and climate in Brazil during the rainy season. The SACZ is characterized by a persistent cloud-band oriented northwest-southeast from the Amazon Basin to the South Atlantic Ocean, affecting the North, Central-West and Southeast regions of Brazil, north of Paraná state and southern part of Bahia state (Kousky, 1988; Kodama, 1992; Quadro, 1994; Carvalho et al., 2004).
The SACZ is associated with 13% of the HRE that occur in the CRJ, while frontal systems are responsible for 77% of the cases since these occur throughout the year (Dereczynski et al., 2009). Dolif and Nobre (2012) identified 32 HRE in the CRJ between January 2000 and December 2010, and of these 37% were caused by SACZ and 47% by cold fronts. Considering only the rainy season in the Southeast region of Brazil, Lima et al. (2010) found a total of 157 HRE, of which 74 cases (47%) were associated with SACZ and 83 cases (53%) with frontal systems. Despite the lower frequency of SACZ episodes associated with HRE in the CRJ, even during the rainy season, SACZ has the potential to produce higher rainfall totals compared to frontal system events, as SACZ remains stationary for several days over the same region, causing rainfall intensification (Marchioro et al., 2016), mainly in late spring and summer months (Grimm, 2011).
Between 11 and 20 January 2011, a SACZ event caused extreme rain in large parts of the RJ becoming the largest climatic catastrophe in Brazil’s history. On 12 January the intense and voluminous rain affected the CRJ and especially the cities in the mountainous areas of RJ, with successive episodes of mass landslides (Dourado et al., 2012) that caused the death of 905 people and more than 200 disappeared (Dereczynski et al., 2017; Nery and Malvestio, 2017). This episode culminated with the creation of the Brazilian National Centre for Monitoring and Early Warnings of Natural Disasters (CEMADEN - http://www.cemaden.gov.br/).
Cold fronts, baroclinic troughs (Escobar et al., 2019) and extratropical and subtropical cyclones (Kousky, 1979; Reboita et al., 2010; Gozzo et al., 2014; Rocha et al., 2019) are the main surface meteorological systems identified by weather forecasters in the synoptic charts related to SACZ episodes during the rainy season in Brazil. The atmospheric circulation pattern associated with these meteorological systems, when positioned on the coast of southeastern Brazil, maintains the moisture convergence at low levels and, consequently, contributes to the intensification of precipitation.
The Bolivian High (Lenters and Cook, 1997) and the trough of the Northeast region of Brazil (Kousky and Gan, 1981) are the main upper-level meteorological systems observed during the Brazilian rainy season having important contribution in the SACZ episodes. The mean atmospheric circulation pattern associated with both systems (Bolivian High and the trough of the Northeast region of Brazil) promotes strong divergence at high levels and, consequently, maintains the convective precipitation observed in much of the Central-West, Southeast and North regions of Brazil.
Escobar (2019) performed a synoptic classification at the surface and mid-troposphere during the rainy season in Brazil (November to March), using the Principal Component Analysis (PCA) methodology. The study identified four main synoptic patterns during the rainy season, and the most frequent was related to SACZ events, with the presence of a stationary front close to the coast of São Paulo state and RJ and with the South Atlantic Subtropical Anticyclone (SASA) positioned to the south of its climatological position. A similar synoptic pattern of SACZ was found by Weide-Moura et al. (2013) in their synoptic classification related to the occurrence of HRE in the CRJ. With such a surface circulation pattern, the maritime winds from the southeast persist for several days on the coast of São Paulo state and RJ, favoring the intensification of rain.
Considering that the HRE that occur in the CRJ under the influence of SACZ episodes trigger events with strong impacts on the population, the knowledge of the behavior of these episodes is very important for city planners to mitigate their impacts. Therefore, taking into account the importance that the SACZ events represent in the modulation of precipitation in this region during the rainy season, the objective of this study is to describe the dynamic and thermodynamic characteristics associated with such events through the development of a synoptic climatology.
This paper is organized as follows: section 2 details the data and the methodology used in this study, section 3 analyzes the synoptic features and identifies the principal surface weather patterns associated with SHRE in the CRJ, and section 4 presents the conclusions.
2. Data and Methodology
2.1. Data
The studied period comprises 10 rainy seasons, considered here as the months between October and April of 2006-2016. So, the first rainy season or the “2007 rainy season” extends from October 1, 2006, to April 30, 2007, and the last one or the “2016 rainy season” extends from October 1, 2015, to April 30, 2016. This studied period is referred to as “October-April/2006-2016”.
The SACZ episodes were identified by analyzing the surface and upper levels (850 hPa, 700 hPa, 500 hPa, and 250 hPa) synoptic charts at 1200 UTC October-April/2006-2016, using the methodology described in Escobar and Matoso (2018). Those charts were prepared by the weather forecasters from the Brazilian Center for Weather Forecasts and Climate Studies (CPTEC) - National Institute for Space Research (INPE).
Brightness temperature (K) images from the Geostationary Operational Environmental Satellite (GOES; 10, 12, and 13) from CPTEC-INPE were also used to identify the cloudiness associated with the SACZ meteorological situations.
To identify the SACZ episodes that caused rain in the CRJ (SCRJ), daily precipitation maps were built using the MERGE product (Rozante et al., 2010), with a spatial resolution of 0.2º latitude x 0.2º longitude. These daily precipitation maps were constructed for each SACZ episode to verify if the rain band was established over CRJ. MERGE results from the combination of surface observations over the South American continent with Tropical Rainfall Measuring Mission (TRMM) satellite precipitation estimates.
The HRE detection criterion in the CRJ was defi- ned through the use of precipitation data observed every 15 minutes at the Rio Alert System from the Municipality of Rio de Janeiro. Twenty six rain gauge stations in the CRJ were used for this work (Fig. 1).
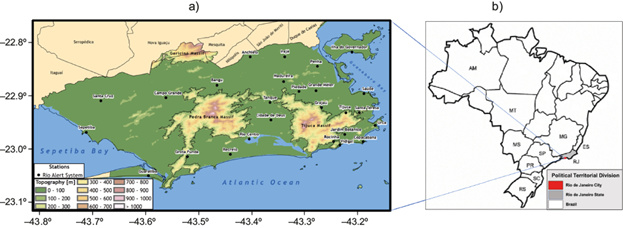
Fig. 1 a) Topography (m) of the city of Rio de Janeiro (RJ). Black circles show the rain gauge stations of the Rio Alert System used in this work; b) Brazilian map, showing the Rio de Janeiro State (RJ) in gray and the city of Rio de Janeiro (CRJ) in red. The location of the other states cited in this article are also shown: Amazon (AM), Espírito Santo (ES), Minas Gerais (MG), Mato Grosso do Sul (MS), Mato Grosso (MT), Paraná (PR), Rio Grande do Sul (RS), Santa Catarina (SC) and São Paulo (SP).
In order to study the synoptic characteristics associated with SACZ episodes related to the occurrence of HRE in the CRJ (SHRE), daily (1200 UTC) gridded reanalysis meteorological data from the National Centers for Environmental Prediction (NCEP) Climate Forecast System Reanalysis (CFSR) were used. The CFSR version 1 (CFS-v1 - Saha et al., 2010) covers the period from January 1979 to March 2011. The CFSR version 2 (CFSv2 - Saha et al., 2014) was released in March 2011, and it has been running operationally since then. Both (CFSv1 and CFSv2) have a horizontal native resolution of T382 (~38 km). Their horizontal resolution is 0.25º × 0.25ºlatitude/longitude between 10ºS and 10ºN, reducing gradually towards the poles, reaching 0.5º between 30ºN and 30ºS. The CFSR meteorological variables used were: i) mean sea-level pressure (hPa); ii) 850 hPa specific humidity (gkg-1); 850 hPa wind components (ms-1), and iii) 850, 500 and 250 hPa geopotential height (gpm) from October-April/2006-2016.
2.2. Detection of SHRE
The SACZ episodes were identified by analyzing the surface and upper synoptic charts at 1200 UTC from October-April/2006-2016. The dates of the SACZ events were selected using the methodology presented by Escobar and Matoso (2018) in which the following characteristics should appear simultaneously in the synoptic charts:
a cold front or a baroclinic trough located over the ocean, near the coast between São Paulo and Espírito Santo states,
a trough at mid- (500 hPa) and upper troposphere (250 hPa) located over the Southeast region of Brazil or the southern part of the Northeast region of Brazil,
a polar jet stream (250 hPa) coupled with a subtropical jet stream associated with the surface cold front at the surface,
a subtropical jet stream associated with the baroclinic trough at the surface,
a horizontal equivalent potential temperature gradient at 850 hPa pointing from the Atlantic Ocean to the continent,
a northwesterly flow at 850 hPa extending from the Amazon Basin to the Atlantic Ocean and through the Central-West and Southeast regions of Brazil,
a homogeneous region where the upward motion at 500 hPa is in phase with the convergent flow at 850 hPa and the precipitable water values are greater than 45 mm and
a low-level convergence zone and the pre-sence of a band of cloudiness persisting for at least 3 consecutive days.
After identifying SACZ cases by applying the above criterion, daily precipitation maps were cons- tructed using MERGE data, to identify the SACZ cases that caused rain on the CRJ (SCRJ). The Dereczynski et al. (2009) criterion was used to select the SACZ cases that produced HRE in the CRJ (SHRE), which considers an HRE when the 24 h accumulated rainfall reaches the threshold of 30 mm in at least 4 of the 26 meteorological stations considered in this study. The 24 h accumulated rainfall was computed using the rainfall data observed every 15 minutes, from 1215 UTC on the previous day until 1200 UTC on the day in question.
Because a SACZ event lasts at least 3 days, in several episodes the criterion for HRE in the CRJ was verified in more than one day. The frequency of SHRE was caculated if at least one day of heavy rainfall during the SACZ event ocurred. Moreover, to compute the monthly frequency of SHRE, the SACZ month is considered regarding the first SACZ day. For example, if one episode begins on February 29 and lasts for 5 days, this event will be considered a February case.
2.3. Composite fields
After the selection of the SHRE, average composite fields and anomaly composite fields of atmospheric variables mentioned in section 2.1 for two days before the initial day (D-2), one day before the initial day (D-1), and at the initial SHRE day (D0) were calculated, to identify the synoptic features associa- ted with such episodes. For example, for the first SHRE (29 November 2006 -12 December 2006), D-2 is 27 November, D-1 is 28 November and D0 is 29 November 2006. It is important to emphasize that the D0 is always taken as the first day of the SACZ episode, regardless of when the HRE was observed. Composite fields were constructed in the spatial domain of 10ºN-55ºS and 80º-20ºW for all variables. Climatology fields are constructed for the whole period comprising the 10 rainy seasons, from “2007 rainy season” to “2016 rainy season”. Average and anomaly composites were calculated considering the October-April/2006-2016 climatology. The composite fields for D-2, D-1, and D0 were useful for tracking the evolution of the synoptic systems responsible for the SHRE.
2.4. Synoptic classification
After identifying the mean synoptic characteristics associated with SHRE, a synoptic classification at the surface was performed through the Principal Pattern Sequence Analysis (PPSA; Compagnucci et al., 2001; Escobar et al., 2004; Huth et al., 2008). According to Compagnucci et al. (2001), the PPSA is considered an extension of the traditional Principal Component Analysis (PCA), with a correlation matrix in T-Mode (Green and Carrol, 1978; Richman, 1986; Escobar et al., 2016), whose main objective is to obtain the evolution of the principal dominant modes of atmospheric circulation for specific meteo- rological situations. Thus, in this application, each variable is a sequence of the consecutive spatial mean sea level pressure patterns, and the correlation matrix represents the correlation between sequences.
In order to explore the synoptic variability where the surface baroclinic systems are more associated with SHRE, a smaller domain (5ºS-40ºS, 30ºW-80ºW) was used for the calculation of the composites fields. The matrices are composed by mean sea level pressure data of the 37 SHRE x 7171 grid points for 3 days: D-2, D-1, and D0. With such an objective methodology, it is possible to identify subgroups or types of fields with the same spatial structure.
After the application of the PPSA, the Varimax rotation (Richman, 1986) was performed. This metho- dology is useful to redistribute the total variance of the data among the components in order to emphasize the physical meaning of the Principal Pattern Sequence (PPS) that is generated (Richman,1986). The optimum number of rotated PPSs was determined by the eigenvalue 1.0 rule (Richman et al., 1992).
The real meteorological fields correlated significantly with the Principal Pattern Sequences (PPSs) were determined through temporal series of factor loadings that represent the correlations between the variable used (real meteorological field) and each PPS (Richman, 1986).
The analysis of the component loadings allows the evaluation of the representative patterns (obtained from PPSA) as real atmospheric circulation fields (registered in the reanalyses). Values of component loadings closer to 1 represent sequences of atmospheric circulation fields similar to the obtained pattern sequence (Harman, 1976; Cattell, 1978).
The spatial field of the PPSs can be interpreted in both their positive and negative phases (Compagnucci and Salles, 1997). PPSs are related to two different synoptic patterns that have the same shape. For positive values of component loadings (direct mode), PPSs have the same sign as the meteorological variable under study. For example, positive (negative) values of sea level pressure, represent high (low) pressures in the PPSs. Conversely, for negative values of component loadings (indirect mode), PPSs have the opposite sign as the real meteorological fields. Therefore, positive (negative) values represent low (high) pressures. In this study, the values of component loadings (figures not shown) were positive, meaning that the PPSs have the same sign as the meteorological fields (weather type).
3. Results
3.1 SACZ Climatology
The dates of the 95 SACZ episodes (9.5 events per year) identified in the 10-year (October-April/2006-2016) are listed in Table I. The longest SACZ event took place in December 2013 and lasted for 15 days (12/Dec/2013 - 26/Dec/2013). The other three longest SACZ events (all lasting 12 days) took place in the periods 13/Nov/2008-24/Nov/2008, 01/Mar/2010-12/Mar/2010, and 27/Dec2010-07/Jan/2011.
Table I Start and end dates (month/date/year) of the 95 SACZ episodes that occurred over Brazil in the 10-year period (October-April/2006-2016).
| Start Date | End Date | Start Date | End Date | Start Date | End Date |
| 17/10/2006 | 20/10/2006 | 28/10/2009 | 01/11/2009 | 09/01/2013 | 17/01/2013 |
| 10/11/2006 | 12/11/2006 | 04/12/2009 | 09/12/2009 | 26/01/2013 | 30/01/2013 |
| 29/11/2006 | 01/12/2006 | 13/12/2009 | 15/12/2009 | 04/02/2013 | 10/02/2013 |
| 08/12/2006 | 16/12/2006 | 21/01/2010 | 23/01/2010 | 27/02/2013 | 04/03/2013 |
| 27/12/2006 | 29/12/2006 | 01/03/2010 | 12/03/2010 | 27/03/2013 | 30/03/2013 |
| 21/01/2007 | 25/01/2007 | 28/03/2010 | 31/03/2010 | 18/10/2013 | 20/10/2013 |
| 30/01/2007 | 05/02/2007 | 27/10/2010 | 29/10/2010 | 05/11/2013 | 09/11/2013 |
| 12/02/2007 | 16/02/2007 | 01/11/2010 | 04/11/2010 | 12/12/2013 | 26/12/2013 |
| 19/03/2007 | 22/03/2007 | 01/12/2010 | 04/12/2010 | 17/01/2014 | 20/01/2014 |
| 23/10/2007 | 25/10/2007 | 14/12/2010 | 18/12/2010 | 15/02/2014 | 19/02/2014 |
| 04/11/2007 | 06/11/2007 | 27/12/2010 | 07/01/2011 | 28/02/2014 | 02/03/2014 |
| 27/11/2007 | 02/12/2007 | 11/01/2011 | 20/01/2011 | 06/03/2014 | 10/03/2014 |
| 12/12/2007 | 15/12/2007 | 15/02/2011 | 17/02/2011 | 22/03/2014 | 24/03/2014 |
| 19/12/2007 | 23/12/2007 | 28/02/2011 | 10/03/2011 | 26/10/2014 | 29/10/2014 |
| 06/01/2008 | 11/01/2008 | 04/04/2011 | 07/04/2011 | 15/11/2014 | 19/11/2014 |
| 20/01/2008 | 23/01/2008 | 02/10/2011 | 07/10/2011 | 27/11/2014 | 30/11/2014 |
| 30/01/2008 | 02/02/2008 | 16/10/2011 | 20/10/2011 | 14/12/2014 | 17/12/2014 |
| 03/02/2008 | 08/02/2008 | 01/11/2011 | 04/11/2011 | 24/12/2014 | 26/12/2014 |
| 24/02/2008 | 08/03/2008 | 23/11/2011 | 05/12/2011 | 05/02/2015 | 09/02/2015 |
| 13/03/2008 | 18/03/2008 | 09/12/2011 | 12/12/2011 | 16/02/2015 | 19/02/2015 |
| 13/11/2008 | 24/11/2008 | 15/12/2011 | 22/12/2011 | 27/02/2015 | 01/03/2015 |
| 03/12/2008 | 06/12/2008 | 26/12/2011 | 30/12/2011 | 09/03/2015 | 14/03/2015 |
| 12/12/2008 | 21/12/2008 | 01/01/2012 | 09/01/2012 | 17/03/2015 | 20/03/2015 |
| 25/12/2008 | 31/12/2008 | 15/01/2012 | 21/01/2012 | 22/03/2015 | 25/03/2015 |
| 04/01/2009 | 09/01/2009 | 26/01/2012 | 31/01/2012 | 06/04/2015 | 08/04/2015 |
| 21/01/2009 | 23/01/2009 | 11/02/2012 | 13/02/2012 | 28/10/2015 | 30/10/2015 |
| 29/01/2009 | 31/01/2009 | 16/03/2012 | 21/03/2012 | 14/01/2016 | 19/01/2016 |
| 12/02/2009 | 15/02/2009 | 24/03/2012 | 26/03/2012 | 20/01/2016 | 23/01/2016 |
| 13/03/2009 | 17/03/2009 | 04/11/2012 | 08/11/2012 | 29/02/2016 | 05/03/2016 |
| 25/03/2009 | 02/04/2009 | 14/11/2012 | 22/11/2012 | 10/03/2016 | 14/03/2016 |
| 08/04/2009 | 11/04/2009 | 26/11/2012 | 28/11/2012 | 24/03/2016 | 27/03/2016 |
| 08/10/2009 | 12/10/2009 | 15/12/2012 | 17/12/2012 |
The dates of the 77 SCRJ and 37 SHRE events are highlighted in bold and gray, respectively. The rest of the dates correspond to SACZ episodes outside the CRJ.
In the CRJ, 77 episodes of SACZ (SCRJ) were configured (highlighted in bold in Table I), representing 81% of the total SACZ events in Brazil. As was mentioned in Section 2.2, in several episodes of SACZ, the criterion for HRE in the CRJ was reached in more than one day during the entire period of the event. Considering the episodes of SCRJ with at least one day of HRE (SHRE), 37 cases were identified (highlighted in gray in Table I). This indicates that almost half (48%) of the total SACZ events configured in the CRJ cause heavy rainfall in the city.
During the 37 SHRE episodes, the rainfall reached the HRE threshold in 51 days. A total of 22 of these 51 days (43.1%) occurred on the first day of the SHRE episode, and in 13 of these 51 days (25.5%), the rainfall reached the HRE threshold on the second day, totalizing 68.6% of the heavy rainfall days occurring in the first two SHRE days. This result indicates that the beginning of an SHRE, which in general is associated with the arrival of a frontal system, is more likely to cause heavy rainfall in the CRJ compared to the other days of the event. The other HRE occurred in the third (11.8%), fourth (3.9%), fifth (7.8%), sixth (5.9%) and eighth (2.0%) SHRE days. No HRE occurred in the seventh day.
The mean daily precipitation in the 51 heavy rainfall days during the 37 SHRE episodes is presented in Figure 2. The SACZ rainfall band, extending in the NW-SE direction from the Amazon region through de Atlantic Ocean, is evident in Figure 2. Although the daily precipitation varies from 10 to 15 mm/day over RJ, it is in the Atlantic Ocean, around 27ºS/40ºW, where it achieves its maximum intensity (35 mm/day). Figure 3 presents the frequency of the 95 SACZ, 77 SCRJ, and 37 SHRE episodes organized by their duration, lasting just 3 days, only 4 days, and so on, until 15 days. It is clear from Figure 3 that most of the episodes lasted between 3 and 6 days. The higher frequency of the SACZ and SCRJ events was 4 days, and the higher frequency of the SHRE was 5 days.
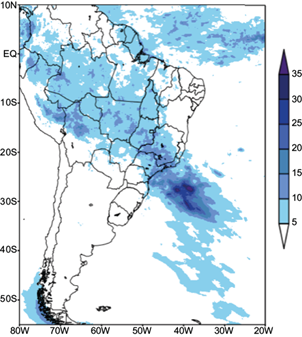
Fig. 2 Mean precipitation (mm/day) accumulated in 51 heavy rainfall days during the 37 SHRE. (Source: MERGE - Rozante et al., 2010).
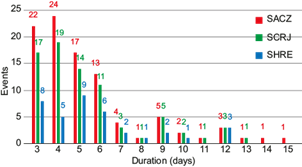
Fig. 3 Total number of the 95 SACZ, 77 SCRJ and 37 SHRE distributed by their duration (in days) during the studied period (October-April/2006-2016).
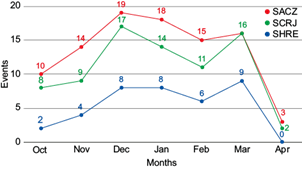
The monthly distribution of the 95 SACZ, 77 SCRJ, and 37 SHRE (Fig. 4) shows an increase in their frequency from October through January, which peaks in the middle of the rainy season. A small rise in the frequency from February to March is also seen, which can be explained by two reasons: First, the month of February is shorter than the others, reducing the chance of a SACZ occurrence during that month. And, second, temperature and humidity are still high in March, but coincide with the first stronger cold fronts that begin their journey inside the continent, promoting the formation of more SACZ events. As mentioned before, Figure 4 also shows that most of the SACZ events that occurred in Brazil reached the CRJ (SCRJ). It is noteworthy that during March, all 16 SACZ events reached the CRJ (SCRJ), and during April, none of the 2 SCRJ produced HRE.
3.2 Synoptic climatology associated with SHRE
3.2.1 Composites of average and anomalies
In order to identify the main synoptic features associated with SHRE as well as their differences in relation to climatology, composites of average and anomalies were calculated of the variables described in section 2.1. Thirty seven SHRE are considered, which correspond to the total cases identified during the studied period (October-April/2006-2016).
The composites of average and anomalies of the 500 hPa geopotential height and mean sea level pressure, associated with SHRE for D-2, D-1 and D0 are shown in Figure 5. The fields of 500 hPa geopotential height average composites (Fig. 5a) show a slightly amplified frontal trough located near Buenos Aires Province (Argentina) on D-2 that intensifies and amplifies as it moves northeastward and reaches the eastern part of Santa Catarina state on D0. There is another weak trough positioned between northern Argentina and southern Bolivia on D-2, which in the following days connects with the previously mentioned trough. Note that there is a strong geopotential height gradient located to the south of 40ºS, and in this intense baroclinic flow, there are several cyclonic disturbances with a slight amplification that move rapidly eastwards.

Fig. 5 500 hPa geopotential height (gpm in shaded) and mean sea level pressure (hPa in lines) SHRE composites: a) average and b) anomalies. From left to right: D-2, D-1, and D0. CHL= Chaco Low; H=High; L=Low; SASA=South Atlantic Subtropical Anticyclone.
The mean sea level pressure average composites (Fig. 5a) show a weak cold front located between the Atlantic Ocean and southern Rio Grande do Sul state on D-2, which moves northeastwards in the subsequent days. On this day (D-2), there is a low-pressure system of 1010 hPa related to the Chaco Low, which is located over Paraguay. On D-1, this frontal system is located approximately to the southeast of the Santa Catarina state without reaching the coast of southeastern Brazil on D0. A similar pattern was observed by Andrade and Cavalcanti (2018) during heavy rainfall summer fronts over southeastern Brazil. Note also that the SASA is located around 30ºS, 20ºW, and slowly moves eastwards over the entire analyzed period. The 500 hPa trough that advances from northern Argentina and southern Bolivia contributes to the formation of a wide low-pressure system of 1012 hPa over the Atlantic Ocean, to the south of RJ during D0. On this day, this cyclone is connected to the cold front and both of these systems con- tribute to the intensification of the moist air mass convergence over the coast of RJ, including the CRJ.
The composite anomalies of 500 hPa geopotential height and sea level pressure are shown in Figure 5b. This combination of levels shows the displacement of a typical baroclinic system, with the 500 hPa wave positioned to the west of the surface wave.
Negative anomalies of mean sea level pressure and geopotential height observed respectively at the surface and the 500 hPa level, allow the identification of the mid-troposphere trough and the cold front at the surface. On the other hand, the positive anoma- lies at both of the levels identify the ridge and the post-frontal anticyclone, respectively at mid- level and at surface. On D-2, there are negative height anomalies with a minimum of -10 gpm at 500 hPa located over northeastern Argentina and Uruguay. This pattern is related to the frontal trough at mid-level that moves northeastwards during the following days. In the South Atlantic Ocean, to the southeast of the Malvinas Islands, there is a minimum of -20 gpm at the 500 hPa level on D-2, associated with a cyclonic disturbance that exhibits a rapid zonal displacement during the analyzed period. The minimum related to the frontal trough intensifies during the subsequent days reaching a minimum value of -40 gpm near 37ºS, 40ºW on D0. Similar behavior is observed at the surface, with slight negative anomalies over RJ of the order of -1 hPa to -2.5 hPa on D-1 and D0, respectively. On SACZ day (D0), a minimum of -5 hPa is observed over the Atlantic Ocean around 42ºS, 30ºW, associated with the low-pressure system related to the cold front mentioned in Figure 5a.
The composites of average and anomalies of streamlines and 850 hPa specific humidity associated with SHRE are shown in Figure 6. The composite of streamlines at 850 hPa (Fig. 6a) show the typical mean circulation pattern over South America during the rainy season in Brazil. There is a clear northerly/northwesterly flow over continental areas during the analyzed period. This circulation pattern at low levels is determined by the trade winds that penetrate to the north of the continent and deviate by the action of the Andes Cordillera, and by the winds coming from the Atlantic Ocean related to the presence of the SASA. On D-2, there is northerly wind over the RJ, determined by the western edge of the SASA since the flow from the Amazon region is directed to the northern part of southern Brazil. On D-1, the flow caused by the SASA persists over the RJ, and the influence of the Amazonian flow is beginning to be observed. During D0, there is a large influence of the Amazonian flow over RJ and a smaller contribution from the wind from the Atlantic Ocean. This change in the atmospheric circulation at the 850 hPa level is related to the advance of a frontal trough that on D-2 is observed approximately in the farther south of Rio Grande do Sul state and on D0 is identified over the Atlantic Ocean, close to São Paulo state. On D-2 the Chaco Low can also be observed in southern Bolivia and western Paraguay, which is connected with the frontal trough mentioned above. On D-1, the frontal trough is near the coast of Santa Catarina state and, simultaneously, another trough can be observed further to the north with its axis extending between southern Bolivia and the far west of Santa Catarina state. On D0, this trough advances northeastwards, extending between southern Mato Grosso state and northern Paraná state, where a low-pressure system forms. With such low-level atmospheric circulation, the RJ is affected by warm and moist air transported from the Amazon Basin.
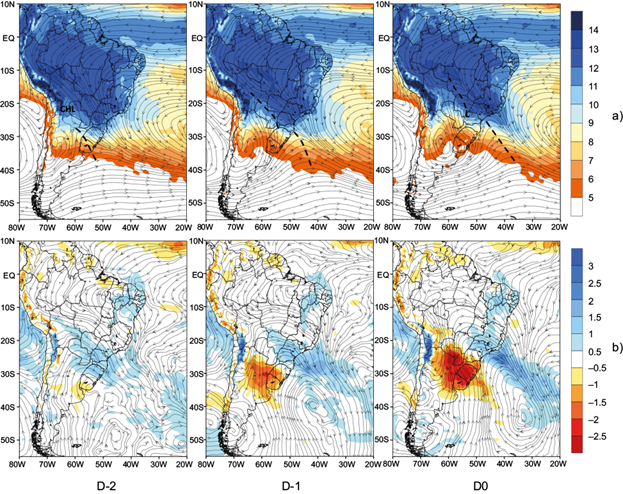
Fig. 6 850 hPa streamlines and 850 hPa specific humidity (gkg-1 in shaded) SHRE composites: a) average and b) anomalies. From left to right: D-2, D-1, and D0. CHL= Chaco Low.
The composites of 850 hPa specific humidity (Fig. 6a) show high values over most of the North, Central-West and Southeast regions of Brazil, of the order of 12 to 14 gkg-1, typical of the rainy season in Brazil. The specific humidity shows an increase over RJ from approximately 10 to 13 gkg-1 between D-1 and D0. This increase is related to the change in the wind direction from northerly to northwesterly, as previously described. Also, as noted by Moraes et al. (2020), when studying mesoscale convective complexes forming in subtropical South America, the moisture increase results from the enhanced convergence between the flows coming from the Amazon Basin and the Atlantic Ocean. It is noteworthy that during the rainy season the specific humidity over the southeast region is very high due to the combination of high temperatures and the persistent northerly flow from the Atlantic Ocean and from the northern Brazil.
The 850 hPa streamline composite anomaly fields (Fig. 6b) show the zonal displacement of cyclonic anomalies that on D-2 are centered over Uruguay and in the following days move over the Atlantic Ocean, approximately south of 40ºS and between 40ºW and 30ºW. This anomalous pattern is mainly associated with the displacement of the cold front described previously (Fig. 6a). The anomalous trough associated with these cyclonic anomalies extends from the southern Amazon Basin to the South Atlantic Ocean, determining a band of negative anomalies that affects much of southeastern Brazil, especially since D-1. A similar configuration was found by Doss-Gollin et al. (2018) when they analyzed 850 hPa anomaly fields associated with the occurrence of heavy rainfall in the central-southern Paraguay. The authors identified a circulation pattern with cyclonic anomalies over the Atlantic Ocean, southeast of southern Brazil, one day after the occurrence of heavy rainfall in Paraguay.
The specific humidity composite anomaly fields (Fig. 6b) are consistent with the anomalous atmos- pheric circulation pattern described above. There is a large area of positive anomalies of specific humidity located over northeastern Argentina, Paraguay, southern Brazil, most of Mato Grosso do Sul state and the western and southwestern part of São Paulo state during D-2, showing small values (~1 gkg-1-1.5 gkg-1). On D-1, these positive anomalies are located to the east of the anomalous trough, affecting most of the states of Paraná, Mato Grosso do Sul, and São Paulo, and the adjacent Atlantic Ocean. Moreover, negative anomalies of specific humidity varying between -1 and -2 gkg-1 are also observed over Uruguay, northeastern Argentina and central-western Rio Grande do Sul state, related to the advection of dry air produced by the advance of the post-frontal anticyclone (Fig. 4a). On D0, the positive anomalies are located over the São Paulo and RJ states, western and southern Minas Gerais state and in the adjacent Atlantic Ocean. In addition, the negative anomalies are more intense comparing to D-1, affecting Uruguay, northeastern Argentina, most of Paraguay, Rio Grande do Sul state and most of Santa Catarina state.
An interesting feature to mention is the esta- blishment of a “dipole” configuration in the specific humidity anomalies fields during D0. This dipole, also called the seesaw pattern, is determined by the presence of positive anomalies in southeastern Brazil and by the presence of negative anomalies in the South, in agreement with Nogués-Paegle and Mo (1997).
The composites of average and anomalies of 200 hPa streamlines and geopotential heights associated with SHRE are shown in Figure 7. Average compo- sites (Fig. 7a) allow identifying a typical upper-level atmospheric circulation pattern of the rainy season in Brazil, with the presence of the Bolivian High and the trough in the Northeast region of Brazil. This pattern is observed in climatology during the rainy season regardless of the occurence of SACZ events because it is associated with strong convective activity in the Amazon Basin (Lenters and Cook, 1997). On D-2, there is a trough with its axis extending from central Argentina to the Atlantic Ocean that intensifies as it propagates eastwards over the following days. On D-1, the axis of this trough is positioned approximately between northeastern Argentina and the Atlantic Ocean and on D0 it reaches southern Brazil, extending between Paraná state and the Atlan- tic Ocean.

Fig. 7 200 hPa streamlines and 200 hPa geopotential height (gpm in shaded) SHRE composites: a) average and b) anomalies. From left to right: D-2, D-1, and D0. BH=Bolivian High.
This upper-tropospheric trough shows an intense horizontal geopotential height gradient that is associa- ted with the cold front identified at the surface and at the 850-hPa level. On D0, this upper-level trough increases the divergent flow over RJ and southern Minas Gerais state, contributing to the intensification of the convergence flow at the surface. Therefore, with such upper-level atmospheric circulation pa- ttern, the precipitation will intensify over the study area during the SHRE.
The Bolivian High appears practically stationary over Bolivia during the analyzed period; however, its associated ridge changes position particularly from D-1. On D-2, the axis of the ridge extends southward from Bolivia to the northeastern part of Southern Brazil. The ridge moves towards southeastern Brazil on the following days and on D0 it appears approximately over RJ, southern Espírito Santo state and central-southern Minas Gerais state. Simultaneously, the trough in the Northeast region of Brazil moves slightly to the west as the ridge intensifies towards the Southeast region of Brazil. The change in the upper-level atmospheric circulation associated with both of the systems (the ridge and the trough of the Northeast region of Brazil) is related to the advance of the frontal trough from mid-latitudes.
The 200 hPa streamline and geopotential height anomaly fields (Fig. 7b) reveal a well-defined wave train that propagates northeastward, with an anomalous ridge over the South Pacific Ocean and southern South America and an anomalous trough over most southern Brazil. There are positive geopotential height anomalies on D-2 over most southern Brazil and Paraguay and part of Mato Grosso do Sul and São Paulo states, with values varying between 10 and 20 gpm. These positive anomalies increase the intensity and propagates eastwards on D-1, reaching the RJ and the southern part of MG and Espírito Santo states. Anti- cyclonic anomalies are located over the Atlantic Ocean on D0, centered to the southeast of RJ but nevertheless affecting most of RJ, MG and Espírito Santo states. On this day, the highest anomalies are of the order of 20 to 30 gpm over RJ, southern part of Espírito Santo state and the south of Minas Gerais state. These positive anomalies are associated with the intensification of the ridge described in Figure 6a, indicating strong divergence at upper levels and, consequently mantaining moisture convergence at low levels. Thus, such an anomalous upper-level atmospheric circulation pattern is related to the mean position of the band of cloudiness associated with SHRE that contributes to precipitation intensification in the CRJ.
The negative anomalies show a pattern similar to that observed at the 500 hPa level (Fig. 4b). On D-2, there is a band of a cyclonic anomaly of streamline oriented northwest-to-southeast, from northern Argentina to the South Atlantic Ocean. The highest values of the negative geopotential height anomalies are of the order of -10 gpm to -20 gpm, located approximately to the east of the Buenos Aires Province (Argentina) and the adjacent Atlantic Ocean. On D-1, these negative anomalies intensify as they move eastwards and cover northeastern Argentina, most of Uruguay and the Rio Grande do Sul state. On D0, the negative anomalies continue increasing in intensity, showing values of approimately -60 gpm in southeastern Rio Grande do Sul state and the adjacent Atlantic Ocean. On this day, the cyclonic streamline anomalies extend from southern Bolivia to the South Atlantic Ocean. A similar configuration at high levels was found by Nielsen et al. (2019) when they studied the SACZ episodes during the South American Monsoon period. The authors identified the presence of cyclonic anomalies between southern Brazil and the adjacent Atlantic Ocean associated with the presence of SACZ located in different positions.
In the Tropical Atlantic Ocean east of the Northeast region of Brazil, there are cyclonic streamline anomalies affecting the area where the trough of the Northeast region of Brazil acts during the rainy season. This result is in agreement with Carvalho (1989) who suggests that the most intense SACZ events are associated with more intense trough of the Northeast region of Brazil.
3.2.2. Synoptic patterns associated with SHRE
The synoptic classification at the surface associated with SHRE, identified seven PPSs that explain 83.8% of the total variance, with the first four PPSs representing 69.8% of that total (Table II). The remaining PPSs were not considered in the analysis because their series of component loadings presented values lower than 0.5. The four PPSs associated with SHRE are shown in Figure 8.
Table II Percentages of explained variance (P. Var) and the cumulative percentages (P. C.Var) explained by the different PPSs.
| PPS | P. Var (%) | P. C. Var (%) |
| 1 | 21.4 | 21.4 |
| 2 | 20.0 | 41.4 |
| 3 | 19.0 | 60.4 |
| 4 | 9.4 | 69.8 |
| 5 | 5.9 | 75.7 |
| 6 | 4.6 | 80.3 |
| 7 | 3.5 | 83.8 |
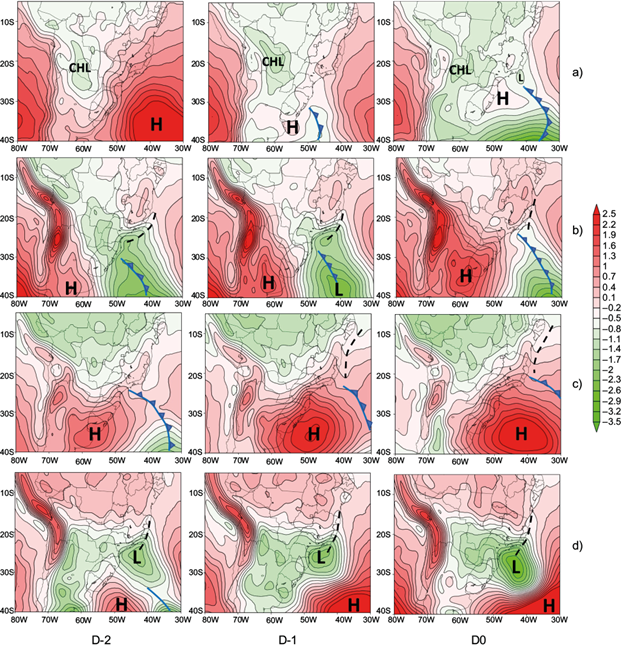
Fig. 8 Principal Pattern Sequences (PPSs) obtained at surface level. a) PPS1, b) PPS2, c) PPS3, d) PPS4. From left to right: D-2, D-1, and D0. CHL= Chaco Low; H=High; L=Low.
PPS1 (Fig. 8a) and PPS2 (Fig. 8b) show a sequence pattern associated with the displacement of a cold front that arrives on the coast of RJ on D0. PPS1 explains 21.4% of the total variance and is associated with a shorter and more oceanic baroclinic system than PPS2. It is noted that the cold front is unable to reach the continent because on D0 the frontal system appears connected with a low-pressure system loca- ted over the Atlantic Ocean, close to the coast of RJ. PPS1 also shows the Chaco Low, located between northern Argentina, central-western Paraguay, and southern Bolivia. This synoptic pattern at the surface is similar to the average of the mean sea level pressure associated with SHRE, obtained through the composite method (Fig. 5a). This result was expected due to the fact that the PPSs that explain the higher percentage of the total variance is related to the most frequent synoptic pattern, which coincides frequently with the average field. The PPS2 sequence pattern (Fig. 8b) explains 20.0% of the total variance and shows on D0 the cold front over RJ with a more intense and wider post-frontal anticyclone compared to PPS1.
PPS3 (19.0%) (Fig. 8c) also shows an intense and wide post-frontal anticyclone with a slow displacement during the analyzed period. On D-2, the frontal system is already over São Paulo state, reaching RJ during D-1. On D-1 and D0, the post-frontal anticyclone is practically stationary over the Atlantic Ocean around 35ºS, 45ºW, and acquiring blocking charac- teristics. With such surface atmospheric circulation pattern, the RJ is affected by persistent southeast winds which favor increased moisture convergence and, consequently, heavy rain intensification in the CRJ.
The patterns PPS2 and PPS3 are similar to those identified by Escobar (2019) related to a synoptic climatology during the Brazilian rainy season. The last sequence pattern (PPS4) (Fig. 8d) explains 9.4% of the total variance and reveals the presence of a low-pressure system located over the Atlantic Ocean to the south of RJ, which remains practically stationary during the analyzed period. This low-pressure system on D-2 is observed connected with a cold front located over the South Atlantic Ocean, close to 40ºS, 35ºW. On D-1 and D0, the cold front moves eastwards quickly whilst the low-pressure system remains practically in the same position, approximately at 25ºS, 45ºW. In general, these cyclones have a weak baroclinic structure whose associated cold fronts affect the coasts of the São Paulo and RJ states. On several occasions, these cyclones are not frontal and show subtropical features (Evans and Braun, 2012; Escobar, 2014; Gozzo et al., 2014; Brasiliense et al., 2018; Silva et al. 2019). In both cases (extratropical or subtropical cyclones), this cyclone contributes to increase moist and warm air convergence towards southeastern Brazil. Moreover, surface southerly and southeasterly winds also favor rainfall intensification over the coastal areas of RJ.
While the low sample size (37 cases) is a statistical limitation, pattern PPS3 related to a blocking configuration, was the synoptic pattern of SHRE that showed the longest duration. The rest of the patterns did not show significant differences associated with the duration of SHRE events.
Similar results were obtained asking how these four primary patterns varied throughout the October April rainy season. There were no significant differences associated with the intraseasonal variability of the four PPS of SHRE.
Despite the small number of cases, pattern PPS2 associated with the incursion of cold fronts, was more common in spring (November) and autumn (March) than in summer. This result is similar to Escobar (2019) of the synoptic climatology during the Brasilian rainy season.
Differences in the accumulated precipitation were evaluated for each of the four patterns associated with SHRE. Despite the few cases of SHRE events, the synoptic composite maps (figures not shown) did not show significant differences between the patterns (PPSs).
Figure 9 shows the synoptic surface charts highly correlated with the four PPSs associated with SHRE. The synoptic surface charts associated with the patterns PPS1 (Fig. 9a) and PPS2 (Fig. 9b) show a cold front over the Atlantic Ocean, favoring mass and moisture convergence towards the continent. The synoptic surface chart related to the pattern PPS3 (Fig. 9c) is associated with a wide high-pressure system located over the Atlantic Ocean and the stationary front close to the coast of RJ state. Such surface atmospheric circulation is similar to a blocking configuration pattern, with southeasterlies over the São Paulo and RJ state’s coast and favoring the intensification of heavy rain in the CRJ. The surface synoptic chart associated with PPS4 (Fig. 9d) shows the presence of the subtropical cyclone “Bapo” located in the Atlantic Ocean, approximately to the southeast of Santa Catarina state. This low-pressure system can persist for several days maintaining the convergence of a warm and moist air mass from the Amazon region to the Southeast region of Brazil and, consequently contributing to the intensification of the rain in the CRJ.
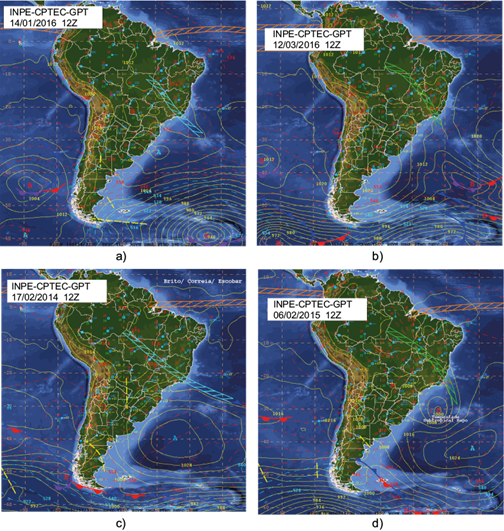
Fig. 9 Surface synoptic charts elaborated by CPTEC/INPE at 1200 UTC associated with SHRE in the CRJ. a) January 14, 2016. b) March 12, 2016. c) February 17, 2014. d) February 6, 2015. Sea level pressure (hPa) in continuous yellow lines and 1000-500 hPa thickness in red dashed lines. Synoptic symbols as in conventional mode.
4. Conclusions
A synoptic climatology of SACZ episodes associated with HRE in the CRJ during the period October-April/2006-2016 was developed in this study to identify the main synoptic characteristics and the modes of variation of the surface atmospheric circulation related to this extreme meteorological situation.
Over the 10 rainy seasons analyzed, 95 SACZ epi- sodes were identified over Brazil, 77 (81%) of which reached the CRJ (SCRJ). Considering the SCRJ episodes with at least one day of HRE in the CRJ (SHRE), 37 cases were identified from the 77 cases of SCRJ. This means that almost half (48%) of the SCRJ events caused HRE in the city.
A total of 43.1% of SHRE reached the heavy rainfall threshold on the first day and in 68.6% of the cases the rain reached this threshold on the first two days. This result indicates that the heavy rainfall in the CRJ caused by SACZ episodes occurs mainly during the beginning of the episode.
December, January, and March were the months with the highest frequency of episodes of SACZ, SCRJ, and SHRE and most of these episodes last between 3 and 6 days.
The mean synoptic pattern associated with SHRE shows the advance of a typical cold front from Argentina that is connected with a mid-tropospheric trough at lower latitudes and both of them contribute to the intensification of moist air mass convergence in the CRJ. Two days before the SHRE (D-2),the Chaco Low is observed over Paraguay and a weak mid-tropospheric trough is located on the lee side of the Andes Cordillera, over northern Argentina.
On D0, the 500 hPa cyclonic disturbance is located over São Paulo state and favors the formation of a wide area of low pressure over the Atlantic Ocean, to the south of RJ. The anomaly fields clearly show the propagation of a typical baroclinic system, with the 500 hPa wave positioned to the west of the surface wave. The negative anomalies at both levels are more intense over the South Atlantic Ocean and significantly decrease their intensities as they extend towards the RJ, including the CRJ.
The atmospheric circulation at 850 hPa shows the typical configuration observed during rainy season in Brazil, with a predominant northerly flow. On D-2, the RJ shows a northerly flow from the Atlantic Ocean through the influence of the SASA, and on following days the flow rotates to the northwest from the Amazon region. Simultaneously, there is a frontal trough associated with the displacement of the cold front identified at the surface.
The 850 hPa anomaly fields show negative anomalies over a wide area in the South Atlantic Ocean with a pronounced anomalous trough that favors the establishment of a continental flow in a northwestern direction over much of the Southeast region of Brazil. This type of anomaly pattern at 850 hPa level induces the intensification of moisture transport from the Amazon region over the CRJ. This behavior is confirmed by the specific humidity anomalies at 850-hPa, where an increase of approximately 2gkg-1 is observed over part of the Southeast region of Brazil during D0. On this day, a “dipole” or seesaw pattern configuration is established, determined by positive anomalies in southeastern Brazil and negative anomalies in the South region of Brazil.
The atmospheric circulation at upper level (200 hPa) shows, between D-1 and D0, the presence of cyclonic anomalies in southern Brazil, Uruguay, and the adjacent Atlantic Ocean and anticyclonic anomalies over part of southeastern Brazil. The cyclonic anomalies are associated with the frontal trough, and the trough of the lower latitudes and the anticyclonic anomalies indicates strong divergence at high levels contributing to the precipitation intensification in the CRJ.
The synoptic classification at the surface associated with SHRE, allowed the identification of four main synoptic patterns that represented approximately 70% of the total variance. Two of the patterns (PPS1 and PPS2) are related to the displacement of a cold front that arrives on the coast of RJ on D0. PPS1 does not directly reach the continent and is associated with a shorter and more oceanic baroclinic system compared to PPS2, and they accounted for 21.4% and 20.0% of the total variance, respectively.
Pattern PPS3 represented 19.0% of the total variance and is associated with an intense post-frontal anticyclone that remains practically stationary over the Atlantic Ocean, acquiring blocking characteristics. The constant flow from the southeast determined by this synoptic pattern favors increased moisture convergence and, consequently, the precipitation intensification in the CRJ. Pattern PPS4 explained 9.4% of the total variance and it is related to the presence of a cyclone over the Atlantic Ocean to the south of RJ, which reveals a weak baroclinic structure. The cold front associated with this cyclone usually affects the coasts of the São Paulo and RJ states. Frequently this type of cyclone is not frontal and has subtropical characteristics, remaining stationary for several days and favouring rainfall intensification in the CRJ.
Finally, note that the results of this study are useful for weather forecasters who work in operational meteorological centers and need to forecast the heavy rainfall that occurs in the CRJ during the the Brazilian rainy season.

