


 nueva página del texto (beta)
 Inglés (pdf)
 Artículo en XML
 Referencias del artículo
 Enviar artículo por email
 Citado por SciELO
  Similares en
SciELO
Similares en
SciELO 
 Permalink
1. Introduction
The study of the large-scale water vapor fluxes in the atmosphere has gained increasing level of inte- rest from scientists of diverse fields in the past three decades. A commonly-known structure by which moisture transport is accomplished at planetary scales is the atmospheric river (AR). The usage of this term has transcended the scientific community into the public lexicon (Ralph et al., 2018), in great part due to associated flooding hazards, as well as drought-relief benefits related to this phenomenon (Ralph et al., 2018, 2019).
ARs are defined as “long, narrow and transient” channels of “strong, horizontal” transport of water vapor, commonly associated a “low-level jet stream ahead of the cold front of an extratropical cyclone” (Zhu and Newell. 1998; Ralph et al., 2004, 2006, 2017; Bao et al., 2006; Stohl et al., 2008; Warner et al., 2012; Cordeira et al., 2013; Sodeman and Stohl, 2013; Dacre et al., 2015). Consistent with this definition, AR transport, also known as integrated vapor transport (IVT) (Ralph et al., 2017) is defined as the vertically-integrated horizontal flux of water vapor, and this transport is expected to be mostly at low levels (see e.g., Ralph et al., 2006, 2017).
Early AR studies depended on satellite-based observations of integrated water vapor (IWV), the vertically-integrated water vapor, using Special Sensor Microwave/Imager (SSM/I) satellite data (e.g., Ralph et al., 2004; Wick et al., 2013), or on reanalyses and model-derived analyses (e.g., Neiman et al., 2008; Lavers et al., 2011; Cordeira et al., 2013). Several studies exist at the present time that are based on analysis of in-situ dropsondes deployed over a region of interest for atmospheric rivers (e.g., Ralph et al., 2004, 2005, 2017). These measurements serve as validations to the estimates of horizontal waterr vapor transport provided by satellite, reanalysis, and model-derived calculations. According to Ralph et al. (2017), the accuracy of the estimate of the amount of water vapor transported by ARs is, however, still questionable.
The current characterization of the behavior of atmospheric rivers near tropical regions remains poorly-understood and has been subject of extensive debate. According to Ralph et al. (2017), IWV measurements identify AR signatures in locations with weak horizontal vapor transport, often in what is defined as the equatorward tail of these elongated corridors. Ralph et al. (2019) establishes a distinction between ARs detected in subtropical latitudes and those detected in mid-latitudes, based on observations on the relative importance of the wind field in producing the ARs. Additionally, upward forcing of water vapor leading to heavy precipitation, is not an intrinsic feature of atmospheric rivers, based on the two-dimensional definition of AR transport. This definition on its own limits the ability to elucidate the impact of tropical dynamics in the physical processes of ARs.
The tropical troposphere is characterized by the ab- sence of baroclinic instability, mainly due to the weak nature of horizontal temperature gradients (Charney, 1963; Sobel and Bretherton, 2000). MQE is a convective feedback mechanism identified by strong anti-correlation between tropospheric column moisture and moist convective instability, which indicates a link between the environmental moisture and the temperature structure. This mechanism was first observed empirically in TCS08 and PREDICT, and has since been documented in numerous observations (e.g., Raymond et al., 2011; Gjorgjievska and Raymond, 2014; Raymond et al., 2014) and cloud-resolving models (e.g., Singh and O’Gorman, 2013; Raymond and Flores, 2016; Raymond and Kilroy, 2019.
IWV and IVT, measurements based on precipitable water have historically been used to characterize atmospheric rivers (e.g., Ralph et al., 2004, 2006, 2011, 2017; Neiman et al., 2008; Dettinger et al., 2011). Recent studies indicate that the rainfall rate is strongly linked with saturation fraction (Bretherton et al., 2004; Raymond et al., 2011; Gjorgjievska and Raymond, 2013; Raymond et al., 2014). Raymond (2000) defines saturation fraction as
where the numerator corresponds to the pressure integral of the water-vapor mixing ratio r, and the denominator corresponds to the pressure integral of water-vapor saturation mixing ratio r*. In simple terms, saturation fraction is the ratio between precipi- table water and saturated precipitable water.
According to Raymond and Sessions (2007) and Raymond and Flores (2016), decreasing instability index corresponds to higher saturation fraction and more precipitation. Instability index is defined as (Raymond et al., 2011).
where s * low is the vertically-averaged water-vapor saturated moist entropy for the low troposphere (1-3 km altitude), and s * mid is the vertically-averaged water-vapor saturated moist entropy for a portion of the mid-troposphere (5-7 km). Saturated moist entropy is a function of pressure and temperature; thus, at a given pressure, it depends solely on the temperature profile. Tropical temperature profiles associated with deep convection frequently exhibit a vertical dipole pattern, with a relative cooling in the lower troposphere and relative warming in the upper troposphere. Near-zero instability index values indicate a sharp temperature anomaly dipole between low and middle levels in the troposphere, whereas high instability index values indicate a temperature anomaly dipole of the opposite sign.
MQE plus the relationship between saturation fraction and precipitation set two thermodynamic constraints that are hypothesized to control the average behavior of convection in the tropical troposphere, discounting the behavior of the boundary layer. The upper bound, or set point, in column moisture as a function of instability index is a key concept behind MQE. Singh and O’Gorman (2013) present a similar argument by identifying a set point of Convective Available Potential Energy (CAPE) as a function of saturation deficit in the near-zero buoyancy limit.
The causality of MQE is associated with vorticity and instability index. Hoskins et al. (1985) show how vertical temperature perturbations are related to the potential vorticity distribution. Raymond (1992) shows that over tropical oceans, where horizontal temperature gradients are generally weak, absolute vorticity, specifically its vertical component, is the part of potential vorticity that matters the most. Raymond et al. (2011) and Gjorgjievska and Raymond (2014) explain that the presence of a mid-level vortex induces a temperature anomaly dipole - with cooling below and warming above - by virtue of the thermal wind balance. As the adjusted thermodynamic environment reduces the instability index, convection responds to this temperature anomaly by modifying the vertical mass flux profile to relatively more bottom-heavy (Raymond and Sessions, 2007; Gjorgjievska and Raymond, 2014; Sessions et al., 2015, 2016, 2019). As a result, low-level convergence is favored, which in turn increases column moisture.
This paper explores how the deformation of a pre-existing mid-level vorticity pattern in the Gulf of Mexico, caused by strong vertical shear, influences the moisture profile in the resulting river-like structure. We use data from CPEX and expand it with NCEP FNL analysis. Section 2 presents data and methods; in section 3, we describe results from CPEX and FNL; in section 4, we discuss these results.
2. Data and Methods
The NASA Convective Processes Experiment (CPEX) was a one-month aircraft field campaign that took place in the North Atlantic - Gulf of Mexico - Caribbean oceanic region during May and June of 2017. The aircraft instruments used were: dropsondes, a downward pointing K-band radar (APR-2), a wind profile lidar (DAWN), and 3 microwave instruments (MTHP, MASC, HAMSR). The data used in this paper were obtained from the 16 research flights that occurred in May and June of 2017.
For our particular research flight, 19 dropsondes were launched from the NASA DC-8 aircraft from an altitude of 12.5 km. This provided vertical profiles of dynamic and thermodynamic variables, such as wind velocity, air and dew point temperature of all vertical levels of the tropical troposphere. For the case study of this paper, we used only dropsonde vertical profiles to develop further analysis.
A three-dimensional variational scheme (3DVar) described in López Carrillo and Raymond (2011) was used as a tool to visualize the dynamic and thermodynamic structure within the bounds of the experimental box, by constructing an interpolated volume grid using only vertical profile data obtained from the dropsondes. For our case study, the experi- ment was designed assuming a stationary system, during the time window from the first to the last dropsonde launch.
The output of the 3DVar analysis in the chosen regular grid includes fields from measured variables, such as pressure, air and dew point temperatures, and wind velocity, as well as derived field calculations, such as moist entropy, saturated moist entropy, vorticity and divergence.
Every research flight required us to understand large-scale conditions for a region of interest over the tropical ocean basins of the field campaign. At the beginning of June 2017, the remnant outflow of tropical system Beatriz had transported overcast cloudiness from the eastern Pacific into the Gulf of Mexico. As a result of this outflow combining with other sources of moisture, a large system centered around (24º N, 93º W) covered a significant portion of the Gulf of Mexico on June 2, 2017, as shown in the satellite image of Figure 1. The mission concerning this case study occurred on this date, and it was the fifth one in the sequence.
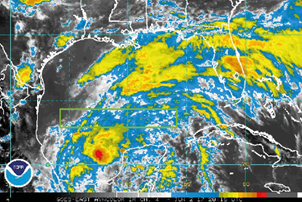
Fig. 1 GOES-13 infrared (IR) satellite image for June 2, 2017, centered on the Gulf of Mexico. The green rectangle represents the domain of the research flight for that day. Credit: Adapted from NOAA/NHC.
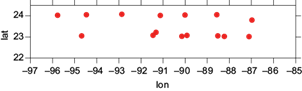
The mission consisted of making two cross-sections of the moisture flowing to the NE over the central Gulf of Mexico, originating from the remnants of eastern Pacific tropical storm Beatriz. The first, westbound cross section went from (23º N, 87º W) to (23º N, 96º W). The second cross section went from (24º N, 96º W) to (24º N, 87º W). A total of 19 sondes were dropped in a box-shaped E-W cross sectional area; due to partial sonde malfunction, more sondes were dropped in the eastern half of the box. Figure 2 shows a total of 15 sondes that were considered useful after quality control, for further gridded analysis. The box we chose for the experiment covers a large longitude range, compared to the range in latitude. Therefore, all the cross-sections plotted after 3DVar analysis are averaged with respect to latitude.
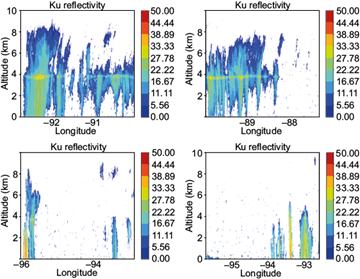
As an ancillary tool to our observations we used data from the Airborne Precipitation Radar (APR-2). APR-2 is a downward pointing K-band radar that operates on dual frequency bands, namely 13.4 GHz (Ku-band) and 35.6 GHz (Ka-band). It was deployed on the NASA DC-8, as part of every mission flight. For our case study, we used APR-2 to classify environmental cloudiness as stratiform or convective, for the duration of the flight. We used Ku-band radar reflectivity data to visualize east-west vertical cross-sections of the disturbance within the experimental box.
Figure 3 shows APR-2 radar-indicated Ku-band reflectivity cross-sections with respect to longitude. Every longitude in the flight path of our domain of interest was crossed at least once. The cross-sections at the top of Figure 3 correspond to regions of predominantly stratiform cloudiness, as indicated by the presence of bright bands at a height of 4 km. These bright bands between 92.5º W and 88.5º W indicate the presence of melting snow, in addition to weak updrafts aloft (Houze, 1997). Conversely, isolated large vertical, towering portions of strong reflectivity (Figure 3, bottom) from the surface to levels of 8 km (left) and 4 km (right) indicate strong updrafts associated with active convection near 96º W and 93º W, respectively.
3. Results
3.1 Along-system and across-system winds
In an effort to better understand the predominant direction of the flow at different vertical levels within the system we studied, it was convenient to rotate the coordinate system of the experimental box counterclockwise by 45 degrees. This technique was useful to define two main coordinate axes for the wind velocities, which were along (northeastward) and across (northwestward) system, separately displayed as the left and right plots of Figure 4, respectively. The system is defined as the extensive region of cloud coverage over the Gulf of Mexico, as indicated by the satellite image of Figure 1.
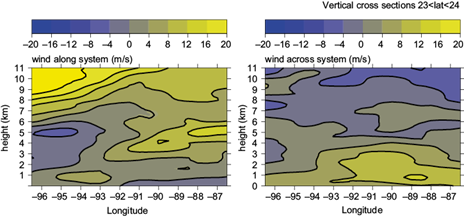
Fig. 4 Northeastward (along system) and northwestward (across system) winds. The system is defined as the extensive region of cloud coverage over the Gulf of Mexico, as indicated by the satellite image of Figure 1.
Figure 4 (left) shows a vertically-sheared structure, most prominently on the western part of the cross section. A northeastward jet tilts upward between altitude. Figure 4 (right) shows a strong northwestward jet at low levels on the east side of the box, leading to apparent low-level convergence around 93º W.
The horizontal structure of the winds at 5-km altitude (Figure 4, left) indicates there is horizontal shear corresponding to cyclonic vorticity, as the direction of the winds shifts from southwestward (west) to northeastward (east). This is consistent with the strong mid-level vorticity shown in Figure 10, peaking roughly at 5-km altitude.
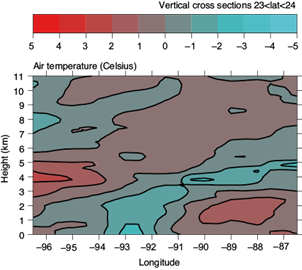
3.2 Air temperature anomalies
Figure 5 shows air temperature anomaly cross-sections for the experimental region. A close look at Figure 5 shows warm anomalies above cold anomalies with eastward tilt, from low levels to mid-levels. This temperature anomaly structure is indicative of a more stable environment. Additionally, Figure 5 shows sharp cold anomalies near the surface within a small sub-region of the experimental box, between 93º W and 91º W. This smaller sub-region of much colder air than that of the surroundings at either direction can be identified as a cold pool.
3.3 Entropy
Figure 6 shows cross-sections for moist entropy and saturated moist entropy, at the left and center plot boxes, respectively. Moist entropy is a variable similar to equivalent potential temperature, which is conserved under phase transitions. Saturated moist entropy is a variable like saturated equivalent potential temperature, and is a function of only pressure and temperature. A constant saturated moist entropy value with respect to height corresponds to moist neutral instability (Raymond, 2013).
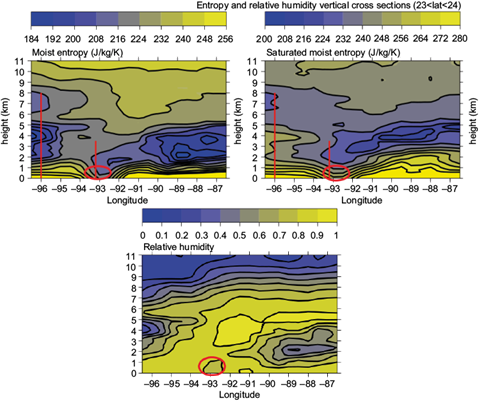
Fig. 6 Moist entropy (left) and saturated moist entropy (center) cross sections. Red ellipses indicate approximate location of cold pool; red vertical lines indicate regions of APR-2 reflectivity-indicated vertical updrafts, and the vertical depth of the updraft. Relative humidity (right) cross sections are shown for comparison.
Boundary-layer values of moist entropy and satu- rated moist entropy are low at a small sub-region, located between 93º W and 91º W longitude (red ellipses in Figure 6). Therefore, both temperature and moisture are lower near surface in this small sub-region, a manifestation of the cold pool discussed in Figure 5. Red vertical lines in Figure 6 point out the locations where convective updrafts were observed in APR-2 radar reflectivity (Figure 3, bottom). The length of these vertical lines represents the approximate vertical extent of the observed updrafts. We note that both updrafts are seen to the west of the observed cold pool. Both moist entropy and saturated moist entropy values are high between the locations of the updrafts. Relative humidity cross-sections are shown for comparison (Figure 6, right). We note that the highest values of relative humidity correspond to the regions of melting snow at the freezing level, consistent with the observed bright bands seen in the APR-2 radar reflectivity cross-sections. Conversely, the cold pool at 93º W is barely a distinctive feature seen in relative humidity cross-sections.
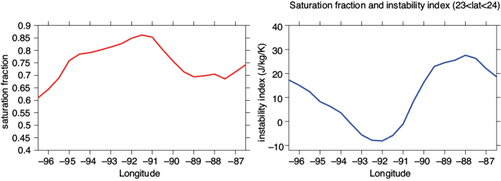
3.4 Saturation fraction and instability index
Figure 7 shows plots of saturation fraction and instability index as a function of longitude, indicating that saturation fraction is anti-correlated to instability index within the region of our study. Close to 92º W, a relative maximum in saturation fraction corresponds to a relative minimum in instability index. We note that this is a fairly extreme case, as the instability index actually becomes negative between 91º W and 93º W, i.e., nearly co-located with the cold pool. However, the maximum value of saturation fraction does not increase indefinitely, even in this extreme case. This result is consistent with the constraint of MQE. i.e., an apparent upper bound in moisture as function of instability.
To test the validity of the results obtained through 3DVar analysis of dropsonde profiles in Figure 7 within the bounds of the experimental domain, we compare with analysis data from the FNL, a spectral analysis system created by NCEP. Figure 8 shows the same plots as Figure 7 but based only on FNL analysis data. Figure 8 shows remarkable agreement with Figure 7, in terms of showing a relative maximum of saturation around 92º W. For instability index, the profiles are similar to an acceptable degree; however, we note that instability index does not become negative in Figure 8, as it does in Figure 7. The negative instability index values are likely an after-effect of the precipitation that occurred close to where the cold pool is detected by 3DVar analysis of the dropsonde profiles. The cold pool and localized regions of precipitation are not detected by the FNL, thus, we attribute the same difference between both figures as a consequence of the differences in resolution between both datasets.
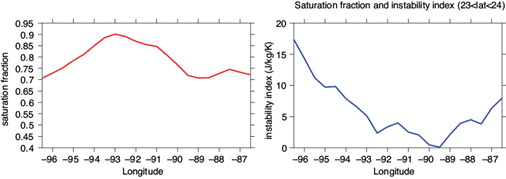
Fig. 8 Saturation fraction (left) and instability index (right) cross sections, based on FNL analysis data.
As we will discuss in the next sub-section, the results in Figure 7 indicate how the temperature and moisture structure are intricately related to the vorticity.
3.5 Vorticity and divergence cross-sections
The vertical component of absolute vorticity ςz is
where x and y are the respective longitude and latitude coordinates modified implicitly to account for a spherical Earth, u and v are the zonal and meridional components of the wind vector, and f is the latitude-varying Coriolis parameter. Our two traver- ses are too close together in latitude, and too dispersed in time to trust the derivatives. Therefore, we present a partial evaluation of vorticity considering only x derivatives, such that
To test the assumption of whether the x derivative represents the vorticity within the bounds of the experimental box, we use analysis data from the FNL.
Figure 9 shows a side-to-side comparison of FNL vorticity profiles, in which the left plot represents the vorticity field calculated with both x and y derivatives, and the right plot represents the vorticity associated only with its x derivative. Both plots show a broad region of enhanced mid-level vorticity with a vertically-sheared structure. Thus, for the purpose of this case study, we can rely on the vorticity field calculation that only considers x derivatives.
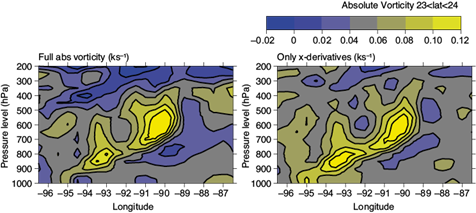
Figure 10 shows estimates of absolute vorticity based on dropsonde data, assuming that the meridional directions can be neglected. The vorticity profile calculated using only x derivatives is noticeably weaker than that shown in Figure 9. This strongly indicates that y derivatives have a significant impact on the calculated value of vorticity using 3DVar analysis in the experimental domain.
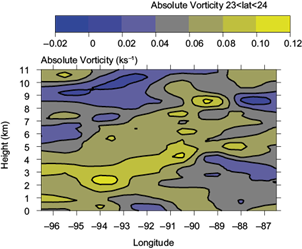
A comparison between the vorticity cross-sections of Figure 9 and the temperature anomalies shown in Figure 5 suggests that these temperature anomalies, observed in the experimental box, are related to the vertically-sheared vorticity structure.
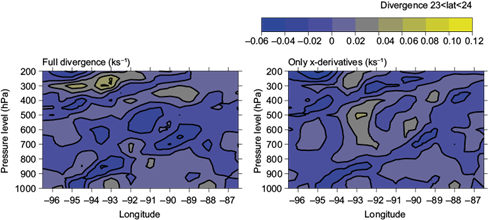
In a similar way to how we estimate the vorticity, we can express divergence in a simplified form as
We see the same issues with the y derivatives, so we present a partial evaluation of divergence considering only x derivatives, such that
We also use analysis data from the FNL to test how representative is the above approximation.
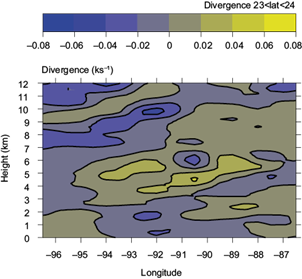
We show a side-to-side comparison of FNL divergence profiles in Figure 11. In contrast to the vorticity profiles, no prominent feature is clear from either plot, except the presence of low-level convergence with a vertically-sheared structure at 95ºW, west of the observed cold pool. We show the partial divergence profile corresponding to dropsonde data (Figure 12), only considering x derivatives, for the sake of consistency, but we admit limited confidence in the validity of these profiles. Figure 12 shows a sheared divergence structure, with some low-level convergence and a significantly sheared mid-level divergence, consistent with the dominant stratiform cloudiness observed during the experiment.
Based on the sheared-structure seen in all plots based on dropsonde data within the experimental box, we explore the large-scale conditions at the Gulf of Mexico and Western Atlantic not just within the temporal bounds of our experiment, but also within a few days of the mission flight.
3.6 Large-scale conditions
To visualize analysis data variables relevant to our case study over the Gulf of Mexico, we relied on the FNL analysis data. We are mainly interested in diagnosing rather than forecasting; thus, we use FNL to show the large-scale conditions within the experimental box and its vicinity.
We investigate the large-scale conditions in two separate steps. First, we illustrate vertical wind profiles, similar to the ones shown in Figure 4, for various latitudes in the Gulf of Mexico and Western Atlantic, to evaluate the overall moisture transport from the tropics into mid-latitudes, occurring around the time of the mission flight. Second, we show large-scale plan views of the tropical ocean over the Gulf of Mexico, the Caribbean, and portions of the Western Atlantic.
Figure 13 shows wind cross-sections with respect to longitude for 4 different latitudes, 3 of which were chosen to illustrate the wind field at different levels in regions of the Gulf of Mexico, which is under the influence of the large cloud system, defined in Figures 1 and 4. The fourth cross-section shown in Figure 13, corresponding to latitude 29º N, visualizes the large-scale conditions near the southwest portion of the Western Atlantic, also under the influence of the same cloud system. The first three cross-sections indicate that there is strong low-level cross-flow into the jet, as the predominant direction of low-level winds is across the defined system. The fourth cross section, at 29º N, indicates weak cross-flow into the jet, and a predominance of along-system winds at all vertical levels, consistent with the definition of AR transport mentioned in the introduction. Based on Figure 13, the geographical extent of the AR does not include the Gulf of Mexico. In the next two figures, we explain why this is not the case.
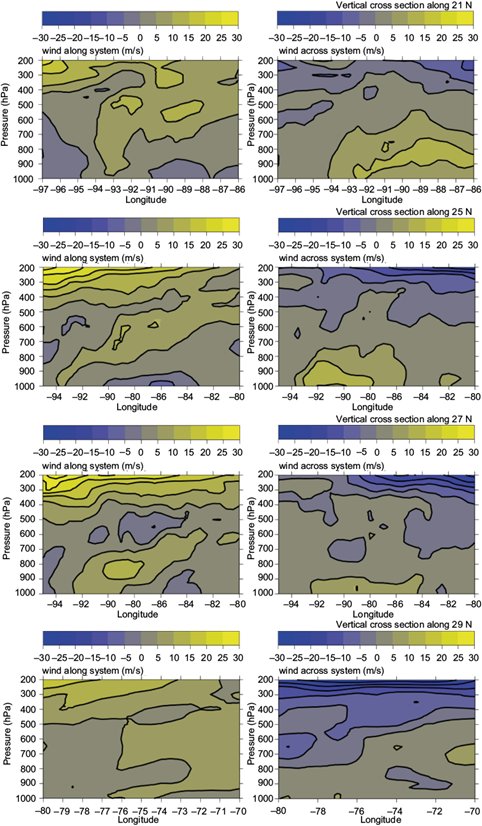
Fig. 13 Northeastward (along system) and northwestward (across system) winds with respect to longitude, based on FNL analysis output for June 2, 2017 (18:00 Z) at 4 different latitudes. The system is defined in the same way as in Figure 4.
Figures 14 and 15 show large-scale plan views for the Gulf of Mexico, Western Atlantic and Caribbean, at mid-levels and low-levels, respectively. Filled contours in Figure 14 indicate absolute vorticity distributions during the mission flight, averaged over the 500-700 mb pressure interval. Figure 15 shows the same information as Figure 14, but with vorticity averaged over the 700-900 mb pressure intervals. As an auxiliary analysis tool, contour plots of high saturation fraction (greater than 0.7) and low instability index (between -5 and 5 (J/Kg/K)), solid blue and green dashes, are respectively included.
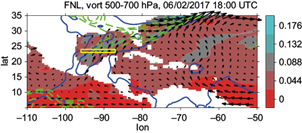
Fig. 14 Mid-level (700-500 mb) winds and vorticity (ks -1 ) FNL analysis output for June 2, 2017 (18:00 Z) at the Gulf of Mexico. Solid-blue contours correspond to high saturation fraction (≥ 0.7). Green-dashed contours correspond to low instability index -5< ii < 5 (J/Kg/K).
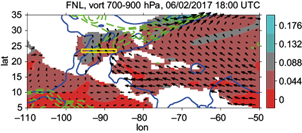
Fig. 15 Low-level (900-700 mb) winds and vorticity (ks -1 ) FNL analysis output for June 2, 2017 (18:00Z) at the Gulf of Mexico. Solid-blue contours correspond to high saturation fraction (≥ 0.7). Green-dashed contours correspond to low instability index -5< ii < 5 (J/Kg/K).
Strong mid-level winds, shown in Figure 14 are associated with a weak high pressure ridge over the Western Atlantic and a low pressure trough over the continental United States. Conversely, strong low- level northwestward winds over the Gulf of Mexico shown in Figure 15 are driven by strong surface easterlies in the central Caribbean, which brought slightly drier air into the region of interest. The contrast in wind direction between low-levels and mid-levels over the Gulf of Mexico suggests that the AR transport over the Gulf of Mexico is very weak.
Blue dashed contours in Figures 14 and 15 corres- ponding to high saturation fraction, show a river-like structure in the Western Atlantic that becomes more narrow with increasing latitude, and widens in the tropics. In addition, the strength of the winds increases with latitude within this poleward channel. Figure 14 indicates that the mid-level vorticity structure in the Gulf of Mexico is being deformed due to the influence of strong vertical shear. Low instability index values, extending from mid-latitudes into the Gulf of Mexico, precisely where the mid-level vorticity is positive, suggests that the mid-level vorticity is being advected into mid-latitudes. Thus, by virtue of MQE and how the vorticity governs the instability index, the atmospheric river can extend from the tropics into mid-latitudes, both by vorticity-induced moisture convergence in the tropics, and the combined effect of moisture transport and moisture convergence in mid-latitudes. We present our conclusions in section 4.
4. Conclusions
We observed a situation in which vorticity in the Gulf of Mexico was being advected to the northeast into the Western Atlantic and also being sheared. This sheared vorticity structure is most noticeable at mid-levels. The temperature perturbations associa- ted with this vorticity structure are consistent with a balanced thermal response to it. This is evidenced particularly in the observed regions of reduced convective instability, as measured by the instability index. Moreover, the observed saturation fraction varies inversely with this instability, in agreement with the previously discussed MQE principle.
We did not observe any ongoing strong convection in the traverse; however, we saw the remnants of previous convection, in the form of extensive stratiform regions with leftover precipitation, and a strong cold pool which occurred precisely where the instability index is minimum and the saturation fraction is maximum.
We obtained a broader perspective with the FNL analysis, from which it appears that this region is under the influence of what is conventionally called an atmospheric river. However, the flow structure near the tropics is in disagreement with some of the requirements of what an atmospheric river looks like, particularly due to the absence of a low-level moisture flow along the system in this region. We present an alternative mechanism to characterize the atmospheric river, which is not constrained on the preconceived notion of horizontal moisture flux, and which relates the well-known mid-latitude river structure to the low-level cross-flow in the tropics. This picture is consistent with the notion that this is a different type of moisture (atmospheric) river, perhaps a vorticity river. By the processes we have outlined, this vorticity is ultimately responsible for the convection, which is associated with the observed moisture convergence. Finally, the alternative mecha- nism we have presented is meant to include the upward forcing of moisture leading to precipitation as part of the AR system.

