


 nueva página del texto (beta)
 Inglés (pdf)
 Artículo en XML
 Referencias del artículo
 Enviar artículo por email
 Citado por SciELO
  Similares en
SciELO
Similares en
SciELO 
 Permalink
1. Introduction
The impacts caused by atmospheric aerosols on climate change have received special attention during the last decades (IPCC, 2013). Aerosols affect the radiation budget, altering Earth’s climate by absorbing and scattering radiation (direct radiative effect), acting as clouds condensation nuclei, and modifying their physical properties (indirect radiative effect) (Ramanathan et al., 2001; Kaufman et al., 2005; Scott et al., 2018a). The aerosol effects (direct and indirect) have large regional variations, mainly due to short lifetime, complex chemical composition, and interaction in the atmosphere, resulting in high space-temporal heterogeneities (Rajeev and Ramanathan, 2001). Different regions, characterized by different aerosol sources as well as different meteorological conditions can provide important information on the radiative effects of aerosols at a regional and global scale (Artaxo et al., 2013; Hooda et al., 2016; Martin et al., 2016; Bibi et al., 2017).
The terrestrial biosphere is an important source of natural aerosols (Hallquist et al., 2009; Carslaw et al., 2010; Scott et al., 2018a, b). These natural sources (biogenic volatile organic compounds) can dominate ambient aerosol in the tropics (Pöschl et al., 2010; Martin et al., 2010, 2016). Because natural aerosol constitutes a large fraction of ambient aerosol, it can have important radiative effects (Rap et al., 2013; Rizzo et al., 2013; Scott et al., 2014). The Amazon basin is a great “laboratory” for studying atmospheric processes characteristic of natural conditions, as they existed before the impact of industrialization in the regional and global atmosphere (Andreae, 2007; Artaxo et al., 2013; Martin et al., 2016; Rizzo et al., 2018). It is a key ecosystem to understand the climate system, but its forest area has been decreasing due to deforestation, which began to reach substantial levels in the mid-1970s and continues incessantly until the present day (Andreae et al., 2002; Schafer et al., 2008; Scott et al., 2018b).
The concentration of aerosol in the Amazon is about 300-500 particles per cm3 (Martin et al., 2010), which represents an upper limit to the natural atmospheric particle loading before anthropogenic influence (Andreae, 2007; Artaxo et al., 2013; Rizzo et al., 2018). However, the most preserved forest in the region is seasonally influenced by anthropogenic emissions of the biomass burning due to expansion of agriculture, logging, urbanization (Davidson et al., 2012); also, by long-range transport, which contributes with particles from outside the basin (Andreae et al., 2015). Thus, the characterization of the optical and radiative aerosol properties of the Amazon in clean and polluted conditions is crucial to our understanding of the dynamic biosphere-atmosphere processes and the resilience of the ecosystem to changes (Artaxo et al., 2013).
Aerosol radiative forcing (ARF) is the net change in the energy balance of the Earth’s system due to some forced disturbance in any atmosphere layer (Ramanathan et al., 2001; Singh et al., 2016). Impacts on the radiation balance vary according to the region, hence a comprehensive examination of the optical and radiative properties of aerosols at a local and regional level is necessary (Rajeev and Ramanathan, 2001; Kaufman et al., 2002; Prasad et al., 2007; Bibi et al., 2017). ARF is influenced by the aerosol optical depth (AOD), single scattering albedo (SSA), and the asymmetry parameter (AP) (Sena et al., 2013). The SSA is the most important parameter that affects ARF and is extremely sensitive to the processes of absorption and scattering of the aerosols in the atmosphere (Bibi et al., 2017). Small errors in the estimation of SSA can affect ARF signal (Takemura et al., 2002). The intensity and sign of ARF are also calculated through different types of aerosols, chemical uniqueness, and size distribution. Therefore, an accurate assessment of ARF is a difficult task and remains more uncertain for the climate system (IPCC, 2013; Bibi et al., 2017).
Several studies in the Amazon basin have already addressed the evaluation of the optical and radiative properties of aerosols (Procopio et al., 2003, 2004; Patadia et al., 2008; Rizzo et al., 2011, 2013; Artaxo et al., 2013; Sena et al., 2013; Sena and Artaxo., 2015). These studies were carried out for different periods and used different methodologies to quantify and characterize the disturbances caused by aerosols (Procopio et al., 2004; Patadia et al., 2008; Sena et al., 2013). However, local studies on ARF time series attempt to minimize the uncertainties associated with their estimation. In this study, the aerosol optical and radiative characteristics over the Amazon rainforest were investigated for a seven-year period (2011-2017). The spectral variation of the AOD, SSA, and AP variables measured using AErosol ROboticNETwork (AERONET) data was analyzed. Thereafter, the difference between SSA data retrieved from AERONET and SSA calculated using measurements on the ground surface was shown. AERONET radiative forcing products were also used. Monthly, seasonal, and annual variations of the shortwave aerosol radiative forcing (SWARF) on top of atmosphere (TOA), surface (SUR), and within the atmosphere (ATM), along with atmospheric heating rate (HR) were calculated using the Santa Barbara DISORT Atmospheric Radiative Transfer (SBDART) model. A regression analysis of the AERONET-SBDART forcing was also performed to validate the measurements simulated by the SBDART.
2. Site description, measurement, and methods
2.1 Site, instrumentation, and data
This study was carried out with measurements at two sites of the GoAmazon 2014/5 experiment (Martin et al., 2016). The characterization of the optical properties of the aerosols used as input to the radiative transfer code was carried out based on AERONET measurements at site T0e or EMBRAPA (Empresa Brasileira de Pesquisas Agropecuárias; 2.8942º S, 59.9718º W) (Barbosa et al., 2014) located 25 km NNW of Manaus (Fig. 1a), a developing city with a population of 1.8 million people (IBGE, 2015). There is little biomass burning activity in the region, but the site is affected by the regional transport of pollutants from biomass burning, especially in the dry season (Rizzo et al., 2013). The values obtained for the SSA of the atmospheric column at T0e were related to in situ measurements at site T0a (Amazonian Tall Tower Observatory [ATTO]; 2.1466 ºS, 59.0050 ºW) (Andreae et al., 2015), located 150 km to the northeast of Manaus (Fig. 1a).
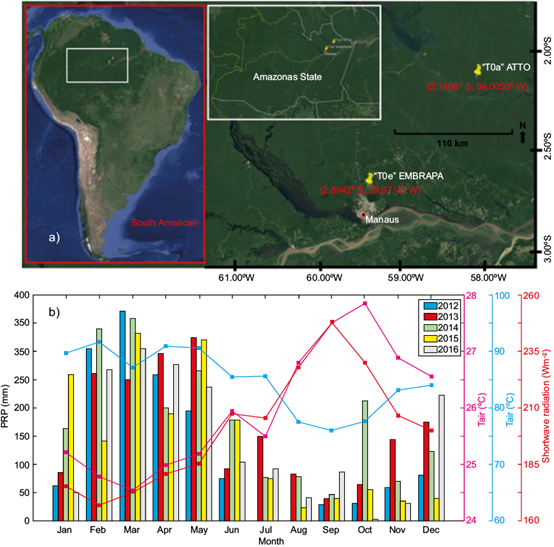
Fig. 1 (a) Location of the study area. The yellow marks are the T0a and T0e sites. The red mark is Manaus in the State of Amazonas, Central Amazon, Brazil. (b) Micrometeorological characterization of T0a, showing the monthly averages of precipitation (PRP), air temperature (Tair), relative humidity (RU), and shortwave radiation.
In this study, the dry and wet seasons were defined through the time series of AERONET data AOD and through aerosol scattering and absorption coefficients at different wavelengths, according to Rizzo et al. (2013). The dry season was defined from September to December, while the wet season from March to June. This definition may not be strictly correct from a climatological point of view, since the beginning of each season changes from year to year depending on precipitation patterns; however, considering the purposes of the interpretation of the aerosol dataset, this is a reasonable choice (Rizzo et al., 2013, 2018). In this way, it is possible to evaluate more clearly the impacts caused by aerosols from biomass burning (dry season), as well as the effect of natural biogenic aerosols (wet season). Figure 1b shows the micrometeorological characterization of the site T0a, showing the monthly values for precipitation (PRP), air temperature (Tair), relative humidity (RU), and shortwave radiation.
In this paper, the data used were retrieved by CIMEL sun/sky radiometers, which are part of the AERONET global network. Measurements of direct sun radiation were performed in eight (340-1640 nm) spectral channels with an uncertainty of ≈ 0.01-0.02 for AOD recoveries (Eck et al., 1999), and the amount of water vapor column was measured at 940 nm (Holben et al., 2001). In addition, inversion products were recovered in four spectral channels (440, 670, 870, and 1020 nm) (Dubovik et al., 2002). Data were available in three levels of quality: level 1.0 contained unpatched data, level 1.5 contained data that tested in the cloud, and level 2.0 data were tracked in the cloud with guaranteed quality (available from the AERONET website at http://aeronet.gsfc.nasa.gov/). Level 2.0 data underwent a final calibration process with information specific to each site, which is detailed by Dubovik et al. (2002). In this study, 2.0 level data of AOD, SSA, and AP were inversion products retrieved from a selected sunphotometer over T0e (2011-2017). Besides being used for spectral analysis, these data were also used as an input to the SBDART radiative transfer code. Before performing the analysis, AOD values between T0a and T0e (from 2016 to 2017) were compared, assuming that aerosol concentrations were similar for the two sites. Thus, a long time series (T0e) was considered. Direct products were also used, such as AOD 500 nm total, coarse and fine fractions, precipitable water, and angstrom exponent 440-870 nm.
Surface measurements were performed at site T0a from 2014 to 2017 with a 5-min temporal resolution as well as daily and 15-day averages for the analysis of the time series. All measurements were done under dry conditions (RH 30-40 %), assured by an automatic diffusion dryer (Tuch et al., 2009). Inlet lines ran from the measurement level (80 magl, about 51 m above the canopy height) to an air-conditioned container at ground level. The inlet particle size cutoff was PM 2.5. The aerosol particle scattering coefficients were measured using a three-wavelength integrating nephelometer (Aurora Ecotech 3000) operating at 450, 525, and 635 nm. Every six months the instrument was calibrated using filtered air and CO2. Sampling time varied between 1 and 5 min. Data were corrected for truncation errors according to Anderson and Ogren (1998) using the tabulated factors for total scatter as a linear function of Angstrom exponent with no cutoff at the inlet (Rizzo et al., 2011, 2013). Aerosol particle absorption was measured using a MAAP photometer (MultiAngle Absorption Photometer, model 5012, Thermo) (Petzold et al., 2005). MAAP reported black carbon (BC) concentrations at 637 nm, which were converted to absorption coefficients assuming a mass absorption coefficient of 6.6 m2 g−1 used in the firmware of the instrument. Particle absorption coefficients were measured every minute, and a 5% correction was applied to the data to account for wavelength adjustment (Müller et al., 2011).
2.2 Data analysis
The nephelometer scattering measurements (in situ) were interpolated with the wavelength common to MAAP at 637 nm. With the paired measurements of scattering coefficients and absorption coefficients, SSA was calculated at 637 nm using the following equation.
SSA values as well as the absorption and scattering coefficients were calculated monthly. In addition, SSA data calculated using Eq. 1 were compared with SSA obtained at 675 nm from the AERONET station.
The AERONET optical parameters (AOD, SSA, and AP) were analyzed for seasonal variations. These optical parameters fed the SBDART radiative transfer code. Simulations with the SBDART returned the radiative fluxes to the SUR and TOA. SBDART outflows (TOA and SUR) were compared to fluxes estimated by the AERONET algorithm. Furthermore, SWARF (TOA and SUR) instantaneous values were validated according to AERONET estimates using the statistical parameters: coefficient of determination (R2, Eq. 2), mean absolute error (Eq. 3), root mean square error (Eq. 4) and Willmott’s coefficient (Eq. 5):
In this study, SWARF was defined as the difference between calculated net fluxes with and without an aerosol load in the atmosphere. The average daily SWARF calculations in TOA and SUR were performed using the SBDART model for the study period. Radiation fluxes were used to obtain SWARFTOA and SWARFSUR for up and down at one-hour intervals for a period of 24h with and without aerosol conditions separately. The radiative forcing in the TOA and the surface were obtained as the difference between the downstream and upstream fluxes, with and without aerosols. The averaged SWARF is often expressed as Eq. (6). The fluxes were calculated for the solar spectrum (0.20-4.00 µm) on a vegetated surface. The solar spectrum was chosen because of later comparisons with the AERONET fluxes that are estimated by the Global Atmospheric Model (GAME) code (Dubuisson et al., 1996; Roger et al., 2006).
The SWARFATM values were estimated as the difference between the radiative forcing at TOA (SWARFTOA) and SUR (SWARFSUR) using the following equation:
SWARFATM (in W m-2) represents the amount of solar radiation trapped in the atmosphere by aerosols. The higher the amount of ∆SWARFATM, the higher the amount of energy retained. In this way, the HR due to the absorption of aerosols is calculated from the first law of thermodynamics and hydrostatic equilibrium suggested by Liou (2002):
where ∂T/∂t is the HR in K day-1, g is the gravity acceleration (9.8 m s-2), Cp is the specific heat capacity of air at constant pressure (i.e., 1006 J kg-1 K-1) and P is the atmospheric pressure difference between the surface and 3 km, where most of the aerosols are found. Therefore, P was taken as 300 hPa (Kaskaoutis et al., 2013; Singh et al., 2016; Bibi et al., 2017).
3. Results and discussion
3.1 Variability of aerosol optical properties
The complete time series of AOD 500 nm is shown in Figure 2a, b, for sites T0a (2016-2017) and T0e (2011-2017). Due to the agreement between AOD measurements at both sites, measurements at T0e were adopted as representatives of a pristine forest region and were used in the radiative transfer code (SBDART) for simulations of radiative fluxes. Figure 2b shows the seasonality of the optical properties of aerosols in the study area. The rise of aerosol loads during the dry increases AOD values, since fires cause changes in the optical properties and concentrations of aerosols in the Amazon basin (Sena et al., 2013; Artaxo et al., 2013; Rizzo et al., 2013).
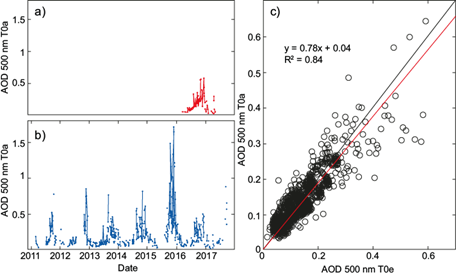
Fig. 2 (a) Time series of aerosol optical depth (AOD, 500 nm) retrieved by AERONET sun-photometer in Central Amazonia for T0a (ATTO) and (b) T0e (EMBRAPA); (c) linear regression for AOD (500 nm) at T0e and AOD (500 nm) instantaneous measurements at T0a.
Figure 2b also shows year-to-year variations in the optical properties of aerosol particles occurring mainly due to variations in the amount of precipitation and biomass burning sources (Rizzo et al., 2013). The maximum AOD (1.8) was observed in 2015. However, no maximum AOD reached values higher than 1.0 for other years. This trend was due to an increase in the number of fires during the same period, which was approximately 26% (from 84 to 115 fires) in the period 2014-2015.
Aerosol parameters obtained from the AERONET station depend on the number of fires in the Amazon forest, which release large amounts of particles and gases into the atmosphere influencing the chemical composition and optical properties of aerosols, which directly affect the forcing of radiative fluxes. To complement the analysis of variations in the optical properties of aerosols, Figure 3 shows the average 15 days of AERONET parameters and in situ measurements, as well as the monthly distribution of fires over the Legal Amazon (which is the territorial extension covering the Brazilian states that contain the Amazon biome) and the states of Amazonas and Pará.
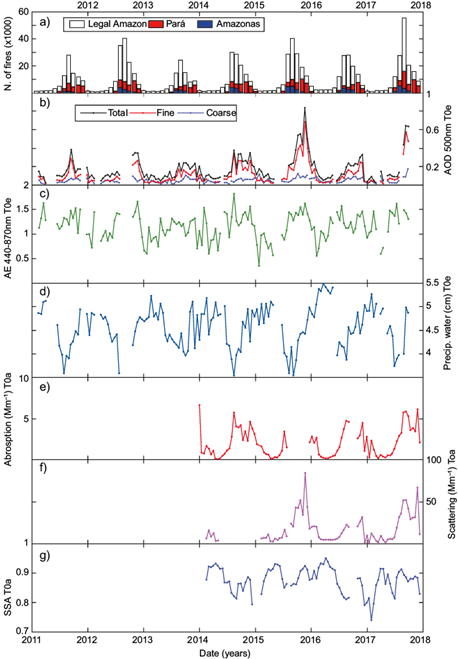
Fig. 3 (a) Monthly distribution of fires over the legal Amazon and the states of Amazonas and Pará; reference satellite: Aqua MODIS afternoon (Instituto Nacional de Pesquisas Espaciais). (b) Total AOD (500 nm) and coarse and fine fractions at T0e. (c) Angstrom exponent (440-870 nm) at T0e. (d) Precipitable water at T0e. (e) Absorption coefficient (637 nm) at T0a. (f) Scattering coefficient (637 nm) at T0a. (g) SSA (637 nm) at T0a.
Additionally, the seasonal variation observed for the optical properties of aerosols in the atmospheric column can also be seen on the surface. Figure 3 shows that the particle scattering coefficients increased substantially under the influence of biomass burning particles. This is a consequence of the increased fine-particle concentration in the dry season, which is more efficient at scattering light compared to the coarse mode dominated biogenic particles in the wet season (Fig. 3b). There is an observed difference between the scattering coefficient values for the years 2014 and 2015 in Figure 3. The scattering coefficients reached maximum values between 160 and 180 Mm-1 in 2014, while the maximum value in 2015 was 600 Mm-1. The increase in scattering coefficient values from 2014 to 2015 was already expected due to the substantial increase in the records of biomass burning occurred in the Amazon basin during the same period. Although there were no fire outbreaks at the forest site, it was influenced by regional emissions of biomass burning carried by air masses (Rizzo et al., 2011, 2013).
Deforestation fires can smolder for days, producing particles at high emission factor rates with small black carbon content, thereby decreasing the aerosol absorption and increasing the aerosol scattering of the original plume (Reid et al., 2005). Evidence shows an increased tendency in the scattering of light by aged particles due to physical and chemical atmospheric processes which act in the increase of particle sizes (Brito et al., 2014). Conversely, in situ observations of biomass burning indicate that concentrations of carbonaceous aerosols normally decrease by 10 to 50% local (fresh) emissions compared to regional emissions. (Capes et al., 2008), through dilution with cleaner background air. In this way, it is reasonable that the dispersion of particles and absorption coefficients vary by different factors, depending on the plume characteristics and atmospheric conditions (Rizzo et al., 2013).
The barplots for scattering coefficients , absorption coefficients, and SSA with the wavelength of 637 nm for the years 2014 and 2017 are presented in Figure 4. We observed a 10-fold increase in from May to October (from 4 to 40 Mm-1). The variation in the absorption by aerosols was 1 to 3 Mm-1 for May and August, respectively. These results are in accordance with those of Artaxo et al. (2013) for a nearby area, which is also a pristine forest (TT34; Artaxo et al., 2013). There is little burning activity during the wet season, and the absorption coefficients observed at the time are attributed to biogenic particles (Pöschl et al., 2010; Rizzo et al., 2013). In the wet season SSA reached maximum average values of 0.88, while average values in the dry season were 0.86. Although the magnitudes of dry and wet seasons averages are close, it is possible to observe that the month-to-month variation is much more evident, ranging from 0.92 in May to 0.83 in August.
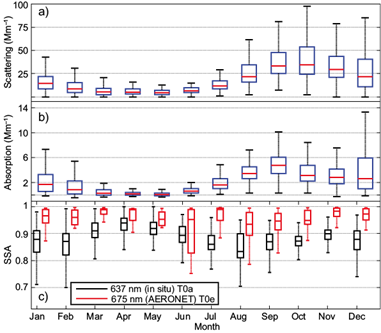
Fig. 4 (a) Boxplot for light scattering coeffcient at 637 nm in T0a from 2014 to 2017, (b) light absorption coeffcient at 637 nm in T0a from 2014 to 2017, and (c) single scattering albedo (SSA) at 637 nm in T0a (black) and T0e (red) from 2014 to 2017.
Rizzo et al. (2013) also analyzed the seasonal pattern of SSA in a forest located in the central region of the Amazon, finding no difference between medians in the dry and wet seasons. Furthermore, Rizzo et al. (2013) results (SSA = 0.88 for both seasons) resemble the results obtained in this study (SSA = 0.88 in the wet season and SSA = 0.86 in the dry season). The low SSA values (SSA = 0.83) found in the wet season are due to low scattering values (driven by low aerosol loads) combined with the absorption coefficients driven by the presence of light-absorbing biogenic aerosols (Artaxo et al., 2013).
The monthly variation of SSA values (Fig. 4) was due to microclimatic conditions (Fig. 1b), transport, and local contributions of biomass burning. Moreover, the high SSA variability found in February may be associated with the influence of mineral dust and aged particles from biomass burning from the advection of aerosols from Africa. This contribution affects the absorption coefficients, while the scattering coefficients are not significantly affected (Rizzo et al., 2013). In addition, the highest SSA medians were found in April and May due to the organic fraction, which can spread the radiation efficiently. Besides, the high atmospheric moisture content causes an increase in the submicron particles diameters, which consequently cause an increase in the scattering and then in the values of SSA (Fig. 3d). The SSA decreased approximately 10% from May to August, which is due to biomass burning in the neighboring regions and the high absorption power of black carbon. There was a slight increase in SSA from August to December due to blending processes between the burning plumes that reached the study area and local particles. This causes an increase in the scattering of light caused by organic aerosols from biomass burning.
The seasonal pattern of SSA calculated in situ was consistent with AERONET measurements in the atmospheric column (Fig. 4c). According to Anderson et al. (1999), the values of SSA in natural conditions of high humidity for the atmospheric column should be higher than the dry measurements taken on surface. In this study, an average difference of 8.4 ± 2.9% was obtained between SSA calculated in situ and AERONET measurements in the atmospheric column. There was no significant difference between in situ and the atmospheric column, however, there is an observed strong month-to-month difference.
Besides, the lowest difference obtained between SSA calculated in situ and AERONET measurements was found in May (3.0%). The maximum difference was 11.8% in August and September. Although the monthly pattern for both measurements was similar, the atmospheric water content increased considerably the SSA. Likewise, SSA medians in the wet season were observed as high as 0.99 in the atmospheric column, which highlights the dominant effect of scattering on the radiation extinction.
3.2 Influence of fire activities
For illustration purposes, Figure 5 shows the 24-h compilation of fire outbreaks (INPE, 2018) with the HYSPLIT trajectory model for October 4, 2015. This illustration supports the hypothesis that the major contribution of biomass burning emissions comes from neighboring regions. The outbreaks of fires in the state of Pará (Fig. 3a) directly influence the study area. The work of Palácios et al. (2020) about the study area points out that during the change from wet to dry season, the fraction of biogenic aerosols practically does not change, however the mixtures OC-EC, characteristics of biomass burning, go from 16% to 28% from wet to dry season.
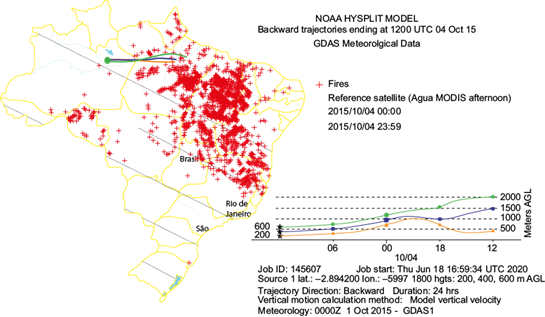
Fig. 5 24-h compilation of fire spots. Aqua MODIS afternoon (INPE) reference satellite with the HYSPLIT trajectory model (backward trajectories) for October 4, 2015.
In general, the results presented in Figures 3 and 4 reflect the complex mixture of aerosol during the period of biomass burning in the region, between August and October. During this period, local and regional influences produce fresh (less-oxidized) organic aerosols from biomass burning (BBOA) which mix with quite-aged (more-oxidized) aerosols from Africa. This complex mixture strongly modulates optical properties in the Amazon throughout the year (Saturno et al., 2018; de Sá et al., 2019). External factors, such as El Niño 2015, and the increase in the number of regional fires, also contributed strongly to the significant increase in the scattering coefficient (4-40 Mm-1), absorption values (1-3 Mm-1), and the lowest SSA values (0.92-0.83) observed that year. These results are, respectively, in ascending order, from 24 ± 18 to 48 ± 33 Mm-1 and from 3.8 ± 2.8 to 5.3 ± 2.5 Mm-1, and in the descending order of 0.96-0.86 presented by Saturno et al. (2018) using data from ATTO and ZF2 (Manaus-AM). During most part of the period September-October these variations are intrinsically linked to the 27-47% increase in BrC concentration due to regional fires in South America, although Africa’s BBOA is the main source of pollution at ATTO during August (Saturno et al., 2018).
Several other mechanisms have also been suggested to explain the changes observed in optical properties, many of them as a function of the chemical composition of aerosol (not evaluated in this study). For example, the dominant presence of primary organic aerosol (POA) and long-range transport (LRT) of dust from North Africa (Saleh et al., 2103; Pokhrel et al., 2016) may explain the low absorption values observed during the wet season (Figs. 3-4). The presence of POA seems to be more associated with high BC-to- organic aerosol (OA) values which are more efficient absorbers of solar radiation in relation to secondary organic aerosol (SOA) (Saleh et al., 2014; de Sá et al., 2019).
A statistically significant relationship between absorption coefficients, BrC, and particulate matter (PM), along with the organic PM chemical composition was also found in the Amazon (Brito et al., 2014). Recent studies have shown that light absorption by BrC decreases not only with LRT (Lin et al., 2016) but also due to rises in the O:C ratio (de Sá et al., 2019). In addition, decreases in the concentration of chemical species associated with nitrogen are more strongly linked to the increase in light absorption. For instance, the percentage contributed by the CxHyOzNC family seems to be higher if compared to the HOA and LO-BBOA, which are generally associated to important sources of BrC coming from fresh plumes of urban and BB aerosols (Laskin et al., 2015; de Sá et al., 2019). Compounds containing nitrogen and organic molecules, humic-like substances, nitro-aromatic catechols, and aromatic carboxylic acids are among the main solar radiation absorbing constituents during the biomass burning season in the Amazon (Claeys et al., 2012; Lin et al., 2016; de Sá et al., 2019). This evidence corroborates the highest absorption values observed in Figs. 3-4, whereas changes in the spreading coefficient are strongly correlated to the oxidation of OA loads during regional transport, and of LRT events from Southern Africa (Brito et al., 2014; Saturno et al., 2018). These patterns are inextricably linked to complex atmospheric processing, photolysis by solar radiation, gas-particle reactions, and reactions at the aerosol-cloud interface in the aqueous phase (Saleh et al., 2014; Laskin et al., 2015; de Sá et al., 2019). New studies, however, are still needed to understand the concomitant changes in optical and chemical properties as a function of different types of biomass burning in the Amazon.
3.3 Spectral variation of AOD, SSA, and AP in the atmospheric column
The SWARF estimates require information on the optical properties of aerosols, AOD, SSA, and AP, as well as the variability of their properties along with the spectral range. Particularly, AOD represents the total extinction of radiation integrated into the atmospheric column, while SSA is the ratio between scattered and absorbed radiation fractions and AP provides information on scattered radiation. These properties are important for the estimation of the radiative forcing of aerosols and different spectral variations revealing the size of the particles.
The AOD median values, SSA and AP obtained in 440, 675, 870, and 1020 nm were plotted for the dry and wet season from 2011 to 2017 (Fig. 6). Additionally, the spectral variation of AOD is adequate to provide details on particle size distribution, which was also verified using the Angstrom exponent (AE) shown in Figure 2 (Eck et al., 2010). AOD was strongly dependent on the wavelength during the dry season, decreasing with the wavelength due to the presence of fine particles, whose result was already expected as a consequence of emissions by biomass burning (Sena et al., 2013; Artaxo et al., 2013). However, the spectral pattern of AOD was not significant in the wet season, presenting a change in aerosol size distribution towards the larger size range, such as coarse particles (Rizzo et al., 2013; Artaxo et al., 2013).
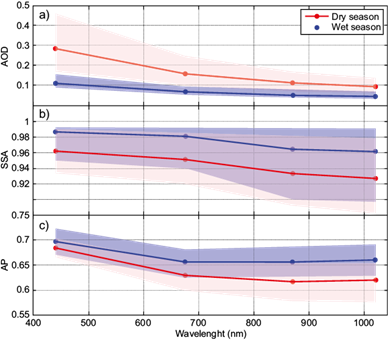
Fig. 6 Spectral variation of (a) aerosol optical depth (AOD), (b) single scattering albedo (SSA), and (c) asymmetry parameter (AP) in the dry (red) and wet (blue) seasons in Central Amazonia (T0e) from 2011 to 2017. The lines represent the medians and intervals are the 25 and 75 percentiles.
In addition, AOD, SSA, and AP had a smaller spectral dependency in the wet season compared to the dry season (Fig. 6). Low AOD means a low concentration of particles in the atmosphere (Artaxo et al., 2013). There was a small difference in SSA values between dry and wet seasons. Although this difference was not significant, the decrease of SSA in the dry season occurred due to the presence of absorber aerosols emitted by biomass burning in this period (Rizzo et al., 2011, 2013; Sena et al., 2013).
The decrease of AOD and SSA with the wavelength in the dry season occurred in different ways. AOD depends directly on the concentration of optically active particles in the atmospheric column (extensive property) while SSA does not depend on the concentration (intensive), but on the absorption and scattering properties of aerosol. The higher AOD in low wavelengths is due to the increase of fine particles concentrations in this period. However, biomass burning aerosols are more absorbent in the wet season than natural aerosols. Unlike other regions impacted by high aerosol loads (Kaskaoutis et al., 2012; Singh et al., 2016; Bibi et al., 2017), SSA decays with the wavelength because, although the predominance of aerosols is concentrated in coarse particles of aerosols in the wet season, they interact less efficiently with solar radiation (Rizzo et al., 2011).
3.4 Comparison of SWARF (AERONET vs. SBDART)
The direct mean radiative forcing of aerosols (SWARF) was evaluated in a pristine forest within the Amazon basin. The seasonal and interannual variability of SWARF (estimated with the SBDART model with aerosol optical parameters provided by AERONET) was evaluated. Regressions performed for the instantaneous values of SWARFSUR and SWARFTOA and the statistical evaluation parameters are shown in Figure 7 and Table I, respectively. There were instantaneous values below -150 W m-2 for SWARFSUR and -70 W m-2 for SWARFTOA. Regressions were also made for SWARF (TOA and SUR) values, separating the dry and wet seasons. Regression parameters are also shown in Table I. The error was slightly higher for the regressions in the dry season. However, in general, the associated errors were relatively lower, and the SWARF estimates had good agreement with the AERONET values.
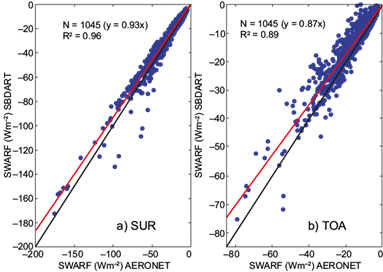
Fig. 7 Scatter plots of AERONET vs. SBDART shortwave aerosol radiative forcing (SWARF) at (a) surface (SUR), and (b) top of the atmosphere (TOA) in Central Amazonia (T0e) from 2011 to 2017. These were instantaneous measurements.
Table I Coefficient of determination, errors (MAE and RMSE), and Willmot coefficient between SWARF AERONET vs. SWARF SBDART. Comparisons were performed for SUR and TOA in Central Amazonia (T0e) from 2011 to 2017.
| N | SUR | TOA | |||||||
| R2 | MAE | RMSE | WILL | R2 | MAE | RMSE | WILL | ||
| Wet | 92 | 0.94 | 0.13 | 1.36 | 0.99 | 0.77 | 1.21 | 1.41 | 0.98 |
| Dry | 425 | 0.96 | 4.80 | 6.28 | 0.98 | 0.78 | 3.76 | 1.46 | 0.98 |
| All | 1045 | 0.96 | 3.44 | 4.49 | 0.99 | 0.89 | 2.58 | 3.34 | 0.98 |
SWARF: shortwave aerosol radiative forcing; SUR: surface; TOA: top of the atmosphere. atmosphere; N: number of pairs with SWARF AND AERONET measurements.
For other locations around the globe, recent studies have shown a good correlation between SWARF values comparing AERONET against SBDART. Adesina et al. (2015) found a high correlation in SWARFSUR (0.95) and SWARFTOA (0.97) in Gorongosa, Africa. Li et al. (2010) performed forcing comparisons in TOA and SUR of AERONET and SBDART and found a high correlation (above 0.92) in 25 different stations along China during 2006. Alam et al. (2012) reported high correlations (0.98 and 0.99) for the SBDART and AERONET measurements for the Karachi and Lahore sites in Pakistan, from 2010 to 2011. Kumar et al. (2015) reported a high correlation (0.89 for SUR and 0.78 for TOA) between AERONET and SBDART during the monsoon and pre-monsoon in Kanpur, India. Similarly, Valenzuela et al. (2012), and recently Bibi et al. (2017), found moderate correlations (from 0.5 to 0.8) for SUR and TOA in the Indo-Gangetic plains in India.
3.5 Seasonal and interannual SWARF 24 h
Atmospheric aerosols are mainly a combination of types of scattering and absorption particles, and their impacts in the form of cooling and heating of the atmosphere are a function of different optical properties (Bibi et al., 2017). In this study, SWARF was calculated separately for TOA and SUR using the SBDART model. However, the difference between SWARFTOA and SWARFSUR produces SWARFATM, which represents the amount of energy retained in the atmosphere by the absorption brought about by aerosols and transformed into thermal energy.
The simulation of SBDART involved the optical properties of aerosols with a 1-h time resolution (2011-2017). The SWARFTOA/SUR time values were integrated according to Eq. (5) resulting in 24-h SWARFTOA/SUR. The monthly averages for 24-h SWARFTOA/SUR/ATM are shown in Figure 8. It was observed that monthly averages of 24-h SWARFTOA reached -14 and -36 W m-2 for 24-h SWARFSUR. However, daily values of 24-h SWARFTOA and SWARFSUR reached values below -30 and -60 W m-2, respectively, in October 2015.
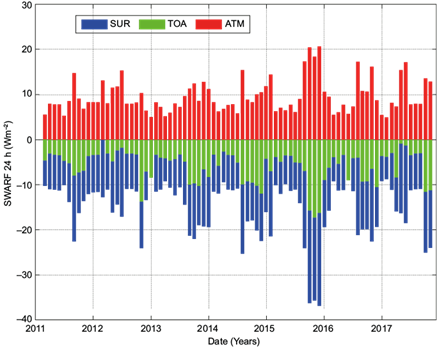
Fig. 8 Monthly variation of 24-h shortwave aerosol radiative forcing (SWARF) at top of the atmosphere (TOA, green), surface (SUR, blue), and within the atmosphere (ATM, red) in Central Amazonia (T0e) from 2011 to 2017.
Seasonal and annual means for SWARFTOA/SUR/ATM are shown in Table II. Its aerosol impact on SWARF significantly increases in the dry season (Fig. 8). Table II shows the average for the whole period. It also shows that 24-h SWARFTOA practically increases in three times, from -3.66 to -9.18 W m-2 from the wet to dry season. This impact is also felt on the surface, but not in the same proportion: 24-h SWARFSUR increased from -11.86 W m-2 in the wet season to -20.77 W m-2 in the dry season. The variation between years is also shown in Table II. As seen in Figs. 3-4, it was expected that the greatest impacts on radiative fluxes would occur in the years when the extension of the dry season and the largest load of burnt aerosols reached the study area. There were more than 11 000 fire spots in 2015, which is the largest record since 2009. More than 5000 fires were recorded in the state of Amazonas only in September 2015, which is 90.3% higher than fires registered during the same period in 2014 (INPE, 2018). As seen in Figure 8 and Table II, 24-h SWARFTOA was -14.06 W m-2 during the dry season of 2015, which is approximately five times higher than the value found during the wet season (-3.95 W m-2). The consequence of 24-h SWARFTOA and SWARFSUR values is the increase of HR in the atmosphere, which is also shown in Table II.
Table II Seasonal and interannual mean variations of 24-h SWARF at TOA, SUR, and ATM, and HR ± standard deviations in Central Amazonia (T0e) from 2011 to 2017.
| 24-h SWARF (W m-2) | HR (K day-1) | ||||
| TOA | SUR | ATM | |||
| 2011 | Wet | -3.7 ± 0.7 | -10.9 ± 0.5 | 7.3 ± 1.2 | 0.23 ± 0.33 |
| Dry | -6.4 ±1.8 | -16.2 ± 4.5 | 9.7 ± 3.5 | 0.31 ± 0.11 | |
| 2012 | Wet | -2.5 ± 0.8 | -13.6 ± 2.2 | 8.3 ± 1.6 | 0.26 ± 0.05 |
| Dry | -6.8 ± 1.5 | -15.0 ± 4.1 | 11.1 ± 2.2 | 0.36 ± 0.07 | |
| 2013 | Wet | -4.2 ± 0.3 | -10.9 ± 1.3 | 6.6 ± 1.3 | 0.21 ± 0.04 |
| Dry | -9.1 ± 1.7 | -20.4 ± 1.5 | 11.3 ± 1.8 | 0.36 ± 0.06 | |
| 2014 | Wet | -3.8 ± 1.3 | -11.0 ± 1.1 | 7.2 ± 0.8 | 0.23 ± 0.02 |
| Dry | -10.2 ± 1.2 | -19.7 ± 2.1 | 9.5 ± 1.0 | 0.30 ± 0.03 | |
| 2015 | Wet | -3.9 ± 0.1 | -10.8 ± 1.0 | 6.9 ± 0.7 | 0.22 ± 0.02 |
| Dry | -14.0 ± 4.8 | -33.3 ± 6.1 | 19.2 ± 1.7 | 0.62 ± 0.05 | |
| 2016 | Wet | -3.9 ± 0.9 | -10.2 ± 1.2 | 6.2 ± 1.0 | 0.20 ± 0.03 |
| Dry | -8.8 ± 1.7 | -20.5 ± 1.5 | 11.6 ± 3.2 | 0.36 ± 0.10 | |
| 2017 | Wet | -3.4 ± 0.3 | -15.5 ± 3.0 | 11.5 ± 3.0 | 0.37 ± 0.09 |
| Dry | -8.6 ± 1.5 | -20.0 ± 4.8 | 12.0 ± 4.9 | 0.39 ± 0.16 | |
| All periods | Wet | -3.6 ± 1.6 | -11.8 ± 2.3 | 8.2 ± 2.9 | 0.26 ± 0.08 |
| Dry | -9.1 ± 2.80 | -20.7 ± 5.0 | 11. 6 ± 4.04 | 0.37 ± 0.13 | |
SWARF: shortwave aerosol radiative forcing; TOA: top of the atmosphere; SUR: surface; ATM: atmosphere; HR: heating rate.
Comparing our results with other studies, Procopio et al. (2004), Patadia et al. (2008), and Sena et al. (2013) had a spatial approach and were restricted to a specific period of biomass burning aerosols, while this study was punctual and it was carried out both in the dry and wet seasons. Considering that the effect of aerosols from biomass burning is the result of the difference in effects between the dry (-9.1 W m-2) and wet (-3.6 W m-2) seasons (Table II), this study estimates that SWARFTOA caused by biomass burning aerosols is -5.5 W m-2. This value is consistent with Patadia et al. (2008) and Sena et al. (2013). Table III compares the results of this and other studies for SWARFTOA values due to the effects of biomass burning aerosols.
Table III Comparison of 24-h SWARFTOA with previous studies*.
| Reference | Region | Period | 24-h SWARFTOA (W m-2) |
| Sena et al. (2013) | Amazon | 2000-2009 | -5.6 ± 1.7 |
| Sena et al. (2013) | Forest | 2000-2009 | -6.2 ± 1.9 |
| Patadia et al. (2008) | Amazon | 2000-2005 | -7.6 ± 1.9 |
| Procópio et al. (2004) | AF | 1993-2002 | -8.3 ± 2.0 |
| Procópio et al. (2004) | AH | 1994-2002 | -8.4 ± 2.2 |
| This work | Forest | 2011-2017 | -5.5 ± 2.8 |
*Results calculated for aerosols from biomass burning. SWARF: shortwave aerosol radiative forcing; AF: Alta Floresta AERONET site; AH: Abracos Hill (Ji Paraná) AERONET site.
The monthly averaged values of SWARFTOA, SWARFSUR, and SWARFATM were calculated using daily averaged ARF (24-h SWARF) from 2011 to 2017. Monthly averaged SWARFTOA/SUR/ATM values for the entire study period, as well as HR, are shown in Figure 9. Monthly statistics have a good agreement with the seasonal mean values obtained in Table II. Furthermore, small variations in monthly averages are observed from July to December. Although HR seasonal values hardly vary (Table II), their decrease is clearly observed, with a minimum value in April (Fig. 9c). Variations are evident in the monthly averages. As expected, the HR variation follows the SWARFATM values. Its decrease is clearly observed, with a minimum value in March and April (wet season).
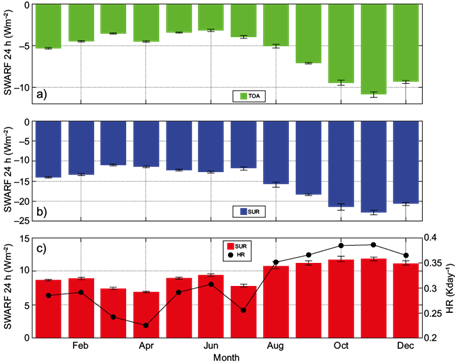
Fig. 9 (a) Monthly averages for 24-h SWARF ± standard deviations and for TOA (green bar), b) SUR (blue bar), c) ATM (red bar), and HR (black line) in Central Amazonia (T0e) from 2011 to 2017.
The radiative and consequently the climatic implications of atmospheric aerosols are analyzed in the form of atmospheric HR. As seen in Eq. (7), HR depends directly on the SWARFATM variation, which depends on the SWARFTOA and SWARFSUR values. It can be seen in Figure 9c that monthly HR values varied slightly from 0.22 to 0.37 K day-1; however, the mean HR in the dry season of 2015 reached 0.62 K day-1. The mean HR value found for the entire study period was 0.26 ± 0.08 K day-1 in the wet season and 0.37 ± 0.13 K day-1 in the dry season. These values are consistent with those reported by Procopio et al. (2004) for the study area. Studying two sites of AERONET (Abracos Hill and Alta Floresta), Procopio et al. (2004) found that aerosols form regional biomass burning caused variations between -5 and -12 W m-2 for SWARFTOA and between -21 and -74 W m-2 for SWARFSUR. The differences between surface and atmospheric measurements are associated with an absorption of 16-62 W m-2 by the aerosol smoke layer, which induced an HR about 0.14-0.53 K day-1.
On a regional scale, the variation of energy retained by the atmosphere has strong implications to changes in temperature and in the thermal structure of the atmosphere. This work addresses a period with few events of high aerosol loading, which contributes to a minimal HR variation in the study area. It was found that biomass burning aerosols caused variations of -9.18 ± 2.80 W m-2 in SWARFTOA and -20.77 ± 5.04 W m-2 in SWARFSUR, which induced an HR of 0.37 ± 0.13 K day-1.
4. Conclusion
This study focused on quantifying the impact of aerosols on the shortwave radiation balance in a pristine forest inside the Central Amazon, under cloud-free conditions. In order to understand the radiative impacts of aerosol on local climate, SWARF in TOA, SUR, and ATM and associated atmospheric HR were calculated using the SBDART model. The analysis was performed using different time scales (monthly, seasonal, and annual) for a long period (2011-2017). The important conclusions of this study are:
From the measurements carried out in situ, the scattering and absorption evidenced the seasonal pattern of aerosol optical properties. Besides, the scattering showed a 10-fold increase from the wet to the dry season. Absorption values also increased, but not at the same ratio. SSA values decreased by 10% at the beginning of the dry season (May-August) due to the strong absorption by black and brown carbon at the beginning of the biomass burning period.
When comparing SSA values in natural conditions of humidity within the atmospheric column (AERONET) with in situ measurements of SSA, it was observed that AERONET values have a higher average (8.4 ± 2.9 %) with the greatest differences found in August and September (11.8%). This is due to the increased emission of biomass burning in the atmospheric column. During the wet season, SSA medians were found to be above 0.99, indicating the dominant effect of scattering on the radiation extinction. The water content in the atmospheric column considerably increased the SSA values.
Spectral analysis of AOD, SSA, and AP for the atmospheric column showed a smaller spectral dependency in the wet season compared to the dry season. AOD varied considerably in the dry season, and the higher values of Angstrom exponent in the dry season indicated that the addition of fine particles of biomass burning contributed to this variation.
The regression analysis of AERONET-SBDART at SUR and TOA revealed that SWARF values showed a relatively high correlation to the dry and wet seasons. For the whole period of analysis (without separation between dry and wet seasons) the R2 for SWARFSUR (AERONET-SBDART) was 0.96 and for SWARFTOA it was 0.89.
The averages for the season with highest aerosol loads (dry season) were -9.18 ± 2.80 Wm-2 for SWARFTOA, -20.77 ± 5.04 W m-2 for SWARFSUR, and 11.59 ± 4.04 for SWARFATM, inducing an HR of 0.37 ± 0.13 K day-1.
Considering that the impact of aerosols from biomass burning is given by the difference between SWARF in biomass burning conditions and SWARF under natural conditions (free of biomass burning), this study quantifies a net effect of -5.52 W m-2 on top of the atmosphere for these aerosols, and -3.66 W m-2 for the effect of natural (biogenic) aerosols in the study area.

