


 text new page (beta)
 English (pdf)
 Article in xml format
 Article references
 Send this article by e-mail
 Cited by SciELO
  Similars in
SciELO
Similars in
SciELO 
 Permalink
1. Introduction
The South Atlantic Convergence Zone (SACZ) is characterized by a persistent cloud band oriented northwest-southeast, extending from the Amazon basin to the southwest Atlantic Ocean (Kousky, 1988; Kodama, 1992; Quadro, 1994; Carvalho et al., 2004; Silva et al., 2019). The SACZ is one of the most important meteorological systems over South America during the summer since it influences the characteristics of the rainy season in most of Brazil (Nogués-Peagle and Mo, 1997). This system develops between October and April, changing precipitation over the north, central-west, and southeast regions of Brazil. In this period of the year, most of the area influenced by the SACZ is affected by intense and persistent rains that cause strong impacts on the human population through landslides and floods (Seluchi and Chou, 2009; Escobar, 2014; Reboita et al., 2017; Brasiliense et al., 2018), especially where there is a higher population concentration (Satyamurty et al., 1998).
In the last decades, there has been considerable progress in knowledge about the leading role of the SACZ in the monsoon system of South America (Nogués-Paegle and Mo, 1997, 2002; Vera et al., 2006; Reboita et al., 2010a; Marengo et al., 2012; Costa and Satyamurty, 2016). More recently, Satyamurty and Rosa (2020) described the seasonal variations of the SACZ by means of a synoptic climatology produced with satellite images. However, weather forecasters have faced many difficulties related to the SACZ identification in the daily routine of the different operational weather centers of Brazil. For example, during the rainy season in Brazil, the weather forecasters observe meteorological situations that seem to be a development of a SACZ episode; however, they evolve into a typical summer meteorological situation (showers, most of the time accompanied by lightning and thunders), where the organized cloudiness responds only to thermodynamic processes (they do not have dynamic influence).
The mean synoptic pattern associated with SACZ episodes is related to the presence of a stationary frontal system at surface over the Atlantic Ocean, close to the southeast region of Brazil, which contributes to the initiation of the moisture convergence at low levels (Escobar and Seluchi, 2012; Escobar, 2014). In the upper troposphere, the mean atmospheric circulation pattern is associated with the presence of the Bolivian High (BH) (Lenters and Cook, 1997) and the cyclonic vortex at high levels near northeastern Brazil (CVHL-NB) (Kousky and Gan, 1981). The convective precipitation observed in much of the central-west, southeast and north regions of Brazil during the rainy season contributes to maintaining the substantial divergence at high levels produced by the BH. Once these surface and altitude atmospheric circulation patterns are established, the transient systems at surface continue passing south of the 30º S latitude. In this way, the atmospheric circulation pattern associated with SACZ episodes remains active and persists approximately between three and 10 days (Escobar and Matoso, 2018).
Escobar (2019) performed a synoptic classification during the Brazilian rainy season for 1979-2016, considering SACZ days and no-SACZ days. This author identified four main synoptic patterns in which two of the most frequent patterns were associated with SACZ events and the climatological mean-field, respectively. The other two synoptic patterns were related to a cold front in the south and southeast regions of Brazil, respectively.
The cold fronts and the baroclinic troughs (Escobar et al., 2019) are the main meteorological systems identified in the daily weather types during the Brazilian rainy season. In this period, the cold fronts are more oceanic and present greater zonal displacement (Andrade, 2005). In addition, the presence of cyclones that form over the Atlantic Ocean is also observed, especially between the Brazilian states of Santa Catarina (SC) and Espírito Santo (ES) (Taljaard, 1972; Simmonds and Keay, 2000; Hoskins and Hodges, 2005; Reboita et al., 2010b; Gozzo et al., 2014; Rocha et al., 2019; Rosa et al., 2019). The atmospheric circulation associated with the cyclones maintains the moisture convergence at low levels and, consequently, contributes to the intensification of precipitation. Most of these cyclones show extratropical characteristics and sometimes they may present subtropical (Evans and Braun, 2012; Gozzo et al., 2014; Brasiliense et al., 2018) or tropical (McTaggart-Cowan et al., 2006) characteristics. On several occasions, these cyclones are also associated with SACZ episodes (Escobar and Seluchi, 2012; Escobar, 2014; Silva et al., 2019), causing strong impacts on the human population (Brasiliense et al., 2018).
The North-Western Argentinean Low (NAL) and the Chaco Low (CHL) are two of the most characteristic systems of low-level atmospheric circulation in South America, having a relevant role during the rainy season in Brazil (Seluchi and Marengo, 2000; Seluchi et al., 2003; Escobar and Seluchi, 2012; Marengo et al., 2012). The CHL has a shallow warm core and is located approximately between the north of Argentina, Paraguay, south of Bolivia and the south of Mato Grosso do Sul (MS). The NAL is usually located around 30º S to the leeward side of the Andes mountains. It presents a shallow warm core and orographic features and occasionally is influenced by dynamic processes. Escobar and Seluchi (2012) performed a synoptic classification of surface pressure fields and found that in the summer season both NAL and CHL can appear in meteorological conditions related to SACZ episodes.
Some studies have shown synoptic features of the atmosphere during SACZ events and the impacts of SACZ on precipitation. Seluchi and Chou (2009) found that the heavy rainfall episodes associated with landslide events in the southeast coastal mountain region of Brazil were mostly related to cold front passages and the SACZ. The most common synoptic pattern associated with this system showed a blocking configuration with a northwest to southeast oriented inverted trough over the Atlantic Ocean, close to the coast of São Paulo (SP) state. They also found that the South Atlantic Subtropical Anticyclone (SASA) was displaced to the south of its climatological position, and the CHL was located over western Brazil and Paraguay. A similar synoptic pattern was found by Weide-Moura et al. (2013) when they made a synoptic classification related to heavy rainfall in Rio de Janeiro city (RJ).
Escobar (2014) carried out a classification of atmospheric circulation fields at the surface and 500 hPa associated with intense rainfall over most part of Minas Gerais (MG) state during December 2011. The SACZ episode associated with a “dipole” blocking configuration over the Atlantic Ocean was the synoptic pattern responsible for this severe weather event. A similar atmospheric circulation pattern related to a SACZ event was found by Brasiliense et al. (2018) in their study of the synoptic situation associated with an intense rainfall event in the Paraíba do Sul river basin in the southeast region of Brazil during January 2000. A blocking pattern was configured over the Atlantic Ocean with a subtropical cyclone at the surface that contributes to intensifying the moisture flux convergence from the Amazon basin and tropical South Atlantic toward southeastern Brazil.
In summary, concerning the daily analysis of the weather, it is possible to identify more than one synoptic pattern associated with SACZ episodes. Due to this daily variability in the synoptic patterns of the SACZ, the objective of this study is to identify the principal modes of daily variation of the atmospheric circulation in the whole troposphere associated with the beginning of the SACZ episodes. In other words, we have a dataset of SACZ episodes from 2007 to 2017 and we reduced it to a small number of atmospheric patterns that represent the total sample of data. The main synoptic patterns of SACZ obtained in this work may also help the weather forecasters to improve the forecast of severe weather episodes during the Brazilian rainy season.
2. Data and methodology
2.1 Data
Sea level pressure (SLP) and the geopotential height fields on 850, 500 and 250 hPa levels at 12:00 UTC from the National Center for Environmental Prediction (NCEP) Climate Forecast System Reanalysis (CFSR) (Saha et al., 2010, 2014) are used for 2007-2017. These data are available at a spatial resolution of 0.5º × 0.5º longitude. The area under study is bounded between 5º-40º S, 30º-80º W, and the period includes October through April (rainy season in South America) (Fig. 1).
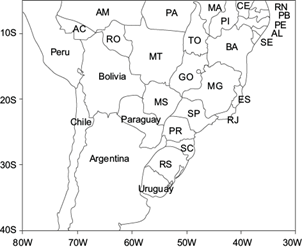
Fig. 1 Map of South America with Brazil’s states abbreviations. RS: Rio Grande do Sul, SC: Santa Catarina, PR: Paraná, SP: São Paulo, RJ: Rio de Janeiro, ES: Espírito Santo, MG: Minas Gerais, MS: Mato Grosso do Sul, MT: Mato Grosso, GO: Goiás, BA: Bahia, SE: Sergipe, AL: Alagoas, PE: Pernambuco, PB: Paraíba, RN: Rio Grande do Norte, CE: Ceará, PI: Piauí, MA: Maranhão, TO: Tocantins, PA: Pará, AM: Amazonas, AC: Acre, RO: Rondônia.
2.2 Detection of SACZ episodes
To identify the principal modes of daily variation of the atmospheric circulation at surface and in the upper air associated with the beginning of the SACZ episodes, firstly, it is necessary to identify these episodes. Then, the SACZ episodes were identified by analyzing the surface and upper synoptic charts at 12:00 UTC from October 2006 to April 2017, performed by the weather forecasters from the CPTEC/INPE. The dates of SACZ events were selected using the methodology presented by Escobar and Matoso (2018), in which the following characteristics should appear simultaneously in the synoptic charts:
A cold front or a baroclinic trough located over the ocean, near the coast between SP and ES states.
A trough in the middle (500 hPa) and high troposphere (250 hPa) located over the southeast region of Brazil or the southern part of the northeast region of Brazil.
A polar jet stream (250 hPa) coupled with a subtropical jet stream associated with the cold front at the surface.
A subtropical jet stream associated with the baroclinic trough at the surface.
A horizontal equivalent potential temperature gradient at 850 hPa, pointing from the Atlantic Ocean to the continent.
A northwesterly flow at 850 hPa extending from the Amazon region to the Atlantic Ocean, passing through the central-west and southeast regions of Brazil.
A homogeneous region where the upward motion at 500 hPa is in phase with the convergent flow at 850 hPa, and the total precipitable water values are greater than 45 mm.
A low-level convergence zone and a band of cloudiness persisting for at least three consecutive days.
The SACZ episodes selected with this methodology are presented in Table I.
Table I Start and end dates (month/date/year) of the 109 SACZ episodes that occurred over Brazil from October 2006 to April 2017.
| 10/17/2006-10/20/2006 | 01/21/2010-01/23/2010 | 12/12/2013-12/26/2013 |
| 11/10/2006-11/12/2006 | 03/01/2010-03/12/2010 | 01/17/2014-01/20/2014 |
| 11/29/2006-12/01/2006 | 03/28/2010-03/31/2010 | 02/15/2014-02/19/2014 |
| 12/08/2006-12/16/2006 | 10/19/2010-10/21/2010 | 02/28/2014-03/02/2014 |
| 12/27/2006-12/29/2006 | 10/27/2010-10/29/2010 | 03/06/2014-03/10/2014 |
| 01/21/2007-01/25/2007 | 11/01/2010-11/04/2010 | 03/22/2014-03/24/2014 |
| 01/30/2007-02/05/2007 | 12/01/2010-12/04/2010 | 10/26/2014-10/29/2014 |
| 02/12/2007-02/16/2007 | 12/14/2010-12/18/2010 | 11/15/2014-11/19/2014 |
| 03/19/2007-03/22/2007 | 12/27/2010-01/07/2011 | 11/27/2014-11/30/2014 |
| 10/23/2007-10/25/2007 | 01/11/2011-01/20/2011 | 12/14/2014-12/17/2014 |
| 11/04/2007-11/06/2007 | 02/15/2011-02/17/2011 | 12/24/2014-12/26/2014 |
| 11/27/2007-12/02/2007 | 02/28/2011-03/10/2011 | 01/22/2015-24/01/2015 |
| 12/12/2007-12/15/2007 | 04/04/2011-04/07/2011 | 02/05/2015-02/09/2015 |
| 12/19/2007-12/23/2007 | 10/02/2011-10/07/2011 | 02/16/2015-02/19/2015 |
| 01/06/2008-01/11/2008 | 10/16/2011-10/20/2011 | 02/27/2015-03/01/2015 |
| 01/20/2008-01/23/2008 | 11/01/2011-11/04/2011 | 03/09/2015-03/14/2015 |
| 01/30/2008-02/02/2008 | 11/23/2011-12/05/2011 | 03/17/2015-03/20/2015 |
| 02/03/2008-02/08/2008 | 12/09/2011-12/12/2011 | 03/22/2015-03/25/2015 |
| 02/24/2008-03/08/2008 | 12/15/2011-12/22/2011 | 04/06/2015-04/08/2015 |
| 03/13/2008-03/18/2008 | 12/26/2011-12/30/2011 | 10/28/2015-10/30/2015 |
| 10/19/2008-10/21/2008 | 01/01/2012-01/09/2012 | 01/14/2016-01/19/2016 |
| 11/07/2008-11/09/2008 | 01/15/2012-01/21/2012 | 01/20/2016-01/23/2016 |
| 11/13/2008-11/24/2008 | 01/26/2012-01/31/2012 | 02/29/2016-03/05/2016 |
| 12/03/2008-12/06/2008 | 02/11/2012-02/13/2012 | 03/10/2016-03/14/2016 |
| 12/12/2008-12/21/2008 | 03/16/2012-03/21/2012 | 03/24/2016-03/27/2016 |
| 12/25/2008-12/31/2008 | 03/24/2012-03/26/2012 | 10/05/2016-10/09/2016 |
| 01/04/2009-01/09/2009 | 11/04/2012-11/08/2012 | 11/15/2016-11/19/2016 |
| 01/21/2009-01/23/2009 | 11/14/2012-11/22/2012 | 12/03/2016-12/06/2016 |
| 01/29/2009-01/31/2009 | 11/26/2012-11/28/2012 | 12/14/2016-12/16/2016 |
| 02/12/2009-02/15/2009 | 12/15/2012-12/17/2012 | 01/13/2017-01/15/2017 |
| 03/13/2009-03/17/2009 | 01/09/2013-01/17/2013 | 01/18/2017-01/23/2017 |
| 03/25/2009-04/02/2009 | 01/26/2013-01/30/2013 | 01/26/2017-01/28/2017 |
| 04/08/2009-04/11/2009 | 02/04/2013-02/10/2013 | 02/08/2017-02/10/2017 |
| 10/08/2009-10/12/2009 | 02/27/2013-03/04/2013 | 02/25/2017-02/28/2017 |
| 10/28/2009-11/01/2009 | 03/27/2013-03/30/2013 | 03/29/2017-04/03/2017 |
| 12/04/2009-12/09/2009 | 10/18/2013-10/20/2013 | |
| 12/13/2009-12/15/2009 | 11/05/2013-11/09/2013 |
2.3 Classification of SACZ events
Using the criteria for detecting SACZ episodes (section 2.2), 109 cases were identified for the period 2007-2017. For these events, the main atmospheric circulation patterns at surface and 850, 500, and 250 hPa were identified through Principal Pattern Sequence Analysis (PPSA) (Compagnucci et al., 2001; Escobar et al., 2004; Huth et al., 2008). According to Compagnucci et al. (2001), the PPSA is considered an extension of the traditional Principal Component Analysis (PCA), with a correlation matrix in T-mode (Green and Carrol, 1978; Richman, 1986; Escobar et al., 2016), whose main objective is to obtain the evolution of the principal dominant modes of atmospheric circulation for specific meteorological situations. Thus, in this application, each variable is a sequence of the consecutive spatial field of a given meteorological variable, and observations correspond to grid points. In this way, the T-mode allows identifying subgroups or types of fields with the same spatial structure.
The matrices have 109 × 7171 (cases × variables) for two days before the SACZ (day 2), one day before the SACZ (day 1), and the SACZ day (day 0). Therefore, the cases correspond to days (109), and variables are the selected grid points over the used domain (7171). The final matrix used as input for the PPSA consists of 109 × 21513 (days × grid points), and it was composed of the three single matrices arranged one below the other. The PPSA was undertaken separately for each meteorological field (SLP and geopotential height at 850, 500, and 250 hPa).
After the application of the PPSA, the Varimax rotation (Richman, 1986) was performed. This methodology is useful to redistribute the total variance of the data among the components to emphasize the physical meaning of the Principal Pattern Sequence (PPS) generated (Richman, 1986). The results and the variance explained by the PPSs depend on the number of sequences retained in rotated solutions. There is no single method acceptable to define the optimum number of significant PPSs (Preisendorfer et al., 1981; Joliffe, 1986; Richman, 1986; Richman et al., 1992). In this study, a set of rules to decide on the number of retained PPSs was used: (a) the eigenvalue 1.0 rule (Kaiser, 1958); (b) the LEV (log-eigenvalues) diagram (Craddock and Flood, 1969), and (c) additional physical interpretation. The results showed, for all the analyzed levels, that the number of significant retained PPS represented a cumulative percentage of explained variance greater than 75%.
The number of PPSs retained for each variable, and the corresponding percentages of variance and the cumulative percentages that were explained are shown in Table II. The resulting PPSs are dimensionless fields, while PPSs loadings are time series of correlations between PPSs and real meteorological fields (atmospheric circulation at surface and geopotential height at 850, 500, and 250 hPa) (Richman, 1986). The component loadings analysis allows the evaluation of the representative patterns (obtained from PPSA) as real atmospheric circulation fields (registered in the reanalyses). Values of component loadings closer to 1 represent sequences of atmospheric circulation fields similar to the obtained pattern sequence. Conversely, loadings with values closer to 0 represent sequences of atmospheric circulation fields without significant physical meaning (Harman, 1976; Cattell, 1978).
Table II Percentages of explained variance and the cumulative percentages explained by the PPSs retained for each meteorological variable.
| PPS | SLP | 850 hPa | 500 hPa | 250 hPa | ||||
| P. Var. | P.C. Var. | P. Var. | P.C. Var. | P. Var. | P.C. Var. | P. Var. | P.C. Var. | |
| 1 | 18.2 | 18.2 | 26.1 | 26.1 | 29.1 | 29.1 | 30.3 | 30.3 |
| 2 | 17.1 | 35.3 | 12.5 | 38.6 | 26.0 | 55.1 | 29.2 | 59.5 |
| 3 | 15.5 | 50.8 | 11.2 | 49.8 | 15.9 | 71.0 | 18.8 | 78.3 |
| 4 | 8.3 | 59.1 | 11.1 | 60.9 | 14.6 | 85.6 | 13.1 | 91.4 |
| 5 | 7.9 | 67.0 | 6.7 | 67.6 | 4.0 | 89.6 | 1.6 | 93.0 |
| 6 | 5.5 | 72.5 | 5.0 | 72.6 | 2.0 | 91.6 | ||
| 7 | 5.1 | 77.6 | 3.9 | 76.5 | ||||
| 8 | 2.8 | 80.4 | ||||||
P. Var.: explained variance; P.C. Var.: cumulative percentages.
The spatial field of the PPSs can be interpreted in both their positive and negative phases (Compagnucci and Salles, 1997). PPSs are related to two different synoptic patterns that have the same shape. For positive values of component loadings (direct mode), PPSs have the same sign as the meteorological variable under study. For example, positive (negative) values of geopotential height at 500 hPa, represent high (low) heights in the PPSs. Conversely, for negative values of component loadings (indirect mode), PPSs have the opposite sign as the real meteorological fields. Therefore, positive (negative) values represent low (high) heights. In this study, the values of component loadings (figures not shown) were positive for all meteorological variables used. It means that the PPSs have the same sign as the meteorological fields (weather type).
To study the atmospheric circulation variability of the whole troposphere related to SACZ episodes, the PPSs of the different levels were related. First of all, a subjective procedure was performed through a visual examination of the PPS obtained at each level analyzed. Because most of the synoptic systems associated with SACZ events show a baroclinic vertical structure (Seluchi and Chou, 2009; Escobar, 2019), we could rapidly find the correspondences between the different levels, due to the personal experience in weather forecasting.
Finally, an objective procedure based on the correlation between the series of component loadings of each PPS identified at each level (figures not shown) was applied to confirm the visual examination results. We would like to highlight that the results are presented in terms of mean sea level pressure and geopotential height and that these fields reveal the atmospheric circulation pattern. Therefore, we can refer, for example, flow without showing the wind field. Moreover, when someone needs to do a synoptic analysis (charts showing only sea level pressure) and describes the principal synoptic weather systems, it is very common to use the term ‘circulation’ to identify the direction of the wind.
3. Results
The dates of the 109 SACZ episodes identified from October 2006 to April 2017 are listed in Table I. The SACZ events (Fig. 2) showed a higher frequency during December and January (20%) and lower in April (3%).
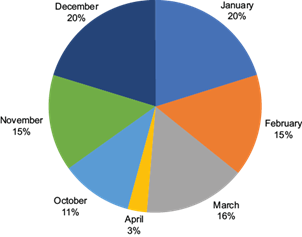
Table II shows that the number of PPSs obtained at upper levels is smaller than at lower levels (the total variance is represented with a smaller number of PPSs than at lower levels). For example, at 250 hPa, only three PPS represented 78.3% of the total variance, while at the surface, seven PPS were needed (Table II). The physical significance of fewer modes explaining a large part of the total variance at upper levels is that the fields there are smoother, away from the surface irregularities.
3.1 Geopotential height at 250 hPa
The analysis identified five PPSs that explain 93.0% of the total variance, with the first four PPSs representing 91.4% of this total (Table II). The last PPS was not presented because it explained only 1.6% of the total variance. The four PPSs are shown in Figure 3, and each one (Fig. 3a-d) is composed by three frames, corresponding to day 2 in the left, day 1 in the middle, and day 0 (related to the day of SACZ occurrence) in the right.
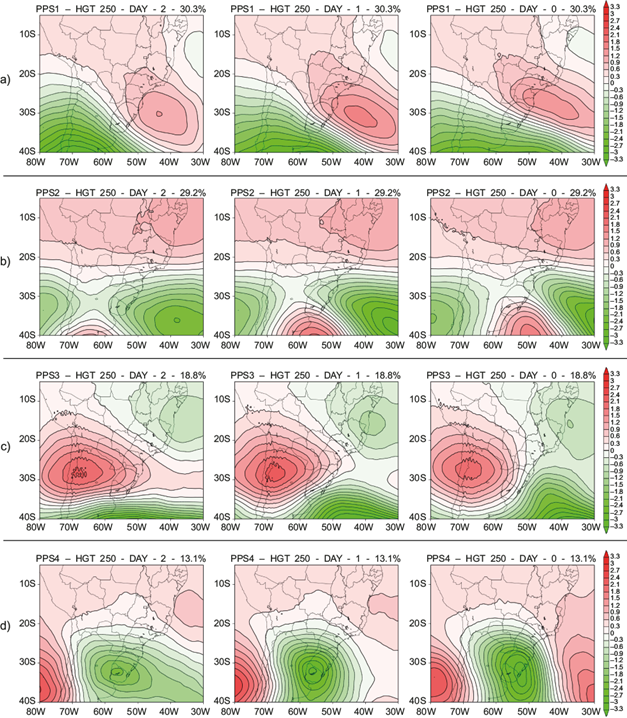
Fig. 3 Principal Pattern Sequence (PPS) obtained at the 250 hPa level. (a) PPS1, (b) PPS2, (c) PPS3, and (d) PPS4. From left to right: day 2, day 1, day 0.
PPS1 (Fig. 3a) explains 30.3% of the total variance and shows at day 2 a long-wave trough with its axis extending meridionally from the southern part of Argentina to northern Chile. Ahead of this low-pressure system, there is a long-wave ridge with an axis extending southeastward from subtropical latitudes to the south Atlantic Ocean. There is another trough positioned farther east of northeastern Brazil with its axis also extending southeastward from tropical latitudes to the Atlantic Ocean. In the following days, the atmospheric circulation appears practically stationary with the meteorological systems showing only a slight movement toward the east. The ridge amplifies slightly on day 1 over the Atlantic Ocean and appears on the SACZ day (day 0), located approximately at 27º S, 45º W. This upper-level high-pressure system is usually associated with the position of the SASA at the surface (Escobar, 2019). As SASA is a dynamic system, it can be identified in the whole troposphere and the ridge or the anticyclone at 250 hPa is located slightly to the west concerning its position near the surface. The trough located to the east of the Northeast region of Brazil is commonly related to CVHL-NB that acts during the rainy season (Kousky and Gan, 1981). The upper-tropospheric trough over Chile and western Argentina shows an intense horizontal geopotential height gradient, probably associated with a baroclinic surface zone.
PPS2 (Fig. 3b) explains 29.2% of the total variance and shows at day 2 a large area of low-pressure over the Atlantic Ocean centered at 37º S, 38º W. This upper-level low-pressure system is associated with a trough with its axis extending southeastward from the east of the south region of Brazil to the south of the Atlantic Ocean. There is a ridge in the continent behind this trough with an associated high-pressure system located over the central and southern regions of Argentina. Both upper-level systems (the trough and the ridge) slowly move eastward during the subsequent days and are commonly associated with a slow displacement of a cold front with its associated post-frontal anticyclone at the surface.
PPS3 (Fig. 3c), with 18.8% of the total variance, is associated with the displacement of a trough from Argentina on day 2 to the Atlantic Ocean off the south region of Brazil during the day the SACZ is configured (day 0). Behind the trough, there is a wide high-pressure area centered approximately over northwestern Argentina and central Chile, which also covers a significant part of the south and central-west regions of Brazil. This upper-level high-pressure system is usually associated with the Bolivian High (BH) that acts in this geographical region during Brazil’s rainy season (Lenters and Cook, 1997). In this PPS, the presence of a second low-pressure system, located approximately to the east of Bahia (BA) state and affecting a large part of the Northeast region of Brazil, suggests the presence of the CVHL-NB.
Finally, PPS4 (Fig. 3d) explains 13.1% of the total variance. It shows at day 2 a large area of low-pressure centered over Uruguay and covering a great part of southern Brazil, the northeastern part of Argentina, and the southern part of Paraguay. During the following days, this large upper-level low-pressure system amplifies and moves slowly eastward. On the day of the SACZ occurrence (day 0), this low is located approximately over the southeastern part of the state of Rio Grande do Sul (RS). This meteorological pattern is usually related to a cut-off low whose associated cyclonic circulation generally appears in the middle and upper troposphere (Reboita et al., 2010c; Pinheiro et al., 2017).
3.2. Geopotential height at 500 hPa
The 500 hPa level represents the middle troposphere and is very important for weather forecasts because the surface systems follow the wind movement at this upper level (Petterssen, 1956; Celemin, 1984; Inness and Dorling, 2013). The PPS analysis obtained six PPSs that explain 91.6% of the total variance, with the first four PPS representing 85.6% of this total (Table II). The remaining PPSs were not considered in this study since their explained variances were lower than 5%. The four PPS are shown in Figure 4.
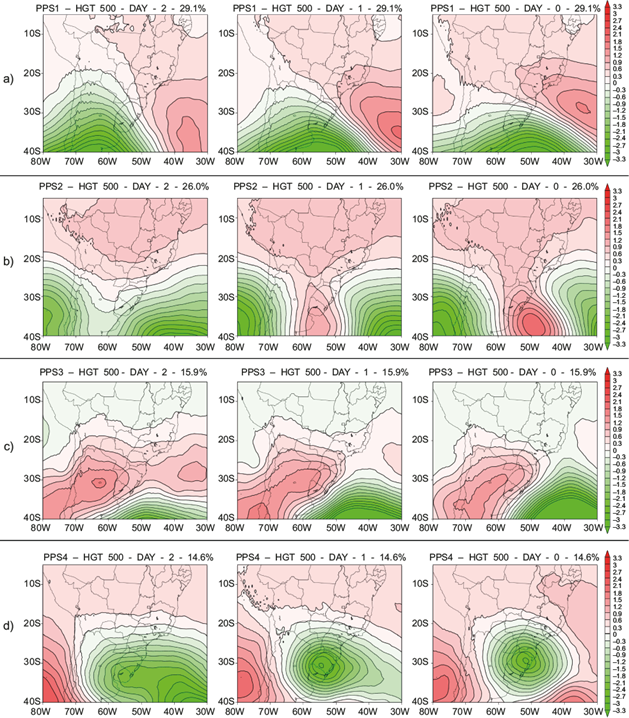
Fig. 4 Principal Pattern Sequence (PPS) obtained at the 500 hPa level. (a) PPS1, (b) PPS2, (c) PPS3, and (d) PPS4. From left to right: day 2, day 1, day 0.
PPS1 (Fig. 4a) explains 29.1% of the total variance. It shows a sequence pattern similar to the PPS1 of 250 hPa, but with displacement toward the east. A pronounced long-wave trough is seen with its axis extending northward from the northern part of Argentinean Patagonia to northern Argentina. Ahead of this trough, there is a high-pressure system moving slowly eastward and is usually related to the climatological position of the SASA observed at the surface. Another area of low relative pressure located in northeastern Brazil, probably associated with the CVHL-NB, usually appears more clearly at 250 hPa (Fig. 3a). The frontal trough is observed approximately over RS state and shows strong baroclinicity during the day the SACZ is formed (day 0).
PPS2 (Fig. 4b), with 26.0% of the total variance, also shows a sequence pattern similar to the PPS2 of 250 hPa, where a blocking configuration is evident during the analyzed period. There is a long-wave pattern showing an amplification as it moves slowly to the east, with the ridge advancing southeastward and the trough moving northeastward on the day of the SACZ occurrence (day 0). The long-wave trough is usually associated with a cold front located approximately over the coast of southeastern Brazil.
PPS3 (Fig. 4c) represents 15.9% of the total variance and also shows a sequence pattern similar to the PPS3 of 250 hPa, where the displacement of a frontal trough from the south to the southeast region of Brazil occurs. This upper-level low-pressure system shows rapid amplification over the ocean, which may be associated with cyclogenesis or frontogenesis development at the surface. On the day of the SACZ occurrence (day 0), there is a large area of high pressure behind the frontal trough covering a great part of Argentina, Paraguay, Uruguay, and most of the south region of Brazil, producing strong subsidence in the middle troposphere. Simultaneously, the frontal trough is related to the presence of a frontal system close to the coast of southeastern Brazil.
The last sequence pattern (PPS4) (Fig. 4d) explains 14.6% of the total variance and shows an atmospheric circulation type associated with a cut-off low, similar to the PPS4 of 250 hPa. This upper-level low-pressure system is centered over the southern region of Brazil and the adjacent Atlantic Ocean, which remains practically stationary during the three days.
3.3 Geopotential height at 850 hPa
The 850 hPa level represents the low troposphere and is also very important for weather forecasts because it is used to detect the position of the wet and dry regions. The winds at this level transport atmospheric water vapor from one place to another contributing to the formation of rain clouds (Petterssen, 1956; Celemin, 1984; Inness and Dorling, 2013).
The PPS analysis yielded seven PPSs that explain 76.5% of the total variance, with the first four PPSs representing 60.9% of this total (Table II). The remaining PPSs were not considered here because their series of component loadings presented values smaller than 0.5 (Harman, 1976; Cattell, 1978). The four PPSs are shown in Figure 5.

Fig. 5 Principal Pattern Sequence (PPS) obtained at the 850 hPa level. (a) PPS1, (b) PPS2, (c) PPS3, and (d) PPS4. From left to right: day 2, day 1, day 0.
PPS1 (Fig. 5a) explains 26.1% of the total variance. It shows a sequence pattern associated with the displacement of a typical frontal trough that advances from Uruguay and northeastern Argentina (day 2) toward southeastern Brazil (day 0). Two days before (day 2) the SACZ episode, a low-pressure system located between northern Argentina and southern Bolivia is observed, probably related to the NAL presence at the surface. With such low pressure and the low-level atmospheric circulation associated, the south part of the southeast region of Brazil is affected by warm and moist air transported from the Amazon basin. Several studies have shown the relationship between low pressure and the flow from Amazonia to the subtropics (e.g., Campetella and Vera, 2002).
PPS2 (Fig. 5b) explains 12.5% of the total variance. It shows a frontal trough advancing with a slow and oceanic displacement from Santa Catarina (SC) state on day 2 to the Atlantic Ocean near the coast of RJ state during the day of the occurrence of the SACZ (day 0). During the analyzed period, there is a relatively low pressure system represented by an inverted trough over the continent affecting the northern part of the south region and part of the central-west region of Brazil. During day 2 and day 1, this pattern indicates the occurrence of a northeasterly flow from the Atlantic Ocean to the southeast region of Brazil, and on the SACZ day (day 0), the southeasterly winds intensify the convergence of a moist air mass over the coast of SP and RJ states.
PPS3 (Fig. 5c) explains 11.2% of the total variance. It shows a sequence pattern related to the developing of a large low-pressure system over the central-south region of Brazil. On day 2 there is an inverted trough between northern Argentina and Uruguay that intensifies and forms a large low-pressure system as it slowly moves eastward during the subsequent days. During the entire analyzed period, a large high-pressure system over the Atlantic Ocean is related to the SASA that slowly moves eastward as the low-pressure intensifies. Thus, a strong horizontal geopotential height gradient between both pressure systems (low-pressure and SASA) is established, producing a significant northeasterly flow over a large part of the south and southeast regions of Brazil on day 2. During the following days, the geopotential height indicates a northwesterly flow over SP and RJ states and over the southern part of MG, which contributes to intensifying the moisture flux convergence over these areas. This atmospheric circulation type at 850 hPa seems to be associated with a weak extratropical cyclone at the surface or with a cut-off low that does not reach the surface. In both cases, an intense advection of warm and moist air from the Amazon region and from the Atlantic Ocean to the southeast region of Brazil was determined to have contributed to this circulation.
The last sequence pattern (PPS4) (Fig. 5d) explains 11.1% of the total variance and reveals the displacement of a frontal trough that amplifies and intensifies as it moves northeastward over the Atlantic Ocean. On day 1 and during the SACZ day (day 0), a secondary trough over the continent is observed with its axis extending approximately southeastward from MS state to SC and Paraná (PR) states. With such 850-hPa geopotential height field, a great part of the southeast and the southern part of the central-west regions of Brazil are influenced by westerly and northwesterly winds that transport warm and moist air from the Amazon basin. On the other hand, a high-pressure system located over central Argentina advances eastward toward the Atlantic Ocean and weakens over the continent during the SACZ day (day 0). The rapid intensification of the frontal trough over the Atlantic Ocean could be associated with cyclogenesis at the surface.
3.4 Sea level pressure
For SLP, we found eight PPSs that explain 80.4% of the total variance, with the first four PPSs representing 59.1% of this total (Table II). As was mentioned in the analysis of the 850-hPa geopotential height field, the remaining PPSs were not considered in the analysis since their series of component loadings presented values lower than 0.5 (Harman, 1976; Cattell, 1978). All the PPSs (Fig. 6) obtained at this level have similar configurations to those identified at the 850 hPa level (Fig. 5).
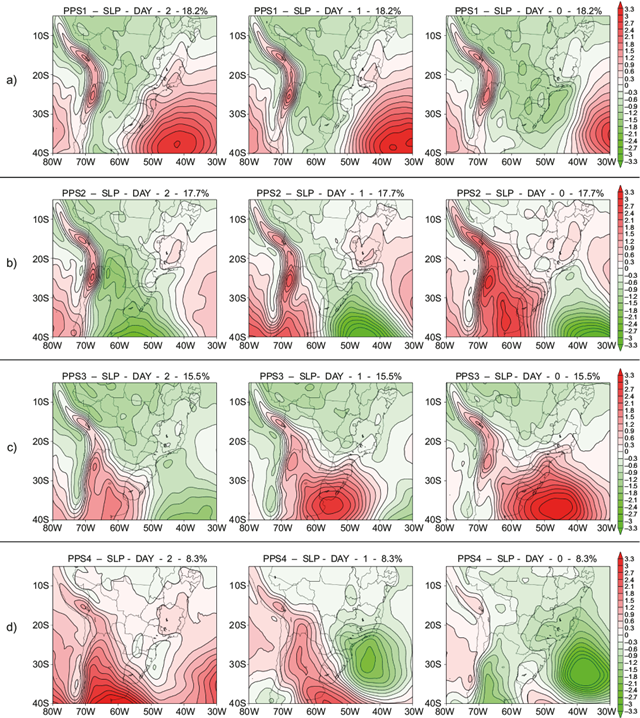
Fig. 6 Principal Pattern Sequence (PPS) obtained at surface level. (a) PPS1, (b) PPS2, (c) PPS3, and (d) PPS4. From left to right: day 2, day 1, day 0.
PPS1 (Fig. 6a) explains 18.2% of the total variance. It shows at day 2 a large high-pressure system related to the SASA, which is positioned at approximately 38º S, 42º W, i.e., south and west of its average climatological position (Marengo et al., 2012). At the same time, there is a low-pressure area on the continent, extending from the south of the Amazon region towards the north of Argentina that it is probably related to the CHL (Escobar and Seluchi, 2012). During the following days, the low-pressure area moves toward the east/southeast while intensifying and covering a great part of south-central Brazil and the adjacent Atlantic Ocean. At SACZ day (day 0), the low-pressure area is commonly associated with a weak extratropical cyclone or sometimes with a subtropical cyclone (Brasiliense et al., 2018), which contributes to intensify the low-level moisture flux convergence. During ZCAS episodes, it is common to observe relative low-pressure areas (inverted troughs or weak cyclones) located approximately over the ocean off the coast between PR, SP, or RJ states. These low-pressure systems generally form due to the strong latent heat released by the abundant rainfall or by a cyclonic disturbance in the mid-troposphere. Sometimes these cyclones may occasionally exhibit subtropical characteristics (Evans and Braun, 2012; Gozzo et al., 2014; Rocha et al., 2019).
PPS2 (Fig. 6b), with 17.1% of the total variance, is associated with the typical passage of a cold front during the rainy season in Brazil (Foss et al., 2017; Escobar, 2019; Escobar et al., 2019). Two days before (day 2) of the SACZ episode, the cold front extends approximately between Uruguay and Bolivia. The extratropical cyclone associated with this frontal system is located over the Atlantic Ocean, southward of 40º S. At the same time, a trough in the Atlantic Ocean with a southwest-northeast orientation between SC and RJ states is present. This trough contributes to the establishment of a continental flow in a northwestern direction over a great part of SP, RJ, and the southern part of MG states. On the day before the SACZ episode (day 1), the cold front advances toward the northeast and extends approximately between the southern part of SC state and southeastern Bolivia. The extratropical cyclone associated with the cold front moves to the east and appears over the Atlantic Ocean close to 40º S, 45º W. On the SACZ day (day 0), the cold front is located approximately between SP state and the southern part of MT state. The extratropical cyclone associated with this baroclinic system continues advancing to the east, centering approximately to the south of 40º S and close to 35º W. During the analyzed period, a migratory post-frontal anticyclone is observed entering the continent near 35º S on day 2 and reaching the southern part of southeast Brazil during the SACZ day (day 0). On this day, the post-frontal anticyclone is centered close to 35º S, 63º W; however, the presence of two ridges is evident, with one advancing to the southeast region of Brazil and the other entering to the east of the Andes mountains and extending to the north of Argentina and Bolivia. With this surface atmospheric circulation, the SACZ is established over the southern part of southeastern Brazil, creating a moisture convergence flux from the Amazon region to the Atlantic Ocean, which persists for at least three days. Therefore, the resulting rainfall affects a large portion of the central-west and southeast regions of Brazil.
PPS3 (Fig. 6c) explains 15.5% of the total variance and also has meteorological characteristics related to a cold front. In this case, the frontal system has a larger amplitude and is more intense than the baroclinic wave of the PPS2. Both the cold front and the migratory anticyclone slowly move to the east, establishing a surface atmospheric circulation similar to a blocking configuration (Sinclair, 1996). This synoptic surface pattern is one of the most frequent weather types observed during the Brazilian rainy season (Escobar, 2019). On day 2, the cold front is located approximately between the south of SP state and the southern part of MS state. The post-frontal anticyclone is situated at the center of Argentina, and it extends over much of this country, Uruguay and most of RS state. On day 1, the post-frontal anticyclone is centered over the Atlantic Ocean at approximately 36º S, 55º W. The cold front appears over the Atlantic Ocean connected with an inverted trough located over RJ state. The day when the SACZ is configured (day 0), the cold front can be seen over the ocean close to ES state and the south of BA state while the high-pressure system continues to move slowly eastward appearing centered approximately at 37º S, 49º W. There is an inverted trough over the continent with its axis extending southward from MS state to the western part of PR state and Paraguay during the analyzed period. With this sequence pattern of surface atmospheric circulation, the cold front is positioned further north compared to PPS2. Therefore, the most significant precipitation tends to concentrate between the northern part of southeastern Brazil and the southern part of the northeast region of Brazil.
Finally, PPS4 (Fig. 6d) explains 8.3% of the total variance and also shows a meteorological situation related to a cyclogenesis process. On day 2, the extratropical cyclone begins to form over the Atlantic Ocean, off the coast of SC state. During the following days, the cyclone rapidly intensifies and moves toward the east/southeast. On day 1, the cold front appears approximately over the southern part of the southeast region of Brazil, reaching ES and the south of BA states during the SACZ episode (day 0). Simultaneously, at day 2, there is a high-pressure system over the continent located to the southwest of the extratropical cyclone and a ridge extending toward the north of Argentina and south of Bolivia. This broad area of high pressure located behind the cold front quickly weakens and remains only over the ocean, to the southwest of the cyclone when the SACZ is formed (day 0). In this case, the surface synoptic chart associated with SACZ events favors the moisture flux convergence and the consequent precipitation concentrated between the southeast and northeast regions of Brazil.
3.5 Relationship between surface and altitude atmospheric circulation patterns
Previous sections presented the PPSs obtained for each atmospheric level. However, we can merge the PPSs to describe the vertical structure of the atmosphere associated with each SACZ pattern. We constructed Table III based on the correlation between the series of component loadings of each PPS identified at each level and on the synoptic and climate knowledge of South America. Finally, we concluded that there are four main atmospheric circulation patterns associated with SACZ episodes (Table III). The four synoptic patterns are cold front (CF), blocking anticyclone (BAn), cut-off low (CL), and cyclogenesis (CG). The CF and BAn patterns show the same PPS for all the three geopotential height levels (250, 500, and 850hP). On the other hand, the CL and CG patterns show the same PPS only in the middle and upper troposphere. Then, real atmospheric circulation fields at each analyzed level related to the four atmospheric circulation patterns were selected through the series of component loadings that presented values greater than 0.7.
Table III Relationship of PPSs between the four atmospheric levels (250, 500, and 850 hPa, as well as SLP) for each of the four main atmospheric circulation patterns identified during SACZ events.
| 250 hPa | 500 hPa | 850 hPa | SLP | |
| CF | PPS1 | PPS 1 | PPS 1 | PPS 2 |
| BAn | PPS 2 | PPS 2 | PPS 2 | PPS 3 |
| CL | PPS 4 | PPS 4 | PPS 3 | PPS 1 |
| CG | PPS 3 | PPS 3 | PPS 4 | PPS 4 |
CF: cold front; BAn: blocking anticyclone; CL: cut-off low; CG: cyclogenesis.
3.5.1.1 Cold front (CF): Synoptic pattern associated with the advance of a cold front
A real sequence of surface and altitude charts related to a CF pattern is shown in Figure 7, which shows the displacement of a typical cold front during 12:00 UTC on March 20-22, 2014. Each atmospheric level (250, 500, and 850 hPa, as well as SLP) is composed of three frames, corresponding to day 2 in the left, day 1 in the middle, and day 0 (related to the day of SACZ occurrence) in the right.

Fig. 7 Real sequence of geopotential height fields at 250, 500, 850 hPa (in dam), and SLP at surface (top to bottom) related to the CF pattern for March 20-22, 2014. (a) day 2, (b) day 1, and (c) day 0.
On day 2 (Fig. 7a), the cold front at the surface is located in the southern part of Buenos Aires province (40º S) and reaches SP state on the SACZ day (day 0), with the post-frontal anticyclone centered over the continent at around 30º S (Fig. 7c). In the middle (500 hPa) and upper troposphere (250 hPa), the frontal trough is seen, which is related to the cold front at the surface and becomes deeper as it moves eastward, particularly when it is located over the Atlantic Ocean during the SACZ day (day 0). Two days before the SACZ occurrence (day 2), the 850-hPa geopotential height field shows a northwesterly wind between the northern part of the south and southeastern regions of Brazil, leading to the advection of warm and humid air from the Amazon to southeastern Brazil. This synoptic pattern is similar to the one identified by Escobar (2019) when he carried out a synoptic climatology during the Brazilian rainy season.
3.5.1.2 Blocking anticyclone (BAn): Synoptic pattern related to blocking situations over the Atlantic Ocean
A real sequence of surface and altitude charts related to a BAn pattern shows a slow displacement of a cold front with a large post-frontal anticyclone in its wake during 12:00 UTC on February 13-15, 2014 (Fig. 8).
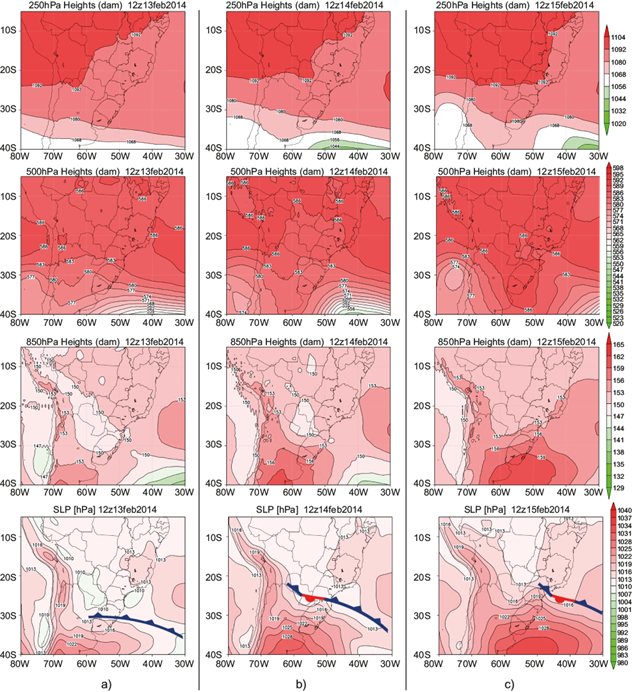
Fig. 8 Real sequence of geopotential height fields at 250, 500, and 850 hPa (in dam), and SLP at surface (top to bottom) related to the BAn pattern for February 13-15, 2014. (a) day 2, (b) day 1, and (c) day 0.
Two days before the SACZ episode (day 2) (Fig. 8a), the cold front is located over RS state with its associated post-frontal anticyclone of 1025 hPa centered over the northern part of Argentinean Patagonia. This high-pressure system moves eastward and is located over the Atlantic Ocean around 40º S, 50º W on the SACZ day (day 0) (Fig. 8c) with a central pressure of 1031 hPa. During the analyzed period, there is a low-pressure system of 1010 hPa (Fig. 8a) over the continent related to the CHL that usually stands out over northern Argentina, Paraguay, and the southern part of MS during the rainy season in Brazil (Escobar and Seluchi, 2012). The mid- and upper-level atmospheric circulations show a long-wave pattern similar to an atmospheric blocking configuration over the Atlantic Ocean. On the SACZ day (day 0) (Fig. 8c), there is a frontal trough with a northwestward extension and a ridge with a southeastward extension. Thus, the blocking is positioned over the Atlantic Ocean around 40º S, 50º W. During day 2 (Fig. 8a) and day 1 (Fig. 8b), the 850-hPa geopotential height pattern shows a northwesterly flow from the Amazon basin to the southeast region of Brazil due to the presence of the CHL. On the SACZ day (day 0) (Fig. 8c), this atmospheric pattern shows a southeasterly flow from the Atlantic Ocean determined by the cold front close to the coast of SP state. This synoptic pattern is also one of the most frequent during the Brazilian rainy season (Escobar, 2019) and is usually associated with heavy rains along the coast of the southeast region of Brazil (Seluchi and Chou, 2009; Weide-Moura et al., 2013).
3.5.1.3 Cut-off low (CL): Synoptic pattern associated with a cut-off low over the central-south of Brazil
A real sequence of surface and altitude charts related to a CL pattern shows the slow propagation of a large low-pressure area during 12:00 UTC on December 13-15, 2011 (Fig. 9). The mid and upper levels present a cyclonic vortex approximately between Uruguay and RS state with a cyclonic circulation affecting a large part of southeastern South America. This atmospheric circulation pattern exhibits barotropic behavior due to the low-pressure system, observed over the whole troposphere, being practically stationary and in phase, characterizing a cut-off low with a blocking configuration. The relatively lower temperatures associated with the cyclonic perturbation at the upper levels combined with the higher temperatures at surface contribute to the increase of atmospheric instability, favoring heavy rains accompanied by lightning and thunderstorms. The low-level patterns induce moisture transport from the Atlantic Ocean and the southern part of the north region of Brazil, leading to the precipitation over the central and southern part of southeastern Brazil (Escobar, 2014; Muñoz et al., 2016; Brasiliense et al., 2018). The cut-off low system intensifies and reaches the surface favoring the occurrence of a surface cyclone of 1007 hPa (Fig. 9c) over the Atlantic Ocean, close to the south region of Brazil. This cyclone is usually not frontal and shows subtropical features (Evans and Braun, 2012; Brasiliense et al., 2018; Reboita et al., 2019).

3.5.1.4 Cyclogenesis (CG): Synoptic pattern associated with a cyclogenesis process over the Atlantic Ocean
A real sequence of surface and altitude charts related to a CG pattern corresponds to February 10-12, 2007 when an extratropical cyclone developed over the Atlantic Ocean off the coast between SC and SP states (Fig. 10). The mid and upper levels present a frontal trough with a rapid meridional amplification as it moves northeastward during the analyzed period. At the 250 hPa level, there is also an upper-tropospheric low of 10920 gpm over the Atlantic Ocean, eastern BA state, related to the CVHL-NB that appears over this region during the rainy season in Brazil (Fig. 10a). The 850-hPa geopotential height pattern also features the frontal trough moving northeastward and having a rapid amplification over the Atlantic Ocean since the day before the SACZ occurrence (day 1) (Fig. 10b). The day when the SACZ is formed (day 0) (Fig. 10c), the SLP field shows a cold front extending approximately at the coast of ES state and its associated extratropical cyclone of 1004 hPa, located near 31º S, 30º W. The post-frontal anticyclone is located around 37º S, 52º W, generating southeasterly flow over the coast between SC and RJ states. With this synoptic pattern, a convergence of moist air between ES and BA states is established. Therefore, the SACZ episode favors the most significant precipitation occurrence over the northern part of the southeast region of Brazil.

4. Conclusions
Synoptic classification of the occurrence of the SACZ during the period 2007-2017 was made in this study to identify the principal modes of variation of the atmospheric circulation at surface and altitude associated with this meteorological system. The atmospheric circulation patterns produced in this study fit very well with the main synoptic types of SACZ recognized by experienced forecasters during the rainy season of Brazil.
In the middle (500 hPa) and upper (250 hPa) troposphere, the atmospheric circulation shows two patterns (PPS1 and PPS3) related to a typical long wave frontal trough, which amplifies and becomes deeper over the Atlantic Ocean as it begins to move eastward. PPS3 features a more rapid amplification over the ocean than PPS1, favoring a cyclogenetic process at the surface; both patterns also show the influence of the CVHL-NB over the northeast region of Brazil. PPS3 shows the BH positioned over its climatological location. The other patterns (PPS2 and PPS4) are related to an atmospheric circulation similar to a blocking configuration. PPS2 features an intense high-pressure system over the Atlantic Ocean that is practically stationary since the day before the occurrence of the SACZ. On the other hand, PPS4 is associated with a large area of low pressure covering most of the central-south of Brazil that stays stationary during the entire period.
The 850-hPa geopotential height field shows three low-level patterns (PPS1, PPS2, and PPS4) related to the displacement of a frontal trough that reaches southeastern Brazil on the SACZ day. PPS1 features a typical front trough showing a northwesterly humid and warm flow from the Amazon basin for two days before the SACZ episode is established. PPS2 shows a frontal trough with a slow oceanic propagation and a large post-frontal anticyclone located over the Atlantic Ocean. An inverted continental trough also contributes to intensifying the moist and warm air mass convergence one day before over southeastern Brazil. These patterns (PPS1 and PPS2) were also identified at the surface through PPS2 and PPS3, respectively. PPS4 at 850 hPa shows the displacement of a typical frontal system with a meridional propagation, especially from one day before the SACZ episode is established. This pattern was also identified at the surface through the PPS4 that is usually associated with a cyclogenetic process.
The last pattern (PPS3) at 850 hPa is characterized by a large and wide cyclone centered approximately over the central-south of Brazil, which becomes deeper over the Atlantic Ocean as it propagates eastward. The cyclonic circulation related to this low system stays practically stationary during the entire analyzed period. It provides permanent northwesterly winds over southeastern Brazil, resulting in moisture convergence over the area. A similar synoptic pattern was found at the surface by the PPS1 pattern.
The combination of all the levels (surface, lower, mid, and upper levels) identifies four main atmospheric circulation patterns associated with SACZ episodes. Three of them (CF, BAn and CG) correspond to a cold front moving toward southeastern Brazil with the post-frontal anticyclone moving over the Atlantic Ocean. The last atmospheric circulation pattern (CL) is associated with a cut-off low over the central-south of Brazil.
The CF pattern is related to the typical passage of a cold front during the rainy season in Brazil. At day 2, the cold front is located over central Argentina and enters the coast of SP and RJ states during the day of the SACZ occurrence. At 850 hPa, a northwesterly flow over the southern part of the southeast region of Brazil predominates from two days before the occurrence of the SACZ episode. Such evolution of a low-level configuration corresponds to the frontal trough observed in the middle and upper troposphere with the BH and the CVHL-NB.
The BAn pattern is also associated with a cold front passage, however, with slower displacement concerning the CF pattern. The frontal system moves slowly eastward and stays stationary close to the coast of the northeastern part of SP state and the southern part of RJ state during the SACZ day. This stationary front is connected to a large area of low pressure located over the continent, increasing the moisture convergence and precipitation over the southern part of southeastern Brazil. In the middle and upper troposphere, there is a baroclinic long wave with an associated ridge and trough amplifying and moving slowly to the east, establishing a blocking configuration. With such a synoptic pattern, the post-frontal anticyclone stays stationary for some days, acquiring subtropical characteristics. It means that the SASA is located to the south of its climatological position and the stationary front appears to the north of this high-pressure system.
The CG pattern is also associated with a cold front, though accompanied by a cyclogenetic process over the Atlantic Ocean. The 500-hPa geopotential height pattern shows the baroclinic wave trough becoming deeper and more amplified as it begins to move eastward, particularly when it is positioned over the Atlantic Ocean. The cold front associated with this extratropical cyclone is positioned approximately near the coast of ES state. Thus, the convergence zone related to the SACZ episode is located in the northern part of southeastern Brazil.
The last pattern (CL) is related to a cut-off low centered over the central-south of Brazil. The barotropic vertical structure associated with this kind of system shows a low-pressure system that is practically in the same position in the four analyzed levels. At the surface, the cyclone is usually not frontal and presents subtropical features, with a relatively warm core at low levels and a cold core at high levels. This synoptic pattern organizes a convergence zone that induces moisture transport from the Atlantic Ocean and from the southern part of the north region of Brazil to most of southeastern Brazil.
It is important to highlight this paper added two more synoptic patterns associated with SACZ concerning Escobar (2019), when he performed a synoptic classification during the Brazilian rainy season. In addition to this, we also add the description of the meteorological systems in the whole troposphere, considering the low (850 hPa) to upper (250 hPa) levels. Thus, we could identify the principal modes of daily variation of the atmospheric circulation in the whole troposphere associated with SACZ episodes.
Finally, it is noteworthy that the results obtained in this study are useful for weather forecasters working in operational weather centers that have to predict the synoptic patterns of SACZ during the rainy season in Brazil.

