


 text new page (beta)
 English (pdf)
 Article in xml format
 Article references
 Send this article by e-mail
 Cited by SciELO
  Similars in
SciELO
Similars in
SciELO 
 Permalink
1. Introduction
Spatial and temporal variations of water availability for agricultural and livestock purposes in irrigation basins have highlighted the vulnerability (i.e., resilience capacity) of these economical activities and enhance decision makers to consider changes within the productive systems aiming to make a more rational use of limited amounts of water. The impact of such variation in water availability and the consequent vulnerability has deeply affected the regional economy of arid lands in northern Mexico. The main irrigation districts in Mexico are located within the arid and semi-arid portions of the country, where agriculture is strongly dependent upon runoff to the reservoirs. Water allocation to users for irrigation purposes is performed considering the history of flows to the dams, which are subject to rainfall uncertainty.
The spatial variation of water availability in Mexico is of considerable magnitude; in this way, population and economic activities are inversely related to water availability. Less than a third of total runoff occurs within the 75% of the territory where most of the country’s largest cities, industrial facilities, and irrigated land are located. Consequently, surface runoff and groundwater are becoming insufficient to support the high population growth rates and economic activity, resulting in disputes over surface water usage (González and Magaña, 2018). Furthermore, the southwest part of Mexico accounts for two thirds of the renewable water in the country and one fifth of the population, whereas the northern part, where the main irrigation districts are located, accounts only for one third of renewable water and four fifths of the total population (CNA, 2018).
The northwest region of Mexico has been impacted by severe droughts through time (Buechler, 2009) and there is a lack of adaptation strategies to cope with the situation (Eakin et al., 2007). Climate uncertainty has been reported within the irrigation districts of Mexico. For instance, Sánchez-Torres et al. (2011) indicate that climate change scenarios have the most negative impact on water availability in the agricultural sector. The authors argue that water concessions, irrigation districts, and hydraulic infrastructure in the river basin need to be reconsidered and updated to assure water availability to all its users. On the other hand, Sánchez et al. (2018) analyzed the impact of El Niño Southern Oscillation (ENSO) on water availability in an irrigation district of northern Mexico. Their findings suggest a deep impact on water availability for all uses. Martínez et al. (2014) analyzed the climatic trends in Irrigation District 041, located in the lower watershed of the Yaqui River, concluding that there is an increasing trend of temperatures, but not in precipitation records. Paredes et al. (2018) also evaluated the impact of water resources availability on crops of the irrigation districts of the Río Bravo basin; they concluded that temperatures, rates of evapotranspiration, and crop water demand would increase under the different scenarios evaluated with impact on the irrigation districts’ operation.
This study aims to present a protocol for analyzing readily available climatic and hydrological information for achieving a rational planning of irrigation water allocation to users through optimal irrigation plans that consider the impact of climate change on water resources. We present as a case study Irrigation District No. 041 in northern Mexico.
2. Methods
The algorithm of analysis seeks to link climate and hydrologic information to provide a rational appraisal of the impact of climate variability on water resources for agricultural purposes. Figure 1 presents the general flux diagram of the protocol for achieving the objectives of the study. The core of the planning is the availability of databases. In Mexico, there exist databases that can be easily accessed through official dependences concerning natural resources. For instance, Table I presents some of the databases available from which information may be drawn for analysis purposes.

Table I Some sources of spatial information on natural resources and geographic data in Mexico.
| Data | Official agency | URL |
| Climatic data | CNA | https://www.google.com/search?q=kml+estaciones&oq=kml+estaciones&aqs=chrome..69i57j69i60j69i65j69i60l3.2848j0j7&sourceid=chrome&ie=UTF-8 |
| Runoff and soil erosion | CNA | http://www.conagua.gob.mx/CONAGUA07/Contenido/Documentos/Portada%20BANDAS.htm |
| Thematic data | CONABIO | http://www.conabio.gob.mx/informacion/gis/ |
| Hydrology | INEGI | http://antares.inegi.org.mx/analisis/red_hidro/siatl/# |
| Climatic data | SMN | https://smn.conagua.gob.mx/es/climatologia/informacion-climatologica/informacion-estadistica-climatologica |
| Climatic data | INIFAP | http://clima.inifap.gob.mx/lnmysr/Estaciones |
| Geographic data | INEGI | https://www.inegi.org.mx/datos/ |
CNA: Comisión Nacional del Agua (National Water Commission); CONABIO: Comisión Nacional para el Conocimiento y Uso de la Biodiversidad (National Commission for the Knowledge and Use of Biodiversity); INEGI: Instituto Nacional de Estadística y Geografía (National Institute of Statistics and Geography); SMN: Servicio Meteorológico Nacional (National Weather Service); INIFAP: Instituto Nacional de Investigaciones Forestales, Agrícolas y Pecuarias (National Institute for Forestry, Agriculture and Livestock Research).
In Mexico, there are 85 irrigation districts and 13 administrative regions that annually comprise more than 3 million irrigated hectares throughout the country. The northwest region (predominantly arid) reports alone 480 000 hectares within seven irrigation districts. In this region, the main irrigation district (ID) is No. 041 (Yaqui River), with an average of 280 000 irrigated hectares planted each year (CNA, 2018). ID No. 041 is located in the lower part of the Yaqui River watershed, which has an area of 75 452 km2. This ID is strongly dependent on the runoff captured in the upper watershed, which feeds the reservoirs. In this way, the planted area in the ID varies through time. The Yaqui River watershed encompasses two states, Sonora and Chihuahua, in the northern portion of the country (Fig. 2). Even though the runoff is gaged for each sub-watershed that drains off to each reservoir, the planning of the irrigation district takes into account the total available volume considering the whole system of reservoirs. Not all the available water is used for agricultural purposes in the region; specific uses are presented in Table II.
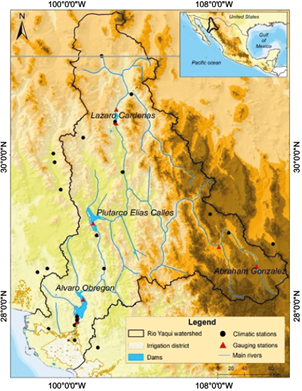
Fig. 2 The Yaqui River watershed with four main reservoirs: Lázaro Cárdenas (upper), Plutarco Elías Calles (middle) and Álvaro Obregon (bottom). The Abraham González dam does not provide water to the system of dams that irrigates the district in the lower watershed.
Table II Reservoir use and watersheds within the Yaqui River.
| Reservoir | Watershed size (km2) | Reservoir maximum capacity (Mm3) | Water uses |
| Lázaro Cárdenas | 19 292 | 921.2 | Irrigation, municipal and industrial, regulation |
| Plutarco Elías Calles | 40 368 | 3628.6 | Electricity, regulation |
| Álvaro Obregón | 11 792 | 3161.7 | Irrigation, municipal and industrial, regulation |
2.1 Hydrological data
Local authorities of the National Water Commission of Mexico provided monthly runoff data (in volume) for each sub-watershed considered within the study; the length of the record was from 1941 to 2018. This data comes from the gauging stations of each sub-watershed (Fig. 2).
2.2 Rainfall data
Daily rainfall records were obtained from the climatic stations within the watershed. The criteria for selecting the climatic stations was to have at least 30 years of consecutive information with no more than 10% of missing information and having been operated at least since 2005. Afterwards, a consistency and homogeneity analysis of the climatic information was performed for verifying the adequacy of the data (Esquivel et al., 2019). The length of runoff records was larger than rainfall data.
2.3 Standardized precipitation index (SPI)
The method for calculating the standardized precipitation index (SPI) was developed by McKee et al. (1993) and Edwards and McKee (1997) to study relative deviations of precipitation from the normality. It uses monthly precipitation aggregates at various time scales (1, 3, 6, 12, 18, and 24 months). The SPI is obtained by fitting a gamma or a Pearson type III distribution to monthly precipitation values. Generally, monthly precipitation is not normally distributed, thus a transformation is performed such that the derived SPI values follow a normal distribution. The SPI is the number of standard deviations that the observed value would deviate from the long-term mean, for a normally distributed random variable. The scale of the SPI is: ≥ 2.0 (extremely wet), 1.5 to 1.99 (very wet), 1.0 to 1.49 (moderately wet), -0.099 to 0.99 (near normal), -0.0 to -1.49 (moderately dry), -1.5 to -1.99 (severely dry), and ≤ -2 (extremely dry) (WMO, 2012).
ID No. 041 has a system of reservoirs in the upper watershed of the Yaqui River that provide water for irrigation purposes, as well as for energy generation and industrial activities. To assess the water availability of the irrigation district we calculated an SPI for each sub-watershed of the Yaqui River; then, a regional SPI was obtained after a principal component analysis (PCA) to identify the climatic stations that better account for data variability. The PCA is a statistical procedure for filtering data. This procedure synthetizes in a few not correlated new variables a major part of the total variation of a high number of highly inter-correlated variables. This reduction in dimensionality leads to a better understanding and interpretation of data. The newly non-correlated variables are called principal components and they consist in linear combinations of the original variables (Sigdel and Ikeda, 2010). This analysis allowed to determine the percentage of common variability among climatic stations and to integrate a regional SPI.
2.4 El Niño Southern Oscillation (ENSO)
To assess the impact of general circulation patterns on rainfall regimes within the study region, we correlated ENSO data with the SPI for the three sub-watersheds of the Yaqui River. The ENSO cycle is a scientific term that describes the fluctuations in temperature between the ocean and atmosphere in the east-central Equatorial Pacific, approximately between the international date line and 120º west (NOAA, 2020).
Indices used to monitor the tropical Pacific are based on sea surface temperatures (SST) anomalies averaged across a given region. Usually, the anomalies are computed relative to a base period of 30 years. The Niño 3.4 index (5ºN-5ºS, 120º- 170ºW) and the Oceanic Niño Index (ONI) are the most commonly used indices to define El Niño and La Niña events (Trenberth and Stepaniak, 2001). The numbers (3.4 index) correspond with the labels assigned to ship tracks that crossed these regions. The Niño 3.4 anomalies may be thought of as representing the average equatorial SSTs across the Pacific from about the dateline to the South American coast. For an event to be classified as El Niño, the five-months running mean must exceed +/- 0.4 °C for a period of six months or more. The ONI uses three-month averages and to be classified as a full-fledged El Niño or La Niña, the anomalies must exceed +0.5 °C or -0.5 °C for at least five consecutive months (Trenberth, 2020). The El Niño Southern Oscillation Index (commonly abbreviated as SOI) is a standardized index based on the observed sea level pressure differences between Tahiti and Darwin, Australia. The SOI computation is shown in Eq. (1):
where STD T a is the standardized sea level pressure for Tahiti, STD D a is the standardized sea level pressure for Darwin and MSD is the monthly standard deviation. To compute the standardized sea level pressure either for Tahiti or Darwin Eq. (2) is used:
where AT a _D a SLP is the actual sea level pressure either for Tahiti (T a ) or Darwin (D a ), M T a _D a SLP is the mean sea level pressure for either Tahiti or Darwin and SDT a _D a is the standard deviation for the sea level pressure for either Tahiti or Darwin. The monthly standard deviation is computed as shown in Eq. (3):
where STD T a is the standardized sea level pressure for Tahiti, STD D a is the standardized sea level pressure for Darwin and “N” is the number of months.
Data of El Niño were obtained from the National Oceanic and Atmospheric Administration (NOAA, 2019).
2.5 Rainfall-runoff relationships
For a better appreciation of the watershed potentiality for producing runoffs, and as a basis for planning purposes, we computed the rainfall-runoff relationships for the three sub-watersheds that drain to the irrigation reservoirs. In this way, rainfall and runoff depths were correlated and the rainfall-runoff functions obtained. Runoff depth (mm) was obtained dividing the runoff volume by the watershed area. Eq. (4) describes this relationship:
where a and b are regression parameters that depend on the watershed characteristics and p is precipitation (mm).
3. Results and discussion
Figure 3 shows the relationship between ENSO and the SPI for the three sub-watersheds of the study, named according to the reservoir they drain to: Lázaro Cárdenas, Plutarco Elías Calles, and Álvaro Obregón. It should be noted that ENSO modulates the rainfall patterns in the sub-watersheds; therefore, it also influences the volume that runs off the sub-watersheds to the reservoirs. As previously stated, the ENSO phenomenon is a change in the thermal conditions of the ocean; therefore, the main impact is a substantial modification in continental rainfall patterns in. According to this, Figure 3 shows how the SPI responds accordingly to the signal of ENSO; also, periods of dry and wet spells are evident. Runoff generation is differentiated in each sub-watershed depending on the physical and surface conditions of each area.
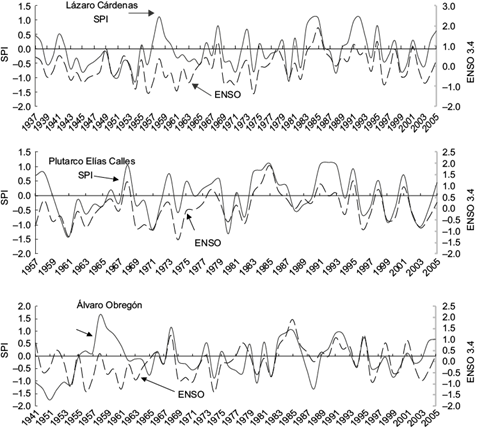
Fig. 3 Relationships between ENSO and the SPI for the three sub-watersheds of the Yaqui River watershed.
The regional SPI was used for runoff generation in the whole watershed. As previously noted, the climatic stations considered for the regional SPI computation were chosen from a PCA. Figure 4 shows the regional SPI for the Yaqui River watershed.

Dry spells have a huge impact on the planted area within the irrigation district down below the Yaqui River watershed. The planted area in the irrigation district is a function of the available water for irrigation purposes. Figure 5 shows the variations of the planted area in the irrigation district through time, as a function of the SPI and the runoff generated in the upper watershed.
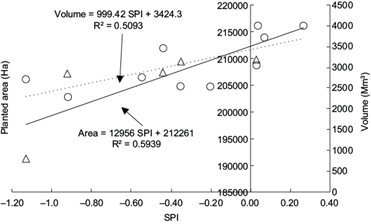
Fig. 5 Runoff volume to the system of dams and planted area in Irrigation District No. 041 as a function of the SPI.
The runoff volume is strongly dependent upon the watershed characteristics, soil type, soil cover, slope, and management (Hudson, 1993). From this relationship, a runoff coefficient (RC) can be obtained. The RC is a parameter describing basin response, on either an annual or event basis (Blume et al., 2007). Rainfall-runoff curves depict the behavior of these combined variables and bestow an appreciation of the expected runoff given a rainfall event. Figure 6 shows the rainfall-runoff curves for the three sub-watersheds of the Yaqui River.
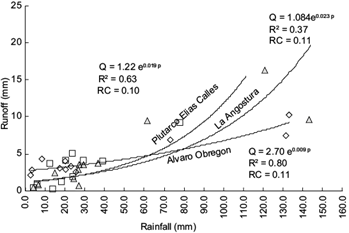
Fig. 6 Rainfall (p)-runoff (Q) relationships and runoff coefficients (RC) for the three sub-watersheds of the Yaqui River.
From figures 3, 5, and 6 some useful information may be obtained for decision-making processes:
In terms of SPI values, the most impacted sub-watershed by El Niño and its associated SPI is Lázaro Cárdenas, followed by the Álvaro Obregón and Plutarco Elías Calles sub-watersheds. Data querying and visual appreciation of Figure 4 shows that SPI values for Lázaro Cárdenas are the most persistent negative values for this index, indicating more dry spells within the data series. The SPI also indicates, besides the magnitude of the spell, the duration of the dry or wet period.
Under a ‘normal year’ (SPI ≈ 0), the allocated volume for irrigation should be close to 3500 Mm3 (where the regression line crosses the y axis).
The irrigated area with the above condition would have an approximate extension of 212 000 ha.
The decision criteria for allocating water to users under moderately drought conditions (-1 < SPI ≤ -1.49) with available volumes below 2000 Mm3, should consider less water-demanding crops and irrigation schemes that increase water use efficiencies.
Even though the Lázaro Cárdenas and Álvaro Obregón sub-watersheds have a greater RC (0.11) under the same amount of rainfall, the Plutarco Elías Calles (RC = 0.10) produces a larger runoff given its relatively larger area.
Without losing generality, the three sub-watersheds require about the same amount of antecedent rainfall to initiate the runoff (≈ 5 mm), which is an indicator of the generalized surface condition in the three sub-watersheds.
The shown rainfall-runoff relationships are fitted curves to observed data; therefore, applying the regression models do not imply that under zero precipitation a runoff event will occur. The coefficient of determination (R2) of these relationships between rainfall and runoff highlight the need of having more hydrological data that better represents the watershed behavior. Therefore, the models should be used as a first approach to a rational assessment of the amount of runoff that a given amount of rainfall will produce.
The coefficients of determination (R2) shown in Figure 5 have significance levels of α = 0.05% for one tailed test. The results of a one-tailed test will double the significance compared with the corresponding two-sided test. Our null hypothesis was that increasing the SPI value (representing precipitation) will increase runoff events and therefore the planted area; to expect the opposite will be unreal and unphysical.
4. Conclusions
We delineated a protocol to analyze readily available climatic and hydrologic information, in order to achieve a rational planning for allocating irrigation water to users. The SPI and the rainfall-runoff relationships linked to El Niño phenomenon involve the climatic variations of a region, which have a huge impact on water availability for irrigation. Within this context, the operation of irrigation districts should consider the volume of water available in the reservoirs, considering the composition of the crop pattern that maximizes net income and water productivity. We agree with Sánchez-Torres et al. (2011), who conclude that climate change scenarios have the most negative impact on water availability in the agricultural sector. Also, the U.S. Environmental Protection Agency considers that dealing with drought could become a challenge in areas where rising summer temperatures cause soils to become drier (USEPA, 2017).
The functional relationships obtained between climatic and hydrological information may be useful to anticipate irrigation plans under the climate uncertainty scenarios that characterize watersheds in arid and semi-arid regions, as the one used as a model in this study.

