


 text new page (beta)
 English (pdf)
 Article in xml format
 Article references
 Send this article by e-mail
 Cited by SciELO
  Similars in
SciELO
Similars in
SciELO 
 Permalink
1. Introduction
“If you can’t measure it, you can’t improve it” (Peter Drucker). This statement is valid in every aspect of science and business. In hydrology in particular, measurements are not always sufficiently available or accurate. Nonetheless, precise precipitation measurements and estimates are essential for resource quantification studies, hydrological and meteorological modeling, decision making, and for disaster prevention in extreme weather events (Larson and Peck, 1974; Habib et al., 2001).
Ground measurements are often scarce or have low temporal resolution. Additionally, ground measurement devices fail or are destroyed during extreme weather events, such as tropical cyclones, resulting in lack of data during these high-impact events. Another problem is that these devices take point measurements whose values need to be interpolated and/or extrapolated to provide estimates in areas with no in-situ measurements (Ciach, 2003; Upton and Rahimi, 2003; Ly et al., 2013). Radar-derived rainfall provides spatial estimates at high spatial and temporal resolutions with larger areal coverage if they are properly calibrated and maintained. However, radar usage is limited in mountainous regions (Borga, 2002; Villarini and Krajewski, 2010; Nanding et al., 2015; Rico-Ramírez et al., 2015). This leads to the convenience of complementary data sources, such as satellite-based global climate information and numerical weather prediction (NWP) products, which are not limited by topography or device fragility.
The main advantages of satellite-derived rainfall estimates are their high spatial resolution, coverage, and near real-time availability (Paredes-Trejo et al., 2016). These products can be divided into three groups (Coning, 2013): (1) Single satellite source data sets such as the GOES precipitation index (GPI; Arkin et al., 1994) and The Hamburg Ocean Atmosphere Parameters and Fluxes from Satellite data record (HOAPS; Andersson et al., 2010); (2) satellite combination data sets such as the Climate Precipitation Center (CPC) Morphing Technique (CMORPH; Joyce et al., 2004) and the Global Precipitation Measurement Mission (GMP; Hou et al., 2014); and (3) a combination of data sets with gauge data (these data sets are the products of input data from more than one sensor type, including satellites and rain gauges) like PERSIANN (Hsu et al., 1997), Global Precipitation Climatology Project (GPCP; Adler et al., 2003), TRMM Multi-Satellite Precipitation Analysis (TMPA) Rainfall Estimate Product 3B42 (TRMM 3B42; Huffman et al., 2007), and Climate Hazards Group InfraRed Precipitation with Station data (CHIRPS; Funk et al., 2015). A broader list of available datasets can be found at http://www.isac.cnr.it/~ipwg/data/datasets.html.
Alternatively, reanalyses generated by different national or regional agencies provide multivariate, spatially complete, and coherent records of the global atmospheric circulation. Some examples are the Global Land Data Assimilation System (GLDAS; Rodell et al., 2004), North American Land Data Assimilation System (NLDAS; Mitchell et al. 2004; Xia et al., 2012), Modern-Era Retrospective Analysis for Research and Applications (MERRA; Rienecker et al., 2011), and ERA5 (Hersbach et al., 2018). These reanalysis datasets are produced via data assimilation, a process that relies on observations and model-based forecasts to improve model output (Parker, 2016).
The successful performance of any hydrological application is largely determined by the quality of precipitation input data. Thus, when using these precipitation products, it is essential to first evaluate their quality, as has been done recently in different regions (Nkiaka et al., 2017; Albuquerque et al., 2018; Ghodichore et al., 2018; Wang et al., 2019). Some studies in Mexico have been done to assess the quality of satellite and NWP products such as Real-Rangel et al. (2017), who evaluated GLDAS-1, GLDAS-2, MERRA-2 precipitation estimates over Mexico against five climatological stations finding that MERRA-2 was the best fit followed by GLDAS-2 and GLDAS-1.
Some efforts have been done to estimate rainfall in Mexico using satellite platforms. One of the first products was developed by adapting Adler and Negri’s technique (1988) to develop the estimator known as EPPrePMex hydroestimator (Sánchez-Sesma and Sosa-Chiñas, 2007). This was the first real-time rainfall estimator calibrated for the Mexican territory. It showed an overestimation tendency, but the estimation was better for convective storms.
Yucel et al. (2009) used the NOAA/NESDIS hydroestimator to evaluate convective rainfall for northwest Mexico with observed surface rainfall data collected during the North American Monsoon Experiment for the years 2002 and 2003. Results, though encouraging, showed overestimation in the daily accumulations for both topography and no topography considerations, despite that rain gauges and the GOES imagery depicted the diurnal variation very well. Mendoza (2019) used the precipitation rate estimated directly from the GOES-16 and showed overestimation for most of the country. The method of precipitation rate estimation is the one proposed by Kuligowsky (2002), whose calibration depends on a low orbiting satellite SSM/I, and it can be adjusted nearly in real-time via linear regression. The GOES-16 algorithm for precipitation rate estimation also requires local adjustments because, as mentioned before, it depends on the SSM/I.
There are many studies on the quality of satellite-derived precipitation, like Perdigón-Morales et al. (2017), who analyzed duration and intensity of precipitation estimates from CHIRPS over the midsummer drought (MSD) in Mexico. Results indicated that CHIRPS provided a more detailed spatial representation than had ever been obtained before. Bruster-Flores et al. (2019) assessed the performance of the CMORPH product with corrected bias (CMORPH-CRT) in 14 sites in Mexico covering different climates and based on weather automatic stations. The evaluation was performed on two temporal scales, 30 min and daily based on two approaches: categorical metrics and statistical indicators. Results indicated that the CMORPH-CRT product overestimates the number of precipitation events in most cases showing weak to moderate correlations. Mayor et al. (2017) evaluated the precipitation product of the Integrated Multi-Satellite Retrievals for Global Precipitation Measurement (IMERG) over Mexico on hourly, daily and seasonal time scales for cumulative precipitation using 99 automatic meteorological stations and continuous and categorical statistics. The results indicate that hourly precipitation performance is quite poor with correlation values of 0.18, while a better performance was found at daily and seasonal time scales.
The present study evaluates the precipitation from two different reanalysis products (ERA5 and GLDAS), and two satellite-based precipitation products (TRMM 3B42 and CHIRPS) at storm-scale (1-10 km) over the La Sierra river basins located in southern Mexico, characterized by a high flood frequency occurrence and frequently hit by extreme meteorological events. The Sabancuy radar is available in the area; however, despite the advantages previously mentioned, two factors limit its use in the study area: it does not cover the area entirely, and the region contains a mountainous part.
The main difference between the previous studies in Mexico and this one is that previous analyses were developed at coarser scales considering selected stations over Mexican regions, or in the case of Mendoza (2019) over the Nayarit state, while the objective of the present study is to develop the analysis at a watershed scale. The use of these kinds of datasets is vital in areas where in-situ observations are scarce for calibration of hydrological models, which are implemented at the watershed scale. Additionally, the present study covers both, reanalysis and satellite-based precipitation products, and the evaluation is carried out based on statistical indicators and not categorical metrics on a daily time scale. This study will contribute to the evaluation of different precipitation datasets at a scale that is normally used to drive hydrological models, offering a contribution to the hydrometeorological community and hydrological model users.
This paper is organized as follows: section 2 describes the study area, sources of data and methodology used. Results and discussion are provided in section 3 and section 4 provides conclusion and future recommendation.
2. Data and methods
2.1 Study area
The area of interest is shown in Figure 1 where the red rectangle represents the domain of analysis, which encompasses La Sierra river basin and its contribution from Teapa river, from now on called La Sierra river basins, located between the states of Tabasco and Chiapas, Mexico. The domain area is 21 528 km2 while the basins of interest are 4573 km2 in total. La Sierra river is one of the three main rivers contributing to the Grijalva river flow, one of the largest rivers in Mexico which crosses the city of Villahermosa, Tabasco and drains into the Gulf of Mexico (GOM). This zone is characterized by a high flood frequency occurrence and it is frequently hit by extreme meteorological events.

Fig. 1 La Sierra river basins location and spatial distribution of weather stations over the study area.
The upper part of the study area, within the state of Chiapas, is shaped by mountainous regions that comprise the Sierra de Chiapas, with elevations around 4000 masl. These mountains intercept the moisture carried by winds from the GOM, which favors a humid climate with rains all year-round. In contrast, plains dominate the lower part of the state of Tabasco, as part of the coastal plain of the southern GOM with elevations of a few dozen masl (CONAGUA, 2013, 2015) (Fig. 1).
Precipitation is analyzed from 2008 to 2010. This period encompasses important meteorological events such as tropical cyclones Karl and Matthew, along with the presence of the Intertropical Convergence Zone in the higher Grijalva River basin during 40 days in 2010, with an accumulated precipitation of 1572 mm in such period (Arreguín-Cortés et al., 2014). Such intense precipitation event caused flood danger in the city of Villahermosa and important floods in the floodplain.
The number labels shown in Figure 1 are intended to identify each of the basins within the study area and facilitate the interpretation of results in the following sections. Each basin corresponds to the catchment area of the hydrometric stations shown in Table I. Note that there are zones with no rain gauges, which could affect the results when estimating mean areal precipitation (gauge interpolated).
2.2 Data sources
This subsection describes the data sources used and their general characteristics. Global free sources of information, like reanalysis or satellite data, are used in Mexico to derive adequate hydroclimatic variables needed in the simulation of hydrological processes and water balance studies (Real-Rangel et al., 2017). This kind of data is important in Mexico and other developing countries where in-situ observations are scarce.
2.2.1 In-situ observations
The National Weather Service of Mexico (SMN, by its Spanish acronym) oversees the gathering, concentrating, reviewing and disseminating of climate information using the CLICOM (computerized climate) computer system developed by the World Meteorological Organization (WMO) in the mid-1980s. This database contains data from more than 5000 stations distributed throughout the country. It offers daily data, reported every 24 h at 8:00 LT for the precipitation, evaporation and maximum and minimum temperature for each location (https://smn.conagua.gob.mx/). Regarding precipitation, the measurements are done by means of tipping bucket gauges and the SMN performs a first quality control over the data identifying missing values, reviewed, corrected and doubtful data.
The in-situ precipitation data used in this study is taken from this database. The information can be downloaded from the SMN portal (https://smn.conagua.gob.mx/es/climatologia/informacion-climatologica/informacion-estadistica-climatologica) for short periods of time, while requests of longer periods need to be solicited directly to the SMN. After an exploratory data analysis, it was concluded that for the analysis period, 32 climatological stations within the study area were acceptable based on continuity and statistical dispersion of the data. Their locations are shown in Figure 1.
It is important to note that since the SMN is the main source of land climatological data in Mexico, a number of the datasets used in this study might have incorporated some of this data in the bias correction of their precipitation estimation, as it will be mentioned in the following sections.
2.2.2.1 GLDAS
GLDAS is a global, high-resolution, offline (uncoupled to the atmosphere) terrestrial modeling system that incorporates satellite and ground-based observations, using land surface modeling and data assimilation techniques, to produce optimal fields of land surface states and fluxes in near-real time (Rodell et al., 2004).
GLDAS offers land surface model simulations of Noah (Ek et al., 2003), Common Land Model (CLM; Dai et al., 2003), Variable Infiltration Capacity Model (VIC; Liang et al., 1994) and Mosaic (Koster and Suárez, 1996) available in a 3-h temporal resolution, 1º and 0.25º spatial resolution from 1979 to present. For the present study, the 0.25º resolution V2.1 data was used on the analysis period of 2008 to 2010, which is available at https://disc.gsfc.nasa.gov/datasets/GLDAS_NOAH025_3H_V2.1/summary?keywords=GLDAS_VIC10_3H.
Previous studies have analyzed the performance of this dataset, such as Real-Rangel et al. (2017), who evaluated precipitation and streamflow variables on GLDAS v. 1 and 2 and MERRA-2 over Mexico, assessing absolute values and its variability. The results on precipitation values considering five climatological stations, showed that MERRA-2 was the best fit with ground observations closely followed by GLDAS-2, whereas GLDAS-1 values were not acceptable. All the products showed poorer performance in reproducing precipitation variability than absolute magnitude. In particular, the results suggest that mid to long-term variability are reproduced better than short-term fluctuations (one month).
2.2.2.2 ERA5
ERA5 is the latest atmosphere, ocean waves and land reanalysis of the meteorological reanalysis project European Centre for Medium-Range Weather Forecasts (ECMWF). It replaces the ERA-Interim reanalysis that was started in 2006 (spanning 1979 onwards) and encompasses the period covered by ERA-40. ERA5 is based on 4D-Var data assimilation using Cycle 41r2 of the ECMWF’s Integrated Forecasting System (IFS) (Hersbach et al., 2018). This dataset provides hourly output for its variables and three-hourly output for its uncertainty estimations. It covers the Earth on a 30 km grid resolution and uses 137 levels from surface up to a height of 80 km. The ERA5 hourly data on single levels from 2008 to 2010 are used in this study, which is available at Copernicus Climate Change Service Climate Data Store (CDS) https://cds.climate.copernicus.eu/cdsapp#!/home.
2.2.3.1 TRMM 3B42
The Tropical Rainfall Measuring Mission (TRMM) is a joint mission between NASA and the Japan Aerospace Exploration Agency (JAXA) to study rainfall for weather and climate research. It was launched in November 1997 and ended collecting data on April 15, 2015.
The TRMM 3B42 product v. 7 combines precipitation of four passive microwave (PMW) sensors, namely TRMM Microwave Imager (TMI); Special Sensor Microwave/Imager (SSM/I) F13, F14, and F15; Advanced Microwave Scanning Radiometer-EOS (AMSR-E); and Advanced Microwave Sounding Unit-B (AMSU-B). These data are merged to produce a combined satellite rainfall estimate every 3 h, which is then summed to a monthly scale to be recalibrated using monthly precipitation gauge analysis. These two merged products, satellite rainfall estimates (S) and gauge data (G), provide the final three-hourly 0.25º × 0.25º quasi-global (50º N-S) gridded SG-rainfall database (Huffman et al., 2007; MacRitchie, 2017). The data used in this study was obtained from the Greenbelt, MD, Goddard Earth Sciences Data and Information Services Center (GES DISC) (https://doi.org/10.5067/TRMM/TMPA/3H/7).
Some studies have been done in Mexico using this dataset. Aurea et al. (2016) evaluated the standardized precipitation index (SPI) during the period of 1998 to 2013 using the TRMM 3B42 product and compared it against the rain gauge-based SPI getting low to medium correlations but still being able to capture the most relevant droughts at national scale. Gochis et al. (2009) assessed the performance of five remotely sensed precipitation products in their ability to represent the statistical characteristics of the North American Monsoon (NAM) over northwest Mexico and southwest US during 2004. Additionally, a comparison between operationally gauge-corrected (TRMM 3B42) and uncorrected (TMPA real time product, TRMM_RT) quantitative precipitation estimates (QPE) products was also made, resulting on TRMM 3B42 modestly having superior skill scores and the lowest false alarm ratios compared with the other non-corrected products.
2.2.3.2 CHIRPS
The CHIRPS quasi-global (50º S-50º N) dataset was developed to support the United States Agency for International Development Famine Early Warning Systems Network (FEWS-NET) (Funk et al., 2015). CHIRPS uses the Tropical Rainfall Measuring Mission Multi-satellite Precipitation Analysis version 7 (TMPA 3B42 v7) to calibrate global cold cloud duration (CCD) rainfall estimates. The station data incorporation is done in two phases. The first one yields a 2-day latency preliminary rainfall product by merging sparse World Meteorological Organization’s Global Telecommunication System (GTS) gauge data and data from stations in Mexico with CCD-derived rainfall estimates at every pentad. In the second phase, the best available monthly (and pentadal) station data are combined with monthly (and pentadal) high-resolution CCD-based rainfall estimates to produce the final product with a ~3-week latency. The final product yields into a high resolution (0.05º), daily, pentadal, and monthly precipitation dataset available at ftp://ftp.chg.ucsb.edu/pub/org/chg/products/CHIRPS-2.0/
Perdigón-Morales et al. (2017) evaluated the performance of this product in estimating the duration and intensity of the MSD in Mexico for the 1981-2010 period. As a result, CHIRPS provided a more detailed spatial representation of the MSD than had been obtained before. Therefore, CHIRPS data, interpolated to the geographical points of the SMN climatological stations, is acceptable in reproducing the climatological values of the monthly precipitation accumulations in Mexico. Table II shows a summary of characteristics for each one of the products used in this study.
2.3 Evaluation methodology
Since in-situ precipitation observations are only available daily, the evaluation in this study is performed on a daily time scale. Therefore, the sub-daily products were aggregated in a daily time scale. Four main steps were followed to compare the reanalysis and satellite precipitation products against in-situ rain gauge measurements:
Step 1. All gridded datasets were re-gridded to a 1- km2 resolution using bilinear interpolation through NCAR command language (NCL) scripts that utilize the Earth System Modeling Framework (ESMF) re-gridding functions. The 1- km2 grid is the spatial grid used in the hydrological model domain. This resolution was chosen because it is the minimum resolution necessary to represent adequately the topographic features of the study region and is widely used in other hydrologic studies, for example in the operational U.S. National Water Model (https://water.noaa.gov/about/nwm).
Step 2. In-situ rainfall measurements are available at a daily time scale, reporting at 8:00 LT. Therefore, all other sub-daily products were accumulated from 9:00 LT on that day to 8:00 LT on the following day to calculate daily rainfall.
Step 3. Two main approaches were used to compare precipitation estimates against in-situ observations: (1) point to grid comparison of the in-situ observed rainfall against the precipitation estimates from the collocated 1- km2 pixel; and (2) a comparison of the mean areal precipitation (MAP) values of the gridded precipitation against the MAP values of the in-situ observations over the watersheds. For the gridded products, MAP is the spatially averaged precipitation over each watershed numbered in Figure 1, considering the pixels within each of them. For the in-situ precipitation observation, MAP values are calculated using Thiessen polygons. This method is commonly used in hydrology to assign an influence area to each ground gauge location by bisecting lines connecting the gauges, thus forming polygons to estimate average precipitation in a basin (Raudkivi, 1979).
Step 4. Four different metrics were used to evaluate the agreement between estimated and observed precipitation values: Pearson correlation coefficient (Eq. 1), mean values for each station over all days, multiplicative bias (Eq. 2), and root mean square error (RMSE) (Eq. 3). To evaluate the performance of each dataset for events with different magnitudes these metrics were calculated for the following thresholds: 0-10, 10-50, 50-100, and above 100 mm, as well as for all the precipitation values (unconditional statistics). These thresholds were selected based on the potential damage degree that can be produced: minimum, low, high, and very high.
The Pearson correlation coefficient (r xy ) is the ratio between the sample covariance S xy and the product of the standard deviations from the observed and estimated values, S x and S y , respectively, for each station over all days (Eq. [1]), where the superscript j indicates the j th station and n is the total number of precipitation data pairs for that station.
The correlation coefficient allows to measure the association between two variables, in this case the daily observed and estimated precipitation. It can take a range of values from -1 to +1, where ±1 indicates a perfect correlation between the two variables. A value greater than zero indicates a positive association, less than zero a negative association and equal to zero, no association.
The multiplicative bias (MultiBias) is the ratio between the mean of the precipitation estimate (F i j ) for each station over all days to the corresponding mean of the observed precipitation (O i j ). It is represented by Eq. (2), where the superscript j indicates the j th station and N the total number of days of precipitation. Therefore, a value higher than 1 means the model is overestimating the precipitation, while values bellow 1 indicate precipitation underestimation.
The root mean square error (RMSE) is the square root of the square differences between the estimated and observed precipitation for each station over all days. The perfect score is zero.
3. Results
The comparison of different rainfall products versus the in-situ measurements are provided in this section. As mentioned in section 2.3, all products were re-gridded to 1-km grids for the use in the hydrological model, and all the metrics are calculated based on the re-gridded data. Figure 2 shows the mean annual precipitation over the analysis period for each dataset in their native spatial resolution (Table II). There is a reasonable agreement between the spatial pattern of CHIRPS and ERA5. However, there is not much spatial variability in GLDAS and TRMM, and GLDAS seems pretty uniform in space. In terms of the overall precipitation intensity, CHIRPS, ERA5 and GLDAS are on the same order, while TRMM has significantly lower values compared to the other three products. The colored dots in Figure 2 show the in-situ mean annual precipitation intensity at the meteorological stations. Note from this plot that TRMM has significantly lower values in most of the domain compared to the mean annual observed rainfall over the study period. Also, GLDAS does not have the required spatial variability, and the estimated rainfall is almost uniform everywhere; therefore, the measured rainfall is overestimated at some locations while underestimated at others.

Fig. 2 Mean annual precipitation for each dataset over the study area during the analysis period on its native grid resolutions.
3.1 Point to grid comparison
Figure 3 shows a heat map of the estimated daily rainfall from CHIRPS, ERA5, GLDAS and TRMM 3B42 vs. the observed daily rainfall at 32 meteorological stations. Each point corresponds to the precipitation registered in one day during the analysis period for each station within the domain, therefore, all the values registered for each station are plotted for each dataset, including days where the registered precipitation was zero. It also shows that TRMM 3B42 and GLDAS have a negative bias, which means that they tend to underestimate the precipitation values. ERA5 shows a slightly better performance. It does underestimate the intense precipitation events, but the degree of underestimation is lower than that of TRMM 3B42 and GLDAS. CHIRPS shows the best behavior of the compared datasets and less systematic underestimation. However, it has a large data scatter and a tendency to overestimate small rainfall events.
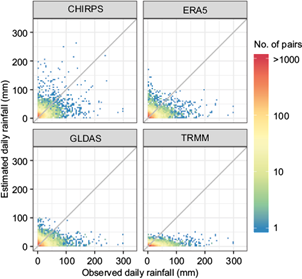
Fig. 3 Heat map of estimated precipitation for each dataset against the observed rainfall. Color represent the number of pairs in a given bin.
Figure 4 shows the mean daily precipitation estimates for each rainfall product over all the analysis period against the mean observed rainfall at the gauge location for each station. Points around the 1:1 line indicate agreement between the mean of the precipitation estimate at the gauge locations with observation. Again, CHIRPS estimates show the best behavior, followed by ERA5. In the case of GLDAS, it is producing the same amount of rainfall on most of the gauges, as expected given the uniformity of GLDAS that was shown in Figure 2 over the region of study. GLDAS overestimates for low rainfall amounts and underestimates for high mean rainfall values. The mean of the precipitation at all the gauges were underestimated by TRMM indicating that this product has high negative biases in the precipitation and will not be a very useful dataset when the total volume of the water on a watershed is of importance.

The point to grid comparison was also evaluated through statistics summarized in box-plot diagrams. Figure 5 shows mean estimated precipitation at the station locations, Pearson correlation coefficient, RMSE and multiplicative bias calculated based on the estimated rainfall for each dataset against the observed rainfall for all stations within the study area.

The closest median of the mean precipitation is estimated by CHIRPS, followed by ERA5 and GLDAS, both overestimating its value, while TRMM 3B42 tends to underestimate it. CHIRPS has a more disperse distribution, positively skewed, that is the closest to the distribution in the observed values. On the other hand, even if it tends to slightly overestimate the median, ERA5 has less variability showing a tighter distribution and less skewed in comparison with CHIRPS and the observed values.
CHIRPS is the least biased dataset in terms of multiplicative bias, with a median close to 1, which indicates that the mean of the observed and estimated precipitation are very close to each other, and it also shows a very tight distribution. On the other hand, close to 50% of the values in both ERA5 and GLDAS datasets are above 1, indicating they tend to overestimate and underestimate precipitation in almost the same amount. According to the previous results, they tend to underestimate high precipitation values and overestimate the low ones. On the other hand, TRMM 3B42 consistently underestimates it in all cases.
CHIRPS has the highest median of the Pearson correlation coefficient showing a tight distribution of correlations. It is followed by ERA5 with around 12% of the correlation values above the ones obtained by CHIRPS and TRMM 3B42. GLDAS and TRMM 3B42 have a median value close to the one obtained by ERA5; however, GLDAS has a very tight distribution with correlation values not as high as the rest of the datasets and TRMM 3B42 has the highest dispersion in comparison to the rest of the datasets.
Finally, according to the RMSE the median value is almost the same for all the datasets; however, ERA5 has the tighter distribution with the lowest RMSE values. This is followed by CHIRPS which has around 25% values lower than the ones obtained by ERA5 but with a more disperse distribution positively skewed. On the other hand, GLDAS and TRMM 3B42 have a disperse distribution in comparison to ERA5 with high RMSE values including the outliers.
Conditional statistics for precipitation in different threshold values are shown in Figure 6. Multiplicative bias is larger than 1 for precipitation events in the range of 0-10 mm for all the datasets except TRMM 3B42 and smaller than 1 for the rest of the precipitation ranges, which means that low precipitation values are overestimated by all the datasets except TRMM 3B42 and high precipitation values tend to be underestimated by all the datasets.

Fig. 6 Conditional multiplicative bias, Pearson correlation coefficient, RMSE and on point to grid comparison.
The correlation coefficient values diminish as the rainfall depth increases and turn to negative correlation at many stations for rainfall values greater than 100 mm. Regarding the Pearson correlation coefficient, ERA5 has the highest value for events in the ranges of 0-10 mm and of 50-100 mm, while CHIRPS has higher correlations than ERA5 in ranges of 10-50 mm, above 100 mm, and for all the precipitation events. These two datasets have higher correlation values followed by GLDAS. All datasets show a broad distribution of correlation values for precipitation events above 100 mm, highlighting the large variability on the estimates of high precipitation events.
Finally, the RMSE values show errors in all datasets are greater for larger precipitation values which is expected since RMSE is dependent on the precipitation values. TRMM 3B42 has the smallest RMSE value for low precipitation events in a range of 0-10 mm, followed by CHIRPS, ERA5 and GLDAS. On the other hand, GLDAS has the lowest errors for events between 10-50 mm but it is closely followed by ERA5 and CHIRPS. CHIRPS has slightly lower errors on higher events in the ranges 50-100 mm and above 100 mm.
3.2 Mean areal precipitation
Accuracy of the total rainfall over the watershed area is an important factor in hydrological modeling. If precipitation was misplaced in the point to grid analysis, then the errors would be larger and that is why some studies use a neighborhood approach when verifying the precipitation estimates and forecasts (Schwartz, 2016). We acknowledge that the spatial rainfall pattern will play an important role in the streamflow timing; however, the bias in the streamflow is more dependent on the accuracy of the mean areal precipitation over the watershed than on the spatial pattern. Therefore, we compared the estimated and observed mean areal precipitation over the four watersheds in the study area. The same metric as the point to grid comparison is used here. The distribution of the daily mean areal precipitation for each dataset and watershed is shown in Figure 7 through scatter plots, while the obtained metrics are summarized in Table III.

Fig. 7 Scatter plot of mean areal estimated and mean observed precipitation for each dataset. The number labels represent each basin in the study area.
Table III Mean areal precipitation statistics for each basin and dataset (the best metric value is indicated in gray).
| Basin | Mean observed (mm) | Source | Mean model (mm) | Pearson correlation | RMSE (mm) | MultiBias |
| 1 | 5.922 | CHIRPS | 7.059 | 0.391 | 14.548 | 1.192 |
| ERA5 | 5.377 | 0.476 | 9.378 | 0.908 | ||
| GLDAS | 6.092 | 0.397 | 10.514 | 1.029 | ||
| TRMM | 2.201 | 0.396 | 9.255 | 0.373 | ||
| 2 | 9.115 | CHIRPS | 7.993 | 0.511 | 18.374 | 0.877 |
| ERA5 | 7.459 | 0.633 | 15.268 | 0.818 | ||
| GLDAS | 6.241 | 0.333 | 19.014 | 0.685 | ||
| TRMM | 2.191 | 0.559 | 18.827 | 0.240 | ||
| 3 | 9.383 | CHIRPS | 7.256 | 0.516 | 18.869 | 0.773 |
| ERA5 | 7.962 | 0.531 | 18.285 | 0.849 | ||
| GLDAS | 6.207 | 0.327 | 20.728 | 0.662 | ||
| TRMM | 2.026 | 0.462 | 21.237 | 0.216 | ||
| 4 | 8.044 | CHIRPS | 6.418 | 0.621 | 11.731 | 0.798 |
| ERA5 | 6.520 | 0.595 | 11.761 | 0.810 | ||
| GLDAS | 6.031 | 0.408 | 13.708 | 0.750 | ||
| TRMM | 1.890 | 0.527 | 14.252 | 0.236 |
RMSE: root mean square error.
Results of Table III indicate that in basin number 1, the mean of the daily MAP obtained is better represented by GLDAS; however, ERA5 has the highest correlations. The rest of the datasets show very close correlation coefficients while TRMM 3B42 has the lowest RMSE. As it is shown in the scatter plots, CHIRPS is the dataset with the lowest dispersion; however, it tends to overestimate zones with low rainfall in high amounts. In contrast, ERA5 tends to do the opposite in a few zones with high rainfall. Based on the mean annual precipitation shown in Figure 2, rainfall in basin 1 had the lowest precipitation amounts and least variability in comparison with the rest of the basins; therefore, GLDAS and TRMM 3B42 show medium performances. Overall, ERA5 and GLDAS show the best performances.
On the other hand, ERA5 has the best performance for basins 2 and 3 according to the correlation, RMSE and mean values, with the exception that mean values are better represented by CHIRPS over basin 2. The last can be seen also in the scatter plots where ERA5 shows the more consistent distribution and less scattered.
It is CHIRPS in the case of basin 4 which has the best performance in comparison with the rest of the datasets based on the statistics and the scatter plots. According to the analyses done, ERA5 and CHIRPS are superior in representing the spatial rainfall variability for basins 2 to 4.
3.3 Discussion
The results presented indicate that the overall performance of the analyzed datasets is in the following decreasing order: CHIRPS, ERA5, GLDAS, and TRMM 3B42, with similar performances between ERA5 and CHIRPS.
The poor performance of TRMM 3B42 stands out compared to the rest of the products, especially compared to CHIRPS since both are satellite-based precipitation products. Bharti and Singh (2015) found that the TRMM precipitation product overestimates precipitation at elevations in ranges less than 3000 masl but severely underestimates it at higher elevations in the Himalaya region. Similar results were found by Ávila-Carrasco et al. (2018), who evaluated the TRMM 3B43V7 product on the Santiago River basin in Mexico for the 1998-2010 period through its comparison to a gridded precipitation database constructed from interpolation of 85 rain gauges using kriging. They found that the TRMM 3B43V7 product tends to underestimate precipitation in the coastal and mountainous regions and tends to overestimate it in the driest parts of the study area. Similarly, our results suggest that the poor performance of TRMM 3B42 could be due to the orographic complexities of the study area, since the upper part of the basin is predominantly mountainous while plains are more common on the lower part. Also, the quality and quantity of in-situ observations used for bias correction may have a role in the performance of TRMM 3B42.
Another source of bias originates from the type of typical clouds that vary in space. Precipitation produced by shallow orographic systems can be underestimated by microwave radiometer algorithms (Shige et al., 2013; Mayor et al., 2017). The better performance of CHIRPS against TRMM 3B42 could be the result of two main differences between the two products. First, CHIRPS is based on TRMM 3B42 to calibrate global CCD rainfall estimates considering information from multiple agencies including data from stations in Mexico, Central, and South America (see section 2.2.5). And second, despite having a coarser temporal resolution than the rest of the products, it has the highest spatial resolution, allowing for a better spatial representation of phenomena at higher scales.
ERA5 also shows a reasonable performance comparable to CHIRPS. ERA5 is a new product (2016) that replaces ERA-Interim and benefits from a decade of developments in model physics, core dynamics, and data assimilation techniques (4D-Var as mentioned in section 2.2.3), assimilating around 24 millions of observations per day including satellite-radiances and ground-based radar observations (Hersbach et al., 2018). The temporal resolution also plays an essential role in performance, as shown in Table III. ERA5’s hourly temporal resolution is an advantage over the rest of the datasets, since it allows a much-refined view of the evolution of weather systems and could particularly play an important role during intense flash flooding events which last on the order of hours or less. GLDAS showed a poor performance compared to ERA5 and CHIRPS; an important characteristic that might play a role in the results is that it does not model atmospheric fields explicitly, hence it does not represent the physics behind precipitation processes, but instead relies on land surface models forced by observation-based meteorological fields using data assimilation techniques to incorporate observations of land surface states to curb unrealistic model states (Rodell et al., 2004). Therefore, its performance is related to the observations used for bias correction and could result in poor estimates in the case of low-quality observational data
The uneven gauge distribution might have also caused a possible distortion of the results due to a misrepresentation of the MAP on the true precipitation field.
4. Conclusions
The objective of this study was to evaluate reanalysis and satellite-based precipitation at a regional scale over the La Sierra river basins located in southern Mexico. The analyzed products were GLDAS, ERA5, TRMM 3B42, and CHIRPS over a 3-year period from 2008 to 2010, comparing in-situ observed rainfall vs. precipitation estimated by each product. The comparisons were done on point to grid comparison of the in-situ observed rainfall against the precipitation estimates from the collocated 1-km pixel and a comparison of the MAP values of the gridded precipitation against the MAP values of the in-situ observations.
The relevant findings for the study area were:
According to the point to grid comparison, CHIRPS showed the best performance among the four products in representing the mean daily values over the analysis period and the best non-conditional statistics, showing the highest correlation, lowest RMSE and multiplicative bias values, closely followed by ERA5.
GLDAS and TRMM 3B42 tend to underestimate daily precipitation values.
According to the conditioned statistics, all the datasets show a broad spectrum of correlation values for precipitation events above 100 mm, highlighting the large variability in estimates of high precipitation events.
All the products are highly biased on low precipitation events, which means that all the datasets tend to overestimate low precipitation events (except TRMM 3B42), and they tend to underestimate high precipitation events.
ERA5 has the highest correlation values for events in the ranges of 0-10 mm and 50-100 mm, while CHIRPS has higher correlations than ERA5 in ranges of 10-50 mm, above 100 mm, and for all the precipitation events without condition. These two datasets are followed by GLDAS.
ERA5 and CHIRPS are the datasets with the best capability to represent the spatial rainfall variability according to the mean annual precipitation and mean areal precipitation analysis over the study area.
We conclude that CHIRPS is a convenient product if the application requires only precipitation data, whereas ERA5 is appropriate when other atmospheric variables are required, for instance if the dataset is used to force hydrological models.
It is important to highlight that the results are particular to the current analysis and study area, and considering the limited number of products explored, other datasets might show better results. Lastly, the methodology shown in this study could lay the foundation for an analysis of different atmospheric regimes in the future.

