


 nueva página del texto (beta)
 Inglés (pdf)
 Artículo en XML
 Referencias del artículo
 Enviar artículo por email
 Citado por SciELO
  Similares en
SciELO
Similares en
SciELO 
 Permalink
1. Introduction
Various atmospheric components attenuate the intensity of extra-terrestrial radiation emissions from the Sun by scattering or absorbing them as they arrive at the top of the Earth’s atmosphere and propagate through the atmosphere to the surface. These components include gas molecules (ozone, oxygen, carbon dioxide and water vapor), suspended particulates like aerosols, soot, pollen, haze and smoke, and the reflectivity of clouds (Wallace and Hobbs, 2006; Soneye, 2018). The fraction of the extra-terrestrial radiation that finally gets to the Earth’s surface is known as global solar radiation. It makes up the net radiation along with what is called diffuse solar radiation, which is another kind of radiative flux that is produced as incoming solar radiation emissions from the Sun are scattered and reflected in the atmosphere (Babatunde and Aro, 1995; Aruna and Janarthanan, 2014).
The global solar radiation received at any location on Earth can be determined by quantifying meteorological parameters such as the clearness index, cloudiness index, diffuse coefficient and relative sunshine duration hour (Ideriah and Suleman, 1989; Muneer, 1995; Udo, 2000; Li et al., 2004). The clearness index is the ratio of the measured global solar radiation at the Earth’s surface to the extra-terrestrial solar radiation at the top of the atmosphere, while the cloudiness index is the ratio of the diffuse solar radiation to the global solar radiation at the Earth’s surface. The clearness index describes the attenuation of extra-terrestrial solar radiation by atmospheric components like clouds and aerosols, and thereby measures how transparent the Earth’s atmosphere is to solar radiation (Liu and Jordan, 1960; Kuye and Jagtap, 1992; Akhlaque et al., 2009; Augustine and Nnabuchi, 2009; Okogbue et al., 2009; Poudyal et al., 2012). It furthermore determines variations in atmospheric conditions and the availability of solar radiation at any location, theoretically taking its values from an interval of 0 to 1; however, it usually varies from about 0.8 in clear sky conditions to near 0 in cloudy conditions. The values of the cloudiness index are almost inverses of those of the clearness index, with low values indicating cloudiness while high values indicate clear sky conditions. The cloudiness index also takes its values from an interval of 0 to 1, and is usually increased by turbidity, geographical location, reflection coefficient (surface albedo) and relative humidity. It describes the effectiveness of the atmosphere to scatter global solar radiation (Iziomon and Aro, 1998). In terms of the classification of sky conditions, these ratios (clearness and cloudiness index) are widely used due to their dependency on global solar radiation (Muneer, 1995; Li et al., 2004).
Knowing the daily values of the clearness and cloudiness indices is crucial to evaluate the climatological potential of a particular area for its possible exploitation and the utilization of solar energy. Also, information on these ratios is of great importance for the design, construction, development and estimation of the expected values of the output of flat plate collectors, photovoltaic systems and other thermal devices that depend on solar energy (Iqbal, 1983; Iziomon and Aro, 1998; Udo, 2000; Ali et al., 2003; Duffie and Beckman, 2006; Aruna and Janarthanan, 2014). Increased understanding of the potential of certain areas for the use of solar energy through the investigation of global solar radiation, clearness and cloudiness indices is especially relevant for locations in Nigeria and other developing countries that are energy poor (Chidebell-Emordi, 2015).
Since Liu and Jordan (1960) examined the clearness and cloudiness indices for 27 locations around the world with a near five-year dataset, many researchers (Iqbal, 1978; Barbaro et al., 1981; Vignola and McDaniels, 1984; Akuffo and Brew-Hammond, 1993; Babatunde and Aro, 1995; Iziomon and Aro, 1998; Udo, 2000; Babatunde, 2005; Augustine and Nnabuchi, 2009; Okogbue et al., 2009; Falayi and Rabiu, 2011; Jung et al., 2016; Rama et al., 2016) have used these indices to investigate atmospheric conditions in various locations. The results of these works have questioned some of the assumptions of Liu and Jordan (1960) and have shown their models to have limited applicability, especially in the tropical areas.
Liu and Jordan (1960) showed that monthly values of the cloudiness index are a function of the monthly global atmospheric transmissivity. They further concluded that the monthly mean of the clearness index is practically independent of the month and location. However, subsequent works have shown that the behavior of the cloudiness index is not singularly dependent on the clearness index, since the values obtained for the clearness index from the addition of the values of suspended atmospheric aerosol particles, air mass, surface reflection coefficient (albedo) and cloudiness may not necessarily result in distinct values for the cloudiness index. Secondly, the studies have further shown that assumptions of Liu and Jordan (1960) (namely, that the relationship between the ratios is independent of clouds and that the variation of the clearness index depend mainly on cloudiness) can barely be applied to tropical areas.
Therefore, various empirical models that can be used for determining hourly, daily and monthly values of the ratios have been formulated over the years by different researchers, with the main purpose of developing models with widespread applicability. These models vary and cannot be readily applied to all areas for issues that include variations in equipment calibration, differences in the spatial and temporal averaging of data and variations in atmospheric conditions and climatological patterns (Iziomon and Aro, 1998; Aruna and Janarthanan, 2014). Both the Hollands and Huget (1983) and the Saunier et al. (1987) models have been used to examine the clearness index and atmospheric conditions of tropical areas like Ibadan and Ilorin in Nigeria and Kumasi in Ghana. This paper focuses on evaluating and validating the models for another area of Nigeria with the objective of increasing the knowledge of the wider applicability of the two models to investigate atmospheric conditions in tropical areas.
This study determines the daily, monthly and annual variations of the clearness index and the cloudiness index at Ile-Ife, Nigeria. It examines the relationship between the values for the indices in the area and evaluates and validates the Hollands and Huget (1983) and Saunier et al. (1987) models. Additionally, it develops empirical equations that can be used for estimating the maximum clearness index in terms of the average clearness index and the cloudiness index in terms of the clearness index at other locations where only the global solar radiation flux is measured.
2. Methodology
The global solar radiation two-year dataset (January 2016-December 2017) used in this study to estimate the daily average of clearness and cloudiness indices was obtained from a meteorological station located in the Teaching and Research Farm, Obafemi Awolowo University, Ile-Ife, Nigeria. The measurements of global solar radiation were made with a pyranometer (type SR01, ISO-class) facing upward, contained in a four-component net radiometer (model NR01, Hukseflux, USA) sensor, and a datalogger and storage module data acquisition system (model CR1000, Campbell Scientific, USA). Detailed description of the instrumentation and measurement site where the dataset used in this study were acquired can be found in Soneye et al. (2019). The dataset was divided into two annual sets. The daily values of the clearness index for the study site were calculated using:
where S↓ is the measured global solar radiation and S 0 is the daily extra-terrestrial solar radiation at the top of the atmosphere calculated using the following mathematical expression (Iqbal, 1983; Duffie and Beckham, 2006):
where G 0 is the solar constant = 1367 Wm-2, E 0 is the eccentricity correction factor of the Earth’s orbit, ϕ is the latitude (positive north), ω s is the sunrise hour angle, δ is the solar declination angle and π = 3.142. The units of ϕ, and δ are degrees.
The solar declination angle was determined using the equation developed by Cooper (1969):
where ϕ L is the latitude of the Tropic of Cancer (23.45º N), d n is the Julian day number of the year (DOY), which ranges from 1 on 1 January to 365 on 31 December, d r = 284, and d y is the average number of days per year with a value of 365.
The eccentricity correction factor was calculated using Spencer (1971) and Iqbal (1983):
where Г (unit in radians) is the day angle and can be expressed as:
The sunrise hour angle was evaluated using:
The day length hour was estimated using:
The daily values of the cloudiness index for the study site were calculated using (8) when ω s > 81.4º and 0.3 ≤ C tAVG ≤ 0.8 (Duffie and Beckham, 2006):
where Sd is the diffuse solar radiation and C tAVG is the averaged value of the cleanness index.
The empirical models proposed by Hollands and Huget (1983) (9) and Saunier et al. (1987) (10) relating the maximum values of the clearness index (C tMAX ) with the averaged values of this index, were evaluated using the statistical criteria listed in Table I.
Table I Statistical criteria for evaluating the performances of the empirical models.
| Statistical Indicator | Symbols | Expression |
| Correlation Coefficient | R |
|
| Mean Bias Error | MBE |
|
| Root Mean Square Error | RMSE |
|
| Relative Root Mean Square Error | RRMSE |
|
| Index of agreement* | IA |
|
E: estimated flux; M: measured flux; : mean of the measured flux; N: number of observations.
*The index of agreement is a descriptive, bounded and relative tool used for cross-comparison between empirical models. It can be defined as the ratio of the mean square error and the potential error multiplied by the number of observations, and then subtracted from one (Willmott, 1982). The value of the index of agreement varies between 0 and 1, with higher index values indicating better agreement between the estimated and the measured values.
The models were estimated using the dataset from January to December 2016 while the estimated equations were validated using the dataset from January to December 2017. The calibration was made using the coefficients of the intercept a (the x-value or y-value of the point where a line crosses the x-axis or y-axis, respectively) and slope b (a measure of the steepness of a line), obtained from the linear regression analysis between the measured and estimated values according to Ghamarnia et al. (2012), as expressed in (11):
Furthermore, two equations for estimating the cloudiness index were developed using the relationship between the clearness and cloudiness indices by carrying out linear and polynomial regressions between the daily averages of both indices for 2016. The developed linear and polynomial equations were tested using the dataset from January to December 2017.
3. Results and discussion
3.1 Daily variation of the clearness and cloudiness indices
The variations in the daily averages of the clearness index for the two-year period (2016-2017) are presented in Figure 1, while Figure 2 shows the same information for the cloudiness index. Figure 1 shows that variations in the clearness index during the two years are bimodal and less pronounced in the dry months (November-February) when compared to the transition months on the dry to wet season (March and April) and to wet months (May-October). As shown in the both figures, the values of the clearness index in 2016 ranged between 0.33 and 0.62 in the dry months while the values in the transition and wet months vary between 0.21-0.63 and 0.13-0.64, respectively. For 2017, the values ranged from 0.16-0.63, 0.23-0.61 and 0.10-0.61 for the dry, transition and wet months, respectively. The average value for 2016 is 0.44, while it is slightly lower for 2017 (0.42). The highest value (0.64) was recorded on DOY 137 in 2016. Also, higher values for the clearness index were recorded on some days during the wet and cloudy months, corresponding to values observed in the dry months and clear sky days. This is due to rainfall’s removal and washout of dust aerosol particles suspended in the atmosphere, which consequently led to lower cloudiness in the atmosphere (Udo, 2000).


Fig. 2 Daily variation of the cloudiness index for January-December 2016 and January-December 2017 at Ile-Ife, Nigeria.
The occurrence of very clear skies with C t ≥ 0.65 is rare in the study area. As presented in Table II, only 13 days with C t ≥ 0.60 were found in the observation period (2016-2017). Of these, seven occurred in the dry months while six were observed in the wet months. As Table III shows, cloudy skies with 0.12 < C t ≤ 0.34 are more pronounced, particularly in the wet months (with total number of seven days in the dry months and 156 days in the wet months). Due to the removal of harmattan dust aerosol particles from the atmosphere by wet deposition processes in May, and the presence of few or no clouds and harmattan dust in November (a transition month from wet to dry months), a high occurrence of days with C t ≥ 0.60 was found during May and November 2016, and November 2017. The high occurrence of days with 0.12 < C t ≤ 0.34 during the wet months (June-September) of both years is as a result of the increase in the amount of clouds, rainfall and atmospheric water content, all of which attenuated the global solar radiation (Ayoola et al., 2014; Soneye et al., 2019). The minimum values of the clearness index for the study area was observed to be between 0.10 and 0.28, which are above the minimum value of 0.05 stipulated for this parameter in cloudy conditions. This result suggests that sky conditions in Ile-Ife are barely cloudy despite the prevalence of harmattan dust and cloudiness in the atmosphere. The results are similar to the findings of Ideriah and Suleman (1989) at Ibadan, Nigeria, Akuffo and Brew-Hammond (1993) at Kumasi, Ghana, and Udo (2000) at Ilorin, Nigeria.
Table II Number of days of occurrence of clear skies with Ct ≥ 0.60 for January 2016-December 2017 at Ile-Ife, Nigeria.
| Ct ≥ 0.60 | |||
| 2016 | 2017 | ||
| Months | No. of days | Months | No. of days |
| March | 1 | March | 1 |
| April | 1 | May | 1 |
| May | 2 | November | 3 |
| November | 2 | December | 1 |
| December | 1 | ||
Table III Number of days of occurrence of cloudy skies with 0.12 < Ct ≤ 0.34 for January 2016-December 2017 at Ile-Ife, Nigeria.
| 0.12 < Ct ≤ 0.34 | |||
| 2016 | 2017 | ||
| Months | No. of days | Months | No. of days |
| January | 1 | January | 1 |
| March | 3 | March | 1 |
| April | 2 | April | 3 |
| May | 4 | May | 4 |
| June | 10 | June | 6 |
| July | 17 | July | 17 |
| August | 26 | August | 30 |
| September | 8 | September | 18 |
| October | 3 | October | 4 |
| December | 1 | November | 1 |
| December | 3 | ||
As previously stated, the daily variation in the cloudiness index for the two-year period (2016-2017) is presented in Figure 2. Just as it was for the clearness index, data for the cloudiness index shows the variations in the index to be more pronounced in the wet season when compared with values recorded in the dry season. However, in contrast to the clearness index, a minimum of 0.31 and a maximum of 1.04 (recorded on DOY 240 in 2017) were obtained for the cloudiness index. The minimum value obtained shows that the diffuse radiation reaching the Earth’s surface is primarily a result of the molecular scattering and, to a lesser extent, of the surface reflection coefficient (albedo) (Iziomon and Aro, 1998). In 2016 the values of the cloudiness index varied from 0.32-0.69 in the dry months and from 0.31-0.98 in the wet months, while in 2017 the values range between 0.31-0.90 and 0.33-1.04 for the dry and wet months, respectively. The high values recorded for the cloudiness index imply that sky conditions at Ile-Ife are highly cloudy, in contrast to the conclusion drawn from the clearness index.
3.2 Annual variation of the clearness and cloudiness indices
The monthly variations of both the clearness and cloudiness indices are presented in Table IV. For the years 2016 and 2017, the maximum value for the clearness index was recorded in November while the minimum value was recorded in August. The mean values of about 0.44 and 0.43 were recorded for 2016 and 2017, respectively, while an average value of 0.43 was recorded for the two years. Although slightly lower, these mean values are similar to the 0.47 values obtained in Ibadan (7.45º N) between 1975-1980 by Ideriah and Suleman (1989), 0.48 in Ilorin (8.33º N) for 1993-1994 by Udo (2000) and 0.43 reported by both Awachie and Okeke (1988) in Nsukka, Nigeria and Akuffo and Brew-Hammond (1993)) in Kumasi, Ghana. For the cloudiness index, the maximum value for the two years (2016-2017) was recorded in August while the minimum value was recorded in December 2016 and November 2017, respectively. An average value of about 0.52 was recorded for the two years.
Table IV Monthly averages of the clearness and cloudiness indices for January 2016-December 2017 at Ile-Ife, Nigeria.
| Months | 2016 | 2017 | ||
| Clearness index | Cloudiness index | Clearness index | Cloudiness index | |
| January | 0.49 | 0.44 | 0.45 | 0.48 |
| February | 0.47 | 0.46 | 0.46 | 0.47 |
| March | 0.47 | 0.47 | 0.49 | 0.45 |
| April | 0.50 | 0.43 | 0.47 | 0.47 |
| May | 0.45 | 0.48 | 0.47 | 0.47 |
| June | 0.40 | 0.55 | 0.41 | 0.52 |
| July | 0.34 | 0.62 | 0.33 | 0.63 |
| August | 0.27 | 0.72 | 0.27 | 0.72 |
| September | 0.39 | 0.56 | 0.33 | 0.63 |
| October | 0.47 | 0.56 | 0.44 | 0.50 |
| November | 0.52 | 0.46 | 0.50 | 0.43 |
| December | 0.49 | 0.41 | 0.48 | 0.46 |
The annual variations of the clearness and cloudiness indices for the two years is presented in Figure 3. It can be seen that the variations of the two parameters are inversely related, such that as the value of the clearness index increases the value of the cloudiness index decreases and vice versa. The values of these parameters also show strong seasonal variations with a peak value of 0.51 in November for the clearness index and a peak value of 0.72 in August for the cloudiness index. The highest value recorded for the clearness index in November implies that the global solar radiation received at the Earth’s surface consists mainly of the beam (direct) radiation component. As a result, the performance of solar energy systems at the location under study are expected to be high in November (Iziomon and Aro, 1998).

Fig. 3 Annual variations of the clearness and cloudiness indices for January 2016-December 2017 at Ile-Ife, Nigeria.
The highest monthly mean value for the cloudiness index was obtained in August, which is a wet and cloudy month typically characterized by considerable increase in atmospheric water content and increased number and types of clouds (Ayoola et al., 2014; Soneye et al., 2019). During wet months, the global solar radiation received on a horizontal surface consists mainly of diffuse radiation, which arises majorly from the intense forward scattering of global solar radiation mainly by altostratus, thin cirrus and altocumulus clouds (Iziomon and Aro, 1998; Okogbue et al., 2009). From November to April (when there is no or little cloudiness and a decrease in turbidity when the atmosphere is relatively clear) the values of the clearness index increased, similarly to the results obtained by Babatunde and Aro (1995), Iziomon and Aro (1998) and Udo (2000) in Ilorin, and Okogbue et al. (2009) at Ile-Ife. Furthermore, it was observed that the distribution of both indices is bell-shaped between the months of July and September with a peak for the cloudiness index and a depression for the clearness index in August. This bell-shaped distribution for both ratios has been previously observed at tropical locations by Ideriah and Suleman (1989) and Okogbue et al. (2009).
3.3 Empirical relation between the maximum and average clearness index
The monthly variations of the maximum clearness index that was measured and estimated from the Hollands and Huget (1983) and Saunier et al. (1987) models shown in (9) and (10) for 2016 are presented in Figure 4. As shown in this figure, the estimated values of the maximum clearness index obtained from both models essentially duplicate the pattern of the measured index, with the lowest values for both the measured (0.46) and estimated (0.52 and 0.67) variations recorded in the month of August. The highest value of 0.64 was recorded in May for the measured maximum clearness index, while highest estimated values of 0.67 and 0.77 were recorded in November for Saunier et al. (1987) and Hollands and Huget (1983) models, respectively. The values estimated from the models implies that former is more useful in a tropical location than the later (see Fig. 5 for the evaluation performance).

Fig. 4 Monthly variations of the maximum clearness index measured and estimated from Hollands and Huget (1983) and Saunier et al. (1987) models.
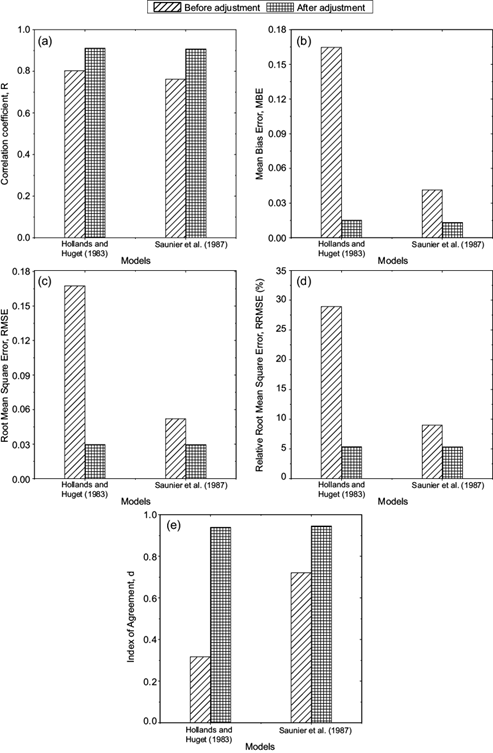
Fig. 5 Statistical measures for the maximum clearness index estimated with the Hollands and Huget (1983) and Saunier et al. (1987) models before and after calibration at Ile-Ife, Nigeria.
The differences in the measured and estimated values, especially for the Hollands and Huget (1983) model, can be attributed to the differences in the values of the maximum clearness index, geographical location and the fundamental probability density functions between Ile-Ife, on one side, and Bangkok and Canada, where the two models were developed, on the other side. It can also be a result of the differences in intensity of the global solar radiation received at Ile-Ife, Bangkok and Canada. The results are similar to those obtained at Kumasi, Ghana by Akuffo and Brew-Hammond (1993) and at Ilorin, Nigeria by Udo (2000), further supporting the finding that the Saunier et al. (1987) model is more relevant in tropical locations than the Hollands and Huget (1983) model.
The statistical indicators for the original and calibrated models are presented in Figure 5. As shown in this figure, the values of the correlation coefficient and the index of agreement increased after calibration while the values of the errors decreased after calibration, to indicate significant improvements in the models. For the Hollands and Huget (1983) model, the MBE, RMSE and RRMSE values decreased from 0.17 to 0.02, from 0.17 to 0.03, and from 28.92% to 5.34%, respectively; while the values of R and d increased from 0.80 to 0.91 and from 0.32 to 0.94, respectively. For the Saunier et al. (1987) model, the MBE, RMSE and RRMSE decreased from 0.04 to 0.01, from 0.05 to 0.03, and from 8.98% to 5.32%, respectively; while the values of R and d increased respectively from 0.76 to 0.91 and 0.72 to 0.95, respectively. These results are in agreement with those obtained by Udo (2000), who reported that the values of MBE and RMSE were higher for the original Hollands and Huget (1983) and Saunier et al. (1987) models.
The monthly variations of the measured and post-calibration estimated maximum clearness index for 2017 is presented in Figure 6. The highest value of 0.63 was recorded for the measured clearness index in November while the highest values of 0.63 and 0.64 were obtained in the same month for the calibrated Hollands and Huget (1983) and Saunier et al. (1987) models, respectively. In addition, the lowest value of 0.41 was recorded in August for the measured index while the lowest values of 0.41 and 0.43 were estimated in the same month from the respective calibrated Hollands and Huget (1983) and Saunier et al. (1987) models. As these results show, the estimated values of the clearness index improved for both models after the calibration of their original coefficients and are almost the same with the maximum values of the clearness index measured at the study site (see Table V and Fig. 5). The improvements show that despite firstly the Saunier et al. (1987) model was found to be more relevant, both models can be recommended for use in Ife and other tropical areas.

Fig. 6 Monthly variations of the maximum clearness index values, both measured and estimated from the calibrated Hollands and Huget (1983) and Saunier et al. (1987) models.
Table V Calibrated coefficient of empirical Hollands and Huget (1983) and Saunier et al. (1987) models for Ile-Ife, Nigeria.
| Model | Calibration constants | Calibrated equation |
| Hollands and Huget (1983) |
|
|
| Saunier et al. (1987) |
|
|
Furthermore, three equations for estimating the maximum clearness index in terms of the average clearness index were developed in this study for the measurement site using linear regression analysis. These equations were developed for both the 2016 and 2017 datasets, and their overall averages are listed below:
Correlation coefficients (R) of about 0.76, 0.91 and 0.89 were obtained for (12), (13) and (14), respectively. These equations, especially (12) and (13), which have higher values of R in addition to the equations listed in Table V, can be used for estimating the maximum clearness index at tropical areas with similar climatological conditions as Ile-Ife, Nigeria.
3.4 Empirical relation between t he clearness and cloudiness indices
Figure 7 shows the linear and polynomial regressions of the relationship between the daily averaged values of the clearness index and the cloudiness index for January-December, 2016. An inverse relationship, which resulted into the simple expression in (15), was observed from the values of these parameters:

Fig. 7 Correlation between the cloudiness and clearness indices for January-December 2016 at Ile-Ife, Nigeria.
which implies that the value of the cloudiness index will be 0 if the value of the clearness index is 1 and vice versa. Therefore, if C d = 0 when C t = 1, the atmosphere is clear and the amount of direct solar radiation received at the Earth’s surface increases due to insignificant attenuation of global solar radiation by clouds and suspended aerosol particles. However, if C d = 1 when C t = 0 the case is the converse. The relationship obtained in this study is similar to those obtained by Babatunde and Aro (1995) at Ilorin, Nigeria and by Aruna and Janarthanan (2014) for three tropical locations (Chennai, Trivandrum and Visakapatnam, India). The linear and polynomial expressions for the cloudiness index as obtained from the regressions of the relationship between the two indices (Fig. 7) are listed respectively in (16) and (17) below:
Figure 8 presents the daily variations of the measured and estimated values of the cloudiness index for 2017 using the linear and polynomial equations listed equations (15) and (16). The results show good agreement between the measured values and the values estimated from the equations. The highest and lowest values of 1.04 and 0.31, respectively, were recorded for the measured cloudiness index while the corresponding values from the linear equations are 0.92 and 0.27, and those from the polynomial equation are 1.01 and 0.32. The good agreement between the maximum and minimum values of both the measured and estimated values of the cloudiness index suggests that, in the absence of measured data at Ile-Ife and other tropical areas with the same surface albedo, climatological and weather conditions, the two equations developed for the cloudiness index can be used for estimating the index.

5. Conclusions
The daily, monthly and annual variations of the clearness index and cloudiness index for a two-year (January 2016-December, 2017) period at Ile-Ife, Nigeria has been reported in this paper in order to evaluate the feasibility of using solar energy at this location. The applicability of the Hollands and Huget (1983) and Saunier et al. (1987) models at Ile-Ife, a tropical location, was investigated. Models for estimating the clearness index in terms of the average clearness index, as well as the cloudiness index in terms of the clearness index, were additionally developed.
The major findings and conclusions drawn from this work are the following:
The values of the clearness and cloudiness indices at Ile-Ife ranged from 0.10 to 0.64 and from 0.31 to 1.04, respectively, on a daily basis. On a monthly basis, the values of the clearness index ranged from 0.27 to 0.51 while the cloudiness index ranged from 0.44 to 0.72, which confirms that the variations of the indices are influenced by changes in the position of the sun, turbidity and clouds.
The clearness index has high values during the dry months (with a peak value of 0.51 in November) and low values in the wet and cloudy months, while the cloudiness index has high values in the wet and cloudy months (with a peak value of 0.72 in August) and low values in the dry months. The low and high values respectively recorded for the clearness index and the cloudiness index in August are attributable to the attenuation of global solar radiation by increased relative humidity and cloudiness. The inverse relationship between the two indices show that in a situation where diffuse solar radiation is not measured, it can be calculated from measured global solar radiation.
The minimum values of the clearness index for the location lie between 0.10 and 0.28 and thereby higher than the minimum value of 0.05 that is stipulated for the clearness index in cloudy conditions. This shows that sky conditions at Ile-Ife are barely overcast despite the prevalence of harmattan dust and clouds in the atmosphere of this location, to further show real potentials for the use of solar energy. In addition, most of the days at Ile-Ife are relatively uniform, with hardly any one extremely cloudy or clear. This removes the possibilities of large fluctuations in the utilization of solar energy in the area.
The results further showed that although the empirical expression proposed by Saunier et al. (1987) initially performed better than that proposed by Hollands and Huget (1983) at Ile-Ife, the two equations improved and performed better after calibration. Hollands and Huget (1983) model improved by about 23.62% while Saunier et al. (1987) model improved by about 3.66%. This implies that the calibrated Hollands and Huget (1983) and Saunier et al. (1987) expressions as listed in (13) and (14), respectively, are appropriate for the study location and can be recommended for use at other tropical areas.
The linear and polynomial empirical expressions relating the cloudiness index to the clearness index as listed in (17) and (18), respectively, showed good agreement between the measured and estimated values. This implies that the two equations are suitable for estimating the maximum clearness index, the cloudiness index and the diffuse solar radiation in terms of the clearness index at Ile-Ife. Thus, the both (17) and (18), which were developed for the cloudiness index at Ile-Ife, can be used for predicting and estimating the index in the absence of measured data at other tropical sites with similar surface albedo, and climatological and weather conditions as Ile-Ife.

