


 nueva página del texto (beta)
 Inglés (pdf)
 Artículo en XML
 Referencias del artículo
 Enviar artículo por email
 Citado por SciELO
  Similares en
SciELO
Similares en
SciELO 
 Permalink
1. Introduction
Drought affects directly or indirectly all spheres of society, hence the importance attributed to the search of tools, methods, and procedures for its mitigation, even more to face its effects. Between 2014 and 2016, the central and eastern provinces of Cuba faced periods of recurrent drought, reporting severe or extreme precipitation deficits during the rainy season (ranging from May to October) and also during the last months of 2016 (INSMET, 2016).
Artificial rain enhancement by cloud seeding may be considered an important tool to mitigate meteorological drought. Cloud seeding could contribute to an increase in the total amount of naturally produced rainfall by 10-20% (Silverman, 2001). Methods based on the static and dynamic hypotheses are variants of glaciogenic seeding that have been studied in several experimental and numerical simulation investigations (Woodley et al., 1982; Rosenfeld and Woodley, 1993, Bruintjes et al. 1995; Silverman, 2001).
The static seeding hypothesis is based on providing the optimal amount of ice particles for the available liquid water content to initiate the precipitation processes earlier and, perhaps, at lower heights of the developing cloud than would naturally occur, in order to obtain concentrations of ice particles in the range of 1 to 10 crystals per liter (Silverman, 1986). The static method is applied when there is evidence for assuming that the natural process of precipitation formation is not efficient. This must be related to the lack of natural ice nuclei in the atmosphere at the height and temperature where there is supercooled water in clouds (Gagin and Neuman, 1981; Silverman, 1986; Xue et al., 2013a).
On the other hand, the dynamic seeding hypothesis is applied to clouds with high supercooled water content and vigorous updrafts, which will produce rain under natural conditions. This method would increase the total accumulated rainfall that is produced during the life cycle of the cloud system. It is based on the introduction of glaciogenic nuclei in the updraft with high supercooled water content, with the objective of freezing this water quickly and releasing latent heat, which increases cloud temperature and invigorates it. In the presence of a strong updraft, the constant formation of supercooled water drops by coalescence is guaranteed, so that the ice crystals formed will continue to serve as ice nuclei, enabling the continuity of the process. This seeding method aims at introducing a large number of ice nuclei (from 100 to 1000 nucleus per liter) so that massive glaciation occurs in the seeded area (Woodley et al., 1982). Many studies have shown that the application of the dynamic hypothesis increases the horizontal extension and lifetime of the seeded cloud as well as its accumulated rainfall (Simpson et al., 1967; Woodley et al., 1982; Rosenfeld and Woodley, 1993; Koloskov et al., 1996; Silverman, 2001; Martínez et al., 2011a).
Silver iodide (AgI) aerosol has been widely used for cloud seeding (Simpson et al. 1967; Woodley, 1970; Gagin and Neumann, 1981; Smith et al. 1984; Super and Heimbach , 1988; Koloskov et al. 1996, Geerts et al., 2010, Xue et al., 2013a, b, Breed et al., 2013). AgI is activated as a glaciogenic nuclei at temperatures between -5 to -8 ºC. It increases with decreasing temperatures by three to four orders of magnitude to about -16 ºC and continues increasing by less than one order of magnitude with further decreases in temperature (Silverman, 1986). In many cases the activation levels coincide with higher values of cloud liquid water content that decreases with height for orographic clouds (Politovich and Vali, 1983).
Studies carried out in Cuba between 1985 and 1991 as part of the Cuban Artificial Weather Modification Project (PCMAT, by its acronym in Spanish) using AgI, showed that the randomized glaciogenic cloud seeding in the Camagüey experimental site increased the cloud top height, its life time and the probability of precipitation. The study was made in clouds with tops between -10 and -20 °C. The average increase in rain volumes in the seeded clouds was 120% for individual clouds and 65% for cloud clusters, compared to unseeded clouds and clusters (Koloskov et al., 1996).
The artificial rain enhancement project was resumed in Cuba in 2005 with a randomized experiment including a floating target design and radar control. This experiment was carried out in an area of the central-eastern region of Cuba centered in the city of Camagüey, via dynamic seeding with silver iodide pyrotechnics from an aircraft (Martínez et al., 2011a, b). Simultaneously, in another region near the eastern end of Cuba, the method of dispersing silver iodide aerosol from ground-based acetone ignition generators was tested by the Chilean company Hidromet (Martínez et al., 2011a). The equipment had to be installed on hillsides or mountain tops to ensure that most of the reagent could reach the convective clouds. This was done taking into consideration the high temperatures at cloud base in the study region, since the height of the 0 ºC isotherm is generally found near 4500 m duting the summer months in Cuba, while the lifting condensation level at the time of maximum convection is in the range 1000-1500 m (Martínez et al., 2001, 2002). Twenty three ground-based generators were installed in the eastern region, distributed between the provinces of Holguín, Santiago de Cuba and Granma; however, due to accessibility problems, their locations did not meet the necessary requirements, costs and resources, since they were generally located below the altitude of 200 m and, in many cases, even closer to sea level.
Numerical studies of AgI dispersion from the implementation of the modeling system MM5-CALMET-CALPUFF indicated that the concentrations that reach the active zone of AgI at the top of the clouds are insufficient to obtain a seeding effect, so it is necessary to review their locations and the dosage of the reagent (Mayor et al., 2014). For this reason, this method was discontinued, pending further study of the dispersion of the reagent because the model presented limitations in the representation of the aerosol with height.
Several modeling studies have been aimed at analyzing the behavior of the emission plume of ground-based generators installed on mountain hillsides (Jensen et al., 2004). In particular, Xue et al. (2013a) described the parameterization of AgI cloud seeding implemented within the single-moment Thompson microphysics scheme of the WRF model (Thompson et al., 2004) to investigate the seeding effect. The modeling results showed that the parameterization could reasonably simulate the physical processes of cloud seeding. Later on, Xue et al. (2013b) carried out a numerical modeling study to explore the ability of WRF large eddy simulations (LES) to reproduce the dispersion of AgI, comparing the results with observations made on February 16, 2011 over the mountains of Medicine Bow, Wyoming, USA. The main result of this study showed that the WRF-LES simulates reasonably well the dispersion of AgI and that the turbulent flows induced by the terrain were mostly responsible for its vertical dispersion. A follow-up study with WRF-LES (Xue et al, 2015) showed that vertical dispersion of AgI particles is more efficient on cloudy days, and that wind shear and buoyancy dominate turbulence kinetic energy (TKE) production in the mountains of Wyoming in the winter season.
In the present study we aim to evaluate the vertical and horizontal dispersion of AgI, burned in a solution of acetone by ground-based generators. Since it is necessary for glaciogenic seeding that aerosol attains temperatures cold enough for its activation as a nucleation agent, concentrations that reach the seeding heights are studied. Two spatial distribution and two emission rates are analyzed to know which could be the best for the future installation of ground-based generators in Cuban mountains.
2. Experimental design
2.1 WRF-Chem model. Simulation domains
The WRF-Chem model was developed by the WRF Atmospheric Chemistry Working Group and simulates turbulent mixing, transport, transformation, and destiny of gases and aerosols simultaneously (Grell et al., 2005).
The chemical module of WRF was used in this study with the volcanic emissions option enabled, assuming the ground-based generators as “ash-emitting small volcanoes”, and that AgI aerosol dispersion properties were similar to those of ash.
To avoid introducing large interpolation errors with a drastic decrease in resolution, a total of four domains were defined: A coarse external domain of 27 km and three nested domains of 9, 3 and 1 km, each of them identified as d01, d02, d03, and d04, respectively (Fig. 1).

The finest grid (1 km) covers the region of interest (eastern Cuba) centered on 20.334 ºN and -75.824 ºW. It has a horizontal extension of 442 × 220 grid points and 50 vertical levels distributed on an eta (ɳ) coordinate axis that decreases with an inverse dependence of the difference between the pressure of the level and the pressure at the top of the troposphere, this is between the level ɳ = 1 at the surface until ɳ = 0 at the top of the model. The pressure at the top of the troposphere in the model is 50 hPa.
Topographic data were downloaded from the website https://www.usgs.gov, with a resolution of 30 seconds of arc (approximately 900 m), which is adequate for the accuracy required in this case study, since the higher resolution domain is 1 km.
2.2 Emission parameters of the point sources
The emission parameters of the point sources are shown in Table I. The basic function of the AgI generator is the combustion of this chemical compound. The AgI solution burned by the generator is composed mostly of acetone, which acts as the primary solvent for the chemical and as fuel.
Table I Emission parameters of the ground-based generators.
| Emission velocity | 0.3 m s-1 |
| Emission ratio | 10, 30 g h-1 |
| Ground-based generators size | 1.5 m |
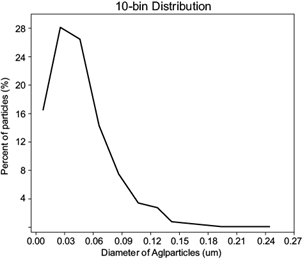
The size distribution of emitted particles (where the size is assumed as particle diameter) has a large influence on aerosol dispersion, with smaller sizes resulting in greater spatial dispersion. The distribution proposed by Demott (1982) was chosen since both the solution and the generator were similar to those proposed for installation in Cuba. A 2% AgI concentration in the solution is common for both samples. So far, no measurements have been made in Cuba for the particle size distribution of the combustion result of the AgI solution in acetone. Since measurements of different 2% AgI made by Demott (1982) solutions were similar, the distribution was selected arbitrarily, since a simulation study was made for them and results were similar. Measurements made by Demott (1982) of a 2% AgI-NH4-acetone-water with 20 mole % NH4ClO4 solution (see his figure 8b) were chosen as a reasonable estimate of the proposed generators particle size distribution. From this distribution it was possible to calculate the total mass of AgI, which was split in 10 intervals of different sizes corresponding to ranges of aerosol particle diameters from 0.0075 to 0.244 μm (Fig. 2).
2.3 Case studies
The selected days for simulations correspond to the rainy period (May to October) during 2015 and 2016. The selection was made considering the presence of convective clouds in eastern Cuba related to synoptic scale or mesoscale phenomena. This ensured the presence of atmospheric conditions suitable for convection.
The influence of the Azores High pressure system is common during the rainy season in Cuba, with the rain primarily produced by local conditions, mesoscale flux convergence and diurnal instability due to surface heating. These conditions are typical in all the cases selected for this study, as shown in Figure 3. In some cases, convection was stimulated by the presence of a cut-off low pressure system or associated trough at 200 hPa.
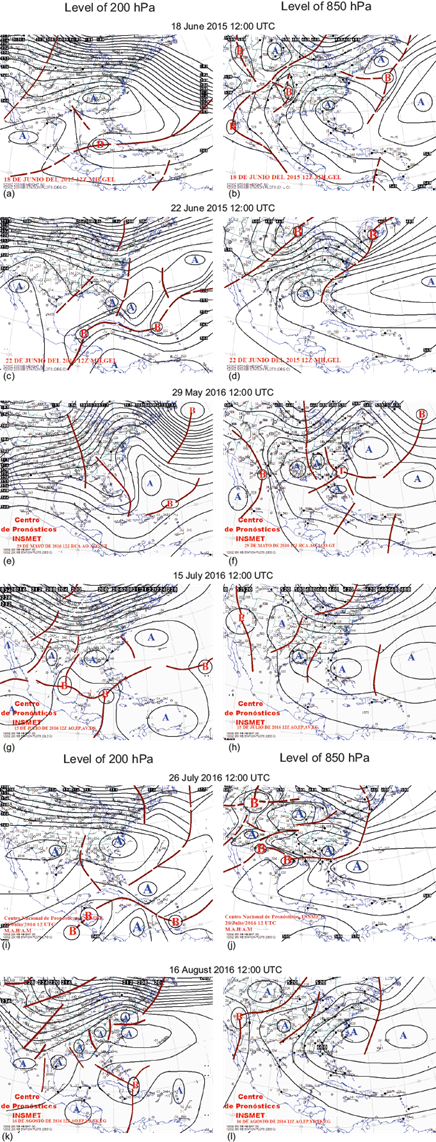
Fig. 3 Synoptic conditions of the selected days for simulation. Geopotential contours at the 200 hPa level are presented in panels a, c, e, g, i, k, while the corresponding patterns at 850 hPa are shown in panels b, d, f, h, j, l.
The atmospheric variables for the selected days were taken from the output of the Global Forecast System (GFS) model, available at http://nomads.ncep.noaa.gov. These data are in 3-h intervals with a spatial resolution of 50 km. Simulations were initialized at 00:00 UTC of each selected day until 03:00 UTC of the following day, for a total of 27 h for each study day. Model outputs were recorded every 30 min.
The ground-based generators were turned on in the simulation at 13:00 UTC and remained working for 11 h. Two hypothetical spatial distributions of 13 generators were analyzed. Point sources were located on the hillside of the mountains, taking advantage of the orographic forcing, and favoring the introduction of the reagent in the cloud.
The first distribution (I) corresponds to a location of the generators in nearby positions (10 to 15 km apart, according to the criteria used in the installation plans for the generators in Cuba) at an average height of 445 masl, all located in the province of Santiago de Cuba, in the Sierra Maestra mountain range and the Cordillera de la Gran Piedra (Fig. 4a). In the second experiment (II), the generators were hypothetically distributed in the main elevations of the eastern region and the heights above sea level were higher than in the first case, with an average height of 585 masl. In this case, the generators were scattered in the Sierra Maestra, Sierra del Cristal and in the Cordillera de la Gran Piedra (Fig. 4b). In no case the heights exceed 940 masl.

To establish if an increase in the number of generators would contribute positively to the seeding process, two case studies were simulated considering the same emission parameters but different emission rates. The first case assumed an emission rate of 10 g h-1 and the second of 30 g h-1, which is equivalent to assuming the presence of three generators emitting at a rate of 10 g h-1, located close enough to the original location so that they contribute to the same node of the model grid (1 km).
2.4 Seeding threshold
According to the technical characteristics of the pyrotechnic flares PV-26-01 (Martínez et al., 2011a) used in the second program of artificial increase of rain in Cuba in 2005, at -5 ºC, 1 g of AgI contributes to 1013 ice nuclei. Hence, for the static seeding to occur about 0.1 ng m-3, it would be necessary to obtain 1 nucleus per liter. On the other hand, for dynamic seeding, approximately 10 ng m-3 of AgI are necessary to obtain concentrations of the order of at least 100 nuclei per liter. Since there are no published measurements of the mixture of AgI burned in the generators, the above values are used as concentration thresholds necessary for the occurrence of glaciogenic seeding.
3. Results
3.1 Analysis of the maximum concentration and area occupied by the aerosol
The maximum concentration of AgI between the 1000 and 1500 m levels above the surface was analyzed for each selected case study. The maximum daily concentrations for each of the six days simulated under experiments I and II are shown in Figure 5. For emissions of 10 g h-1, most maximum concentrations do not exceed 1 ng m-3, but most of the reports are above 0.1 ng m-3 (Fig. 5a, b). The maximum average concentration over the six selected days is reached at 17 h, 4 h after the generators are turned on. Approximate values of 0.53 and 0.66 ng m-3 were obtained for spatial distributions I and II, respectively. When the emission rates were increased to 30 g h-1, the maximum concentrations grew proportionally to the rate of the emission increase (Fig. 5c, d).
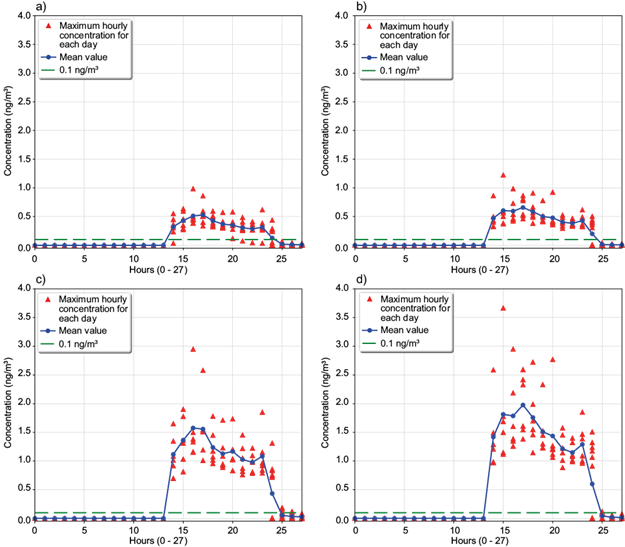
Fig. 5 Maximum concentration of AgI between 1000 and 1500 m above the surface for an emission rate of 10 g h-1 for the spatial distributions I (a) and II (b); and for emissions of 30 g h-1 for the spatial distributions I (c) and II (d) for the set of days simulated.
The area occupied by the aerosol in the studied layer was also obtained for concentrations greater than 0.1 ng m-3 for each case study. For emissions of 10 g h-1, the reported area for the spatial distribution I is greater than for II, with an average maximum surface of 67 and 39 km2, respectively, both at 16 h (Fig. 6a, b). In the case of 30 g h-1 emissions, the areas increase considerably, reaching more than 400 and 600 km2 for distributions II and I, respectively (Fig. 6c, d). After 16:00 UTC, the AgI covered areas, with concentrations above 0.1 ng m-3, as well as the maximum concentration value, experienced a decrease until the generators were turned off.

Fig. 6 Average area with the presence of AgI in concentrations ≥ 0.1 ng m-3, between 1000 and 1500 m above the surface for an emission rate of 10 g h-1 for the spatial distributions I (a) and II (b); and for emissions of 30 g h-1 for the spatial distributions I (c) and II (d) for the set of days simulated.
The output of the model was analyzed for greater heights between the isotherms of -5 and -10 ºC, where the aerosol particles may potentially be activated as ice nuclei. Since for 10 g h-1 emissions, AgI aerosol concentrations were not higher than 0.1 ng m-3 at those altitudes, the analysis was carried out only for emissions of 30 g h-1. Maximum concentrations slightly exceed 0.1 ng m-3 in distribution II, whereas for distribution I they are higher; also, there are more hourly reports per day above this threshold value (Fig. 7). The area occupied by the aerosol dispersed in concentrations greater than 0.1 ng m-3 is very small, with values that do not exceed 15 km2 for distribution II and 30 km2 for distribution I (not shown). Therefore, for the studied days, static seeding could occur with an emission rate of 30 g h-1. However, the areal fraction occupied by the AgI concentrations above 0.1 ng m-3 is very small. On the other hand, dynamic seeding would not occur in any case, because concentrations above 10 ng m-3 were not obtained for any of the studied days between the seeding levels.
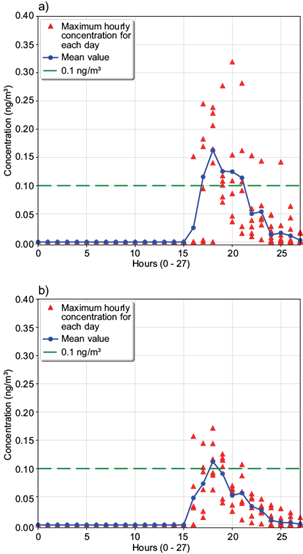
Fig. 7 Maximum concentration of AgI between -5 and -10 ºC for an emission rate of 30 g h-1, for the spatial distributions I (a) and II (b) for the set of days simulated.
To study the cloud seeding effectiveness, the convolution of the cloud water content and aerosol concentration ≥ 0.1 ng m-3 was calculated. The presence of cloud water above the 0 ºC isotherm is considered as supercooled water. Figure 8 shows the occupied area by the coincidence of these two variables for an emission rate of 30 g h-1. The existence of coincidences indicates that the aerosol could serve as ice nucleus, allowing the static seeding to occur mainly for distribution I (Fig. 8a), where the area occupied is higher.

3.2 Influence of the horizontal wind
Figure 9 shows the influence of wind on aerosol dispersion for levels between 1000 and 1500 m above the surface. On July 15, 2016 winds were predominantly easterly due to the influence of the North Atlantic High. Under these conditions, for spatial distribution I aerosol is advected by the prevailing wind towards the sea (Fig. 9a, c, e, g). Similarly, for spatial distribution II, aerosol is driven away from land for generators located in the Cordillera de la Gran Piedra and some of the generators in the Sierra Maestra (Fig. 9b, d, f, h). However, for this day the wind keeps within the target region the emission plumes of generators located in the Sierra del Cristal and in the westernmost part of the Sierra Maestra. In all cases, aerosol is advected towards the sea after reaching its maximum concentration over land.
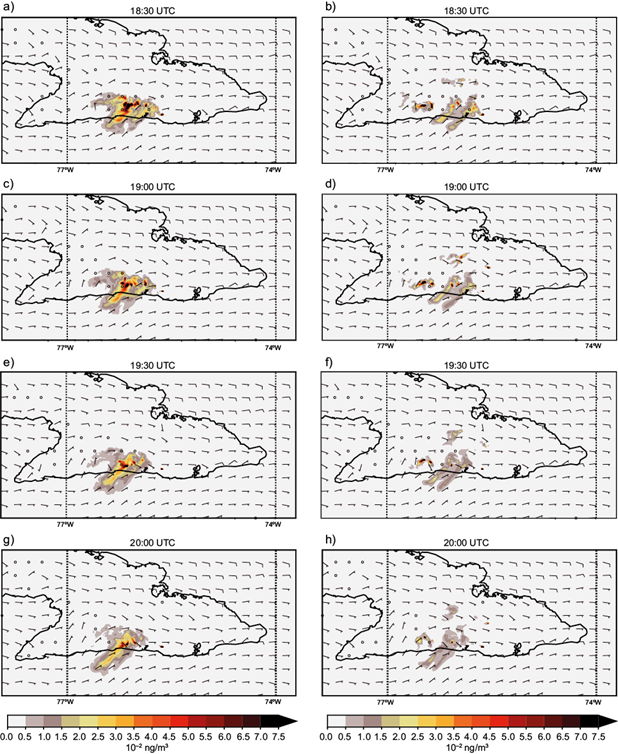
Fig. 9 Average hourly concentrations of AgI ≥ 0.1 ng m-3, between 1000 and 1500 m above the surface, on July 15, 2016 for distributions I (a, c, e, g) and II (b , d, f, h), for emissions of 10 g h-1 at various times. Wind barbs indicate the direction and speed of the average wind at the levels between these heights.
3.3 Vertical cross section
Figure 10 shows a longitudinal vertical cross section at latitude 20.11 °N, corresponding to the location of one of the generators at 422.9 masl and 75.95 ºW. The plume of another generator located at a different latitude can be also detected in Figure 10b, c, d. Note that the plume does not reach seeding levels in this case, as it remains under the 0 °C isotherm. The main characteristics for August 16, 2016 was the presence of a cut-off law pressure system over eastern Bahamas at high levels, inducing unstable conditions over eastern Cuba and favoring a plume ascent. Under spatial distribution I the plume reached higher altitudes than for distribution II (not shown), indicating that the local prevailing conditions on a given day vary, mainly due to local orography, which contributes to the ascent of the plume by mechanical forcing. The higher rise of the plume occurs in the first 4 h of ignition of the generators for all simulated cases.

Fig. 10 Longitudinal vertical cross section at latitude 20.11 °N, corresponding to the location of one of the generators for distribution I, on August 16, 2016, showing the concentration of AgI in ng m-3. The continuous blue isolines represent the turbulence kinetic energy (TKE) (J kg-1). The isotherms of 15 and 0 ºC are represented by dashed lines. Wind barbs indicate the direction and speed of the wind. The black triangle indicates the generator position.
Aerosol dispersion is closely related to the TKE. The higher the values of TKE, the higher the probability of vertical rise of the plume. TKE is the result of the sum of several terms that, in addition to turbulent transport and wind shear terms, also consists of the buoyant production term, the TKE advection term, the dissipation term and the pressure adjustment of correlation term. TKE is an indicator of the height of the atmospheric boundary layer, therefore it can be inferred that, for some cases, the plume exceeds the height of this layer. Therefore, it is likely for the aerosol to penetrate the base of the cloud under cloudy conditions.
Figure 11 shows a comparison of the mean plume height for concentrations greater than 0.1 ng m-3 and the mean TKE height for values greater than its mean below the PBL height (0.46 J kg-1) between the hours where the convection is active. This analysis was made for the cross section shown in Figure 10.

Fig. 11 Mean vertical distribution of the aerosol plume height and turbulence kinetic energy (TKE) height for the cross section shown in Figure 10.
Vertical velocity was taken as a criterion for convection initiation if values remained greater than zero in the morning and early afternoon (Fig. 12). The convection time prevailed from 15:30 to 18:30 UTC, where the TKE and the plume height show their maximum values (Fig. 11). The dependence of the aerosol plume height to the TKE height is clear in Figure 10. Maximum values for both variables were reached at 18:00 UTC.

To visualize the AgI plume concentration values that could reach the height for effective seeding, Figure 13 illustrates a longitudinal vertical cross section at 20.08º N with the representation of the isotherms of 0, -5 and -10 ºC. The ground-based generator is located at this latitude and 75.78º W, at 383.2 masl. Note that concentrations of the order of 0.02 ng m-3 reach and surpass the height of the -5 ºC isotherm and coincide with the presence of supercooled water (Fig. 13c, d). However, these concentrations are insufficient for static seeding to occur. Thus, a simulated emission ratio of 10 g h-1 does not ensure that the reagent with sufficient concentration could reach the height required for seeding. Consequently, the use of ground generators with this emission rate would not accomplish the desired objective and would result in the total loss of seeding material for the selected case studies.
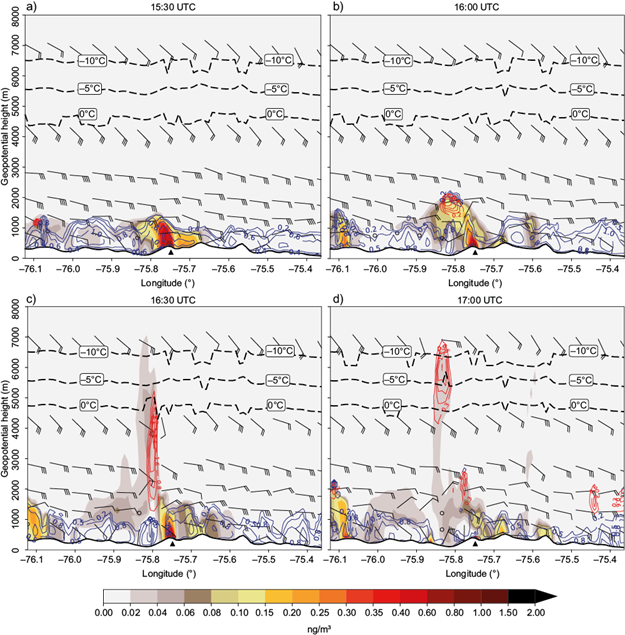
Fig. 13 As Figure 10, but for latitude 20.08 ºN, with the 0, -5 and -10 ºC isotherms represented by dashed lines. The continuous red isolines represent the cloud water mixing ratio (g kg-1).
4. Conclusions and recommendations
The results obtained from the case studies allow the following conclusions:
Spatial distribution I, corresponding to generators deployed close to each other and on average at 445 masl in the province of Santiago de Cuba (on the hills of Sierra Maestra and the Cordillera de la Gran Piedra) reported lower maximum concentrations and greater areas occupied by aerosol between 1000 and 1500 m above the surface.
Spatial distribution I showed the greatest maximum concentrations of AgI and coincidence area of supercooled water and AgI concentrations greater than or equal to 0.1 ng m-3 between the -5 and -10 ºC isotherms, which would be potentially positive for seeding.
The rate of increase of the maximum concentration is proportional to the rate of increase of the emission for the same spatial distribution.
The area occupied by AgI concentrations above 0.1 ng m-3 for the same spatial distribution of the generators increases considerably for emissions of 30 g h-1, evidencing the need of increasing the number of generators for static seeding to occur.
The plume does not reach the effective levels of seeding for an emission rate of 10 g h-1, whereas for 30 g h-1 it reaches the layers between the isotherms of -5 and -10 ºC, so that static seeding could occur even if these concentrations are not found in significant areas. However, the seeding effect would probably be very limited.
Part of the aerosol is advected out of the eastern region towards the sea, after reaching its maximum concentration over land.
TKE determines the degree of ascent of the emission plume from the generators.
This work can be considered as the first step in the application of the WRF-Chem model for simulating cloud seeding in Cuba. To generalize the results of the dispersion study it is necessary to carry out a systematic simulation program with different prevailing circulation conditions, as well as to consider the influence of AgI aerosol on ice crystals formation, depending on the spatial distribution of the reagent and the temperature.
The preliminary results obtained in this work show that the methodology applied in the experimental use of AgI generators between 2005 and 2010 had serious limitations, such as the location of the generators below the minimum heights necessary for the dispersion of the reagent and an underestimation of the dispersion time, since the generators were turned on when the convective clouds appeared, while the necessary time for their ascent to activation heights is approximately 4 h.
From the comparison of the dispersion results between the two proposed distributions, it can be inferred that the optimization of the individual location and spatial distribution of the generators can lead to a significant increase of reagent concentrations at activation heights. Even so, the values and coverage areas of these concentrations are very low.

