


 text new page (beta)
 English (pdf)
 Article in xml format
 Article references
 Send this article by e-mail
 Cited by SciELO
  Similars in
SciELO
Similars in
SciELO 
 Permalink
1. Introduction
Meteorological disasters are the direct or indirect damages caused by atmospheric phenomena to human life and property, national economic construction, and national defense construction (Zhang, 2008; Farfán et al., 2013). Among all types of natural disasters, weather-related disasters have the highest occurrence frequency and the widest occurrence range, and they cause the largest damage area and the most serious losses (Guan et al., 2015; Jayawardena, 2015; Munich Re, 2018). A report issued by the Centre for Research on the Epidemiology of Disasters (CRED) and United Nations Office for Disaster Risk Reduction (CRED-UNISDR, 2015) showed that 90% of major disasters had been caused by 6457 recorded floods, storms, heat waves, droughts and other weather-related events during 1995-2015. In 2017, the costliest year ever in terms of global weather disasters, roughly 93% of all the natural catastrophes worldwide were weather-related disasters, and the macroeconomic impact was about 330 billion USD (Munich Re, 2018). Therefore, it is of great significance to explore the spatial-temporal variation characteristics of meteorological disasters in order to take effective prevention and reduction measures to sustainable resources management of meteorological disasters in order to; to plan for weather-related emergencies, and to reduce losses caused by disasters (Malekinezhad and Zare-Garizi, 2014; Haer et al., 2017).
Meteorological disasters generally include weather, climatic, and meteorological secondary and derivative disasters. Catastrophes caused by weather phenomena such as gales, rainstorms, hails, tornados, cold waves, frosts, fogs, etc., are called weather disasters. Climatic disasters are natural disasters caused by large-scale and long-term climatic anomalies, mainly including drought, flood, low temperature, and cold damage, as well as desertification, sandstorms, salinization, mountain landslides, debris flows and crop biological disasters. Globally, the five countries hit by the highest number of disasters during 1995-2015 were the United States, China, India, Philippines and Indonesia (CRED-UNISDR, 2015). According to statistics (Zhao et al., 2017), the annual direct economic losses caused by meteorological disasters in China reached 305.5 billion Chinese yuan during 2004-2013 (100 Chinese yuan = 14.11 USD), accounting for 0.9% of the annual gross domestic product (GDP) on average. The main meteorological disasters in China are droughts, rainstorm-induced floods, typhoons, low temperature and frosts, high temperature and heat waves, snowstorms and hails (Liu and Yan, 2011; Guan et al., 2015), among which drought and flood account for 55 and 27% of the total affected area of crops, respectively (Zhang et al., 2008). As the foundation of China’s national economy, agriculture, especially the acreage and output of crops, is directly related to social stability and people’s life (Wang and Jiang, 1994; Ge and Zhao, 2015). So, it is necessary to strengthen the research on the effect and change of drought and flood disasters.
Low temperatures and snowstorms have caused great losses in China in recent years. For example, the unprecedented low temperature, ice freezing and snow disasters of southern China in 2008, the worst in the past 50 years, blocked highway traffic in several provinces, resulted in direct economic loss up to 159.5 billion yuan and took away 162 lives (National Bureau of Statistics, 2009; Gao, 2009; Yang et al., 2013). On the other hand, the number of extreme hot days and heat waves in summer is increasing in the context of global warming. Sun et al. (2018) showed that the historically hottest summer in 2013 in eastern China was projected to become more frequent, and the frequencies for once-in-5-, 10-, and 50-year events increased by 2.5, 3.5, and 5.5 times under 1.5 °C global warming, respectively..The increased frequency and intensity of heat waves can have serious effects on human health, agriculture and energy (Keller and Fuhrer, 2004; Hatvani-Kovacs et al., 2016; Xu et al., 2016; Thompson et al., 2018).
However, most of the previous studies have focused on the changes in the frequency, intensity and duration of high-impact weathers or climatic extremes (Zhao and Raga, 2015; Fahrenkamp-Uppenbrink, 2015; Shi et al., 2016; Shi et al., 2018; Cui et al., 2017; Sun et al., 2018; Pendergrass, 2018), and few studies have given particular attention to the impacts or losses caused by catastrophic weather and climate (Xie et al., 2014; Wu et al., 2014; Guan et al., 2015; Zhao et al., 2017). Therefore, the objectives of this study are to investigate the spatial and temporal distribution and variation of impacts or losses caused by four main types of meteorological disasters (floods induced by rainstorms, droughts, damages due to low and high temperatures, and heat waves) in East China. The datasets and analysis methods used in this paper are introduced in section 2. The overall characteristics, inter-annual variations and spatial distributions of four meteorological disasters in East China are then presented and analyzed in section 3. In section 4, the main findings of this study and the prevention and mitigation strategies of meteorological disasters are discussed. Finally, a summary is given in section 5.
2. Data and methods
2.1 Data
In this paper, East China includes six provinces, namely Shandong, Jiangsu, Anhui, Zhejiang, Jiangxi, and Fujian, and one city, Shanghai (Fig. 1). The annual disaster census data of four types of meteorological disasters (floods induced by rainstorms, droughts, damages due to low temperatures and high temperatures and heat waves) in 637 counties (districts) of East China during 1984-2010 was used. The disaster information came from the National Climate Center of the China Meteorological Administration and the results of the consultation with the Provincial Civil Affairs Bureau and several related departments, which have a high credibility.
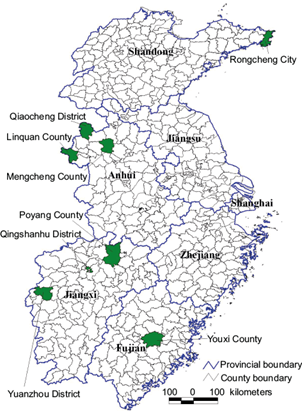
Fig. 1 Administrative division of East China and distribution of counties (cities) mentioned in the text.
The disaster data collected from each province (city) of East China mainly include direct economic loss, affected crop area, total crop failure area, deaths (including missing persons), affected population and other data. The data of meteorological disasters have continuity in time and integrity in space, which can objectively reflect the spatial and temporal distribution of major meteorological disasters. It has been applied to the research on the characteristics of occurrence and change trends of meteorological disasters in China (Wu et al., 2014; Zhao et al., 2017).
2.2 Methods
2.2.1 Definition and date collection of four types of meteorological disasters
Rainstorm-induced floods refer to excessive precipitation during an extended period of time, continued regional heavy rain (daily precipitation between 25.0-49.9 mm), rainstorm precipitation (daily precipitation ≥ 50.0 mm), or local short-time intense rainfall, which causes rivers to overflow destroying levees, houses, roads and bridges, and flooding farmlands and towns leading to geological disasters, loss of agricultural or other property, and casualties (China Meteorological Administration, 2010). The rainstorm-induced flood disaster collected in this paper refers to the occurrence of local or regional rainstorm, which leads to floods, mud-rock flows, landslides and other geological disasters, causing agricultural disaster in an area of more than 50 000 ha, a death toll higher than 10 persons, or direct economic loss of more than 100 million yuan.
Droughts refer to meteorological disasters caused by the shortage or absence of rain in a period of time, where precipitation is obviously less than in the same period of a normal year (China Meteorological Administration, 2010). During drought, crop water balance is destroyed due to insufficient soil moisture, resulting in reduced production and even food shortage and famine. Drought can also kill people and animals because there is not enough drinking water. The occurrence of drought is related to many factors such as precipitation, evaporation, air temperature, soil moisture content, irrigation conditions, planting structure, drought resistance ability during the crop growth period, industrial and urban water use, etc. The drought disaster collected here is a drought event in a province or region with more than 50 000 km2, which lasts for more than 20 days, produces an agricultural disaster area larger than 100 000 ha, or causes water difficulties to more than 100 000 persons in their daily life or productive activities.
Low temperature disasters refer to damage to crops caused by temperature falling below the physiological lower limit of crops during the growing season (China MeteorologicalAdministration, 2010). In East China, this kind of disasters mainly happens during spring and autumn. Cold air in spring invades the Yangtze River basin and areas south of the Yangtze River, often causing the early rice seedlings to rot and die. In autumn, cold weather is easily formed when the East Asian trough is deep and the subtropical high is weakened. The following criteria are used in this paper to characterize low temperature disasters: affecting an agricultural area > 10 000 km2, producing an agricultural disaster area > 1000 ha, causing the death of more than 2 persons or the loss of 10 000 livestock, or producing economic losses of more than 1 million yuan.
Increases in the frequency and intensity of heat waves have serious impacts on human health, agriculture, energy and infrastructure (Sun et al., 2018). When the daily highest temperature is ≥ 35 ºC, it is defined as high temperature, and a high temperature process lasting more than five consecutive days is called heat wave (China Meteorological Administration, 2010). High temperature and heat waves have great influence on human health and social economy, increasing the morbidity and mortality of heat-related diseases and the demand for water and electricity. The evaporation of soil water and transpiration of crops also accelerate the development of drought. The high temperature and heat wave disaster characterized in this paper refers to a process that has great influence on human health and social economy.
2.2.2 Analysis of the characteristics of meteorological disasters
Based on the annual disaster census data of four types of meteorological disasters in 637 counties of East China, their overall characteristics (including number of records, as well as impacts on deaths and losses of crops and economy) were firstly calculated by disaster categories and provinces in East China. Then, year-to-year variations and linear trends in the percentage of records and impacts or losses caused by the four disasters were analyzed during 1984-2010. Finally, the spatial distributions in the total number of records and the amount of impacts or losses were examined with ArcGIS.
3. Results
3.1 Overall characteristics of meteorological disasters in East China
3.1.1 Impacts or losses of different categories of disasters
From 1984 to 2010, the total number of records of four types of meteorological disasters affecting population in East China was 7009, and the number of records with deaths was 1630 times (Table I). The total number of records of crops affected and total crop failure was 9922 and 4575, respectively. In addition, the total number of records of direct economic loss was 8193. In the past 27 years, the largest number of records of affected population, deaths, affected crops, total crop failure and direct economic loss (5392, 1576, 6396, 3197 and 6225, respectively) corresponded to rainstorm-induced flood disasters, while records from drought disasters and low and high temperature disasters are lower with regard to affected population, deaths, affected crops, total crop failure and direct economic loss.
Table I Impacts or losses of four categories of meteorological disasters in East China.
| Categories of disasters | Affected population | Deaths | Direct economic losses |
Affected crop | Total crop failure | |||||
| Number of records | Number of population (×104 people) | Number of records | Number of deaths | Number of records | Loss (× 108 yuan) | Number of records | Area (× 104 ha) | Number of records | Area (× 104 ha) | |
| Rainstorm induced flood | 5392 | 62947 | 1576 | 7002 | 6225 | 5770 | 6396 | 6371 | 3197 | 873 |
| Drought | 1443 | 27794 | 22 | 84 | 1603 | 1069 | 3167 | 5507 | 1234 | 432 |
| Low temperature | 136 | 1673 | 7 | 10 | 329 | 250 | 316 | 401 | 129 | 25 |
| High temperature and heat wave | 38 | 247 | 25 | 464 | 36 | 11 | 43 | 60 | 15 | 8 |
| Total | 7009 | 92660 | 1630 | 7560 | 8193 | 7100 | 9922 | 12339 | 4575 | 1337 |
The four types of meteorological disasters affected a total of 926.6 million people in East China, of which 7560 died (Table I). These disasters affected 123.39 million ha of crops, resulting in a total crop failure of 13.37 million ha and direct economic loss of 710 billion Chinese yuan during 1984-2010. However, the highest number of records or impacts caused by disasters corresponded to rainstorm-induced floods. In the past 27 years, this type of disasters affected a total of 629.47 million people in East China, resulting in 7002 deaths, and it also affected a total of 63.71 million ha of crops of which 8.73 million were totally failed, causing direct economic losses of 577 billion yuan. The impacts of drought on population and crops, as well as the resulting direct economic losses were secondary. Drought had affected a total of 277.94 million people and caused 84 deaths in the past 27 years; in addition, they affected a total of 55.07 million ha of crops, with a total crop failure area of 4.32 million ha. The direct economic loss caused by drought amounted to 106.9 billion yuan.
Low and high temperature disasters had little effects on crops and people in East China (Table I). In the past 27 years, these disasters and heat waves affected 16.73 million and 2.47 million people, respectively, and resulted in 10 and 464 deaths, respectively. There were 4.01 million ha of crops were affected, of which 250 000 ha failed totally due to low temperature, while the corresponding affected area and total failure area of crops caused by high temperature and heat waves were 600 000 and 80 000 ha, respectively. The direct economic losses caused by low temperature and high temperature disasters were 25 billion and 1.1 billion yuan, respectively.
3.1.2 Impacts or losses among different provinces
In different provinces of East China, the impacts or losses of the four types of meteorological disasters were also different (Table II). In the past 27 years, the total number of people affected by four disasters was largest in Anhui, with 396.94 million people, followed by Jiangxi, Shandong and Zhejiang, with 186.01 million, 111.36 million and 111.27 million, respectively, and the number of deaths caused by the four disasters was highest in Jiangxi (1856 people), followed by Anhui, Fujian and Zhejiang, with 1649, 1613 and 1374 people, respectively.
Table II Impacts or losses of meteorological disasters in different provinces of East China.
| Province/ city | Affected population | Deaths | Direct economic losses |
Affected crop | Total crop failure | |||||
| Number of records | Number of population (× 104 people) | Number of records | Number of deaths | Number of records | Loss (× 108 yuan) | Number of records | Area (× 104 ha) | Number of records | Area (× 104 ha) | |
| Anhui | 1990 | 39694 | 360 | 1649 | 1796 | 1901 | 2496 | 4723 | 1259 | 617 |
| Fujian | 927 | 4708 | 287 | 1613 | 1295 | 917 | 1332 | 476 | 529 | 35 |
| Jiangsu | 470 | 7393 | 139 | 537 | 517 | 736 | 774 | 1955 | 298 | 166 |
| Jiangxi | 1905 | 18601 | 404 | 1856 | 2069 | 1593 | 2292 | 1660 | 1308 | 217 |
| Shandong | 786 | 11136 | 116 | 503 | 955 | 629 | 1740 | 2830 | 631 | 255 |
| Shanghai | 30 | 3 | 16 | 28 | 303 | 300 | 92 | 17 | 4 | 0 |
| Zhejiang | 901 | 11127 | 308 | 1374 | 1258 | 1024 | 1196 | 677 | 546 | 47 |
| Total | 7009 | 92660 | 1630 | 7560 | 8193 | 7100 | 9922 | 12339 | 4575 | 1337 |
Anhui was also the province with the largest affected area of crops (47.23 million ha), followed by Shandong, Jiangsu and Jiangxi, with 28.30, 19.55 and 16.60 million ha, respectively (Table II). Anhui had also the largest area of total crop failure (6.17 million ha), followed by Shandong, Jiangxi and Jiangsu, with 2.55, 2.17 and 1.66 million ha, respectively. Direct economic losses from the four disasters were also the highest in Anhui (190.1 billion yuan), followed by Jiangxi and Zhejiang (159.3 and 102.4 billion yuan, respectively). In the past 27 years, the least number of affected people, deaths, affected crop area, total crop failure, and economic loss caused by the four disasters was recorded in Shanghai.
3.2 Inter-annual variations of meteorological disasters in East China
3.2.1 Trends in the records of meteorological disasters in East China
During 1984-2010, the yearly percentage of records of crops affected by the four types of meteorological disasters in East China showed a significant increase, with a linear trend of 0.6% per decade, a maximum of 6.0% in 2003 and a minimum of 2.2% in 1985 (Fig. 2a). The yearly percentage of records of total crop failure caused by meteorological disasters also increased significantly at a linear trend of 1.8% per decade, with a maximum of 7.9% in 2010 and a minimum of 1.2% in 1985.
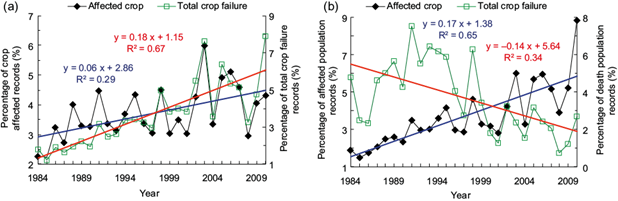
During the past 27 years, the yearly percentage of records of population affected by meteorological disasters increased significantly at a linear trend of 1.7% per decade (Fig. 2b). Its highest point (8.9%) was in 2010 and the lowest (1.5%) in 1985. However, the yearly percentage of records of deaths due to meteorological disasters decreased significantly at a linear trend of 1.4% per decade, with a maximum of 7.5% in 1991 and a minimum of 0.7% in 2008. In addition, the yearly percentage of records of direct economic loss increased significantly at a linear trend of 1.9% per decade, with its highest point (8.4%) in 2010 and the lowest (0.8%) in 1985 (Fig. 3a).

3.2.2 Trends in the impacts or losses caused by meteorological disasters in East China
During 1984-2010, the yearly percentage of the crops area affected by the four types of meteorological disasters in East China increased at a linear trend of 0.2% per decade, and that of the area with total crop failure due to four meteorological disasters increased at a linear trend of 0.9% per decade, but neither of them was statistically significant (Fig. 4a). The percentage of the area affected by meteorological disasters was highest (6.6%) in 2003 and the lowest (2.0%) in 1985, and that of the area with total crop failure was the largest (10.7%) in 2003 and the smallest (0.8%) in 1985.
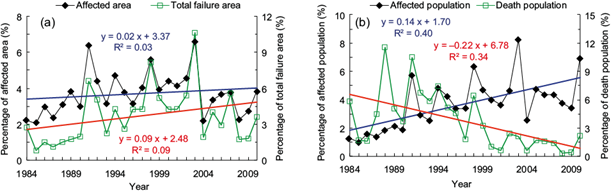
Fig. 4 Trends in the percentage of impacts or losses caused by meteorological disasters in East China. (a) Crops, (b) population.
The yearly percentage of population affected by meteorological disasters increased significantly at a linear trend of 1.4% per decade, but deaths caused by meteorological disasters decreased significantly at a linear trend of 2.2% per decade (Fig. 4b).The percentage of population affected by the four types of meteorological disasters was the highest (8.3%) in 2003 and the lowest (1.0%) in 1985, and the percentage of deaths was highest (11.6%) in 1988 and lowest (0.3%) in 2008. The yearly percentage of direct economic loss also increased significantly with a linear trend of 2.2% per decade, with its lowest (0.1%) in 1985 and its highest (12.5%) in 2010 (Fig. 3b).
3.3 Spatial distributions of meteorological disasters in East China
3.3.1 Distribution in the number of records of meteorological disasters
From 1984 to 2010, the total number of records of four types of meteorological disasters was higher in southern than in northern East China (Fig. 5). In general, Shandong, Jiangsu and Shanghai had fewer disaster records, while Anhui, Jiangxi, Fujian and Zhejiang had more disaster records.
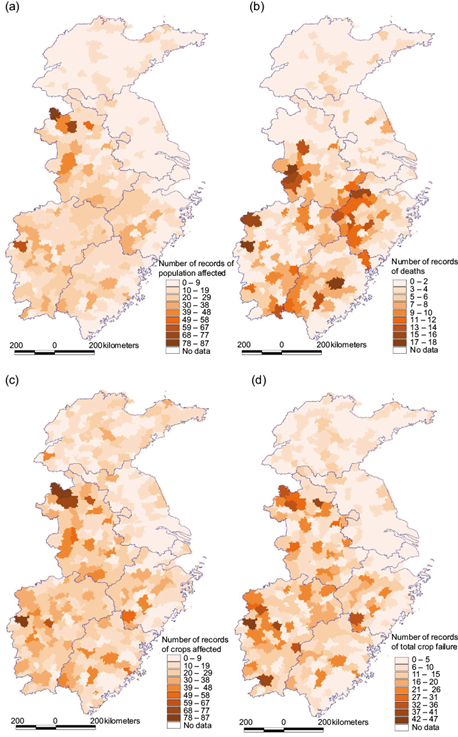
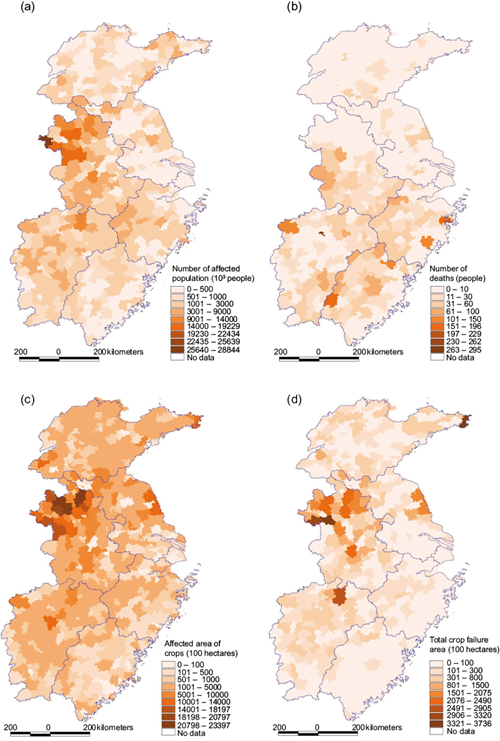
Fig. 5 Spatial distribution of the total number of records of four types of disasters in East China during 1984-2010. (a) Affected population, (b) deaths, (c) affected crops, and (d) total crop failure.
Regarding counties (districts), people affected by four types of meteorological disasters were most frequently recorded in the Qiaocheng district of Bozhou, Anhui, followed by the Mengcheng county of the same city (Figs. 1 and 5a), and the deaths caused by meteorological disasters were most frequently recorded in the Youxi county, Fujian (Figs. 1 and 5b). Crops affected by four types of meteorological disasters over the years were most frequently recorded in Qiaocheng district of Bozhou, and the Yuanzhou district of Yichun city, Jiangxi (Figs. 1 and 5c); the latter also had the most frequent records of total crop failure during 1984-2010 (Figs. 1 and 5d).
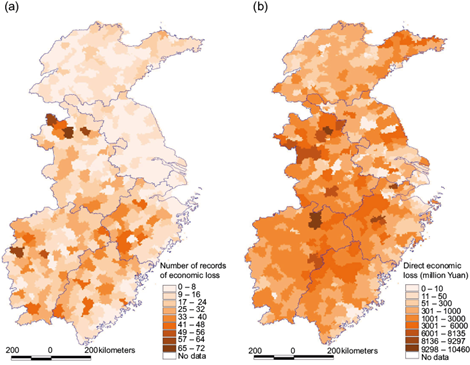
Over the past 27 years, direct economic losses caused by four types of meteorological disasters were most frequently recorded in Zhejiang, Fujian, Jiangxi and Anhui, having the Mengcheng county in Anhui the highest number of records (72) (Figs. 1 and 6a).
3.3.2 Spatial distribution of the impacts or losses caused by meteorological disasters
The total number of people affected by four meteorological disasters was higher in Anhui and Jiangxi, and lower in Fujian, Jiangsu and Shanghai. In Linquan county, Anhui, 28.84 million people were affected in the past 27 years, making it the most affected county by meteorological disasters (Figs. 1 and 7a). Deaths from meteorological disasters were higher in southern Anhui, Jiangxi, Zhejiang and Fujian, and lesser in Shandong, Jiangsu and Shanghai, with the Qingshanhu district in Nanchang city, Jiangxi having the highest number of deaths (295) (Figs. 1 and 7b). Both the affected and total failure areas of crops were larger in northern Anhui, eastern Jiangsu and the eastern Shandong Peninsula in the past 27 years, being Mengcheng the most affected county with a total affected area of 2.34 million ha, while the area of total crop failure was highest in Rongcheng City, Shandong, with a total area of 373 600 ha (Figs. 1 and 7c, d). The direct economic losses caused by meteorological disasters were higher in the southern part of East China and the Anhui province, being highest in Poyang county, Jiangxi, with a total of 10.5 billion yuan in the past 27 years (Figs. 1 and 6b).
4. Discussion
Meteorological disasters are some kind of meteorological phenomena or meteorological activities which affect human security and the social economic system (Xie et al., 2014). In recent years, there has been a marked increase in the attention paid to disasters by geoscientists, engineers, local communities and people at all levels in many parts of the world (Edirisooriya et al., 2018). The analysis showed that rainstorm-induced floods (landslides and mud-rock flows) had the largest number of records regarding affected population, deaths, affected crop, total crops failure and direct economic loss, and also the greatest impacts or losses in East China, (Table I). Our results are consistent with existing research results. For example, Guan et al. (2015) analyzed the spatial and temporal changes of meteorological disasters in China during 1950-2013 and showed that floods were the major meteorological disasters, causing the largest losses in most areas of China, where floods were more frequent in the middle and lower reaches of the Yellow River and the Yangtze River basin. Zhao et al. (2017) analyzed the characteristics of meteorological disasters in China during 2004-2013 and their results showed that rainstorm and flood caused the highest death toll and direct economic loss, especially in the Yangtze River basin.
The changing trends of meteorological disasters can provide important references for regional disaster prevention, mitigation, risk management and climate change adaptation (Wu et al., 2014). In East China, there were increasing trends in the affected and total failure areas of crops, affected people and direct economic loss for both the number of records and the degree of losses (Figs. 2-4). Guan et al. (2015) analyzed the change trend of the area affected by meteorological disasters in China during 2004-2013 and their results indicated that the area affected by floods, droughts, low temperatures and frost disasters showed an obvious upward trend from 1951 to 2013. However, Zhao et al. (2017) showed that from 2004 to 2013 the numbers of deaths and population affected by meteorological disasters, the area of crop failures and the proportion of direct economic losses in the GDP all declined, unlike direct economic losses. Different analysis periods may lead to large differences in research results. During 1981-2010, the number of deaths caused by meteorological disasters decreased significantly in East China (Fig. 4). This result is in accordance with most research results (Wu et al., 2004; Zhao et al., 2017). In recent years, national preparedness and more effective response to disasters have significantly reduced the number of deaths from weather-related disasters in some countries, including China (CRED-UNISDR, 2015).
An accurate and comprehensive understanding of the organization mechanism and laws and regulations of meteorological disaster prevention and reduction in China is of great significance to realize the optimal defense behavior under the conditions of the lowest defense cost and the best benefit of disaster prevention (Yang et al., 2018). On January 27, 2010 the State Council of the People’s Republic of China issued the Regulations on Prevention and Preparedness for Meteorological Disasters (Decree No. 570), which became effective on April 1, 2010. This legal document further regulates the relationship between governments at various levels, relevant departments and general public in activities to prevent meteorological disasters and prepare for them in terms of rights and obligations, and it also creates a legal mechanism and a more sound system for meteorological disaster prevention and preparedness involving “government leading, joint efforts by governmental agencies, and participation of social entities” (State Council-China Meteorological Administration, 2010). In recent years, synthetic abilities on meteorological disaster prevention and mitigation, such as meteorological disaster monitoring, forecasting and warning, releasing warning information, risk management, mitigation measures and scientific support, are strengthened, and the meteorological disaster prevention and mitigation mechanism of “Government-leading, coordination among agencies, social participation”, is gradually improved (Chen, 2013). Many community-based activities have been conducted in cooperation with local governments and experts on disaster mitigation to prepare for these meteorological disasters (Zhou, 2017; Lv, 2019; Zhang et al., 2019).
Over the past three decades, East China has experienced rapid urbanization. With the continuous expansion of urban scale and complexity, the population and assets in the limited space of urban areas are facing higher disaster risks (Hoda and Mohamad, 2013). Urbanization has also accelerated the increasing rate for heavy precipitation days, extreme precipitation amount and precipitation intensity in East China (Shi et al., 2018). The development of disaster mitigation plans, including risk assessment and mitigation strategies, will help the region to better prepare for, respond to and recover from hazard events and disasters. Disaster risk assessment is the basis and prerequisite of meteorological disaster prevention and mitigation (Qiu et al., 2013). New technologies are being widely used for understanding and identifying the vulnerabilities of meteorological disasters and risk (Jiang et al., 2018; Edirisooriya et al., 2018), and information about the dangers of living in areas affected by natural disasters is gradually provided to policymakers and the public based on early warning and risk assessment systems (Chen, 2013). Based on the meteorological monitoring data and third-party evaluation data of typhoons Nesat and Haitang in Fujian province in 2017, Yang et al. (2018) showed that the benefit of preventing and mitigating this double typhoon disaster was about 0.6 billion yuan due to the reduction of direct economic loss, according to the survey and evaluation of mathematical model estimates.
There is a growing consensus that climate change could worsen some natural disasters (Lee et al., 2015). Over the past few decades, global warming has increased the frequency of extreme weather events (Cui et al., 2017), and the world has suffered more climate disasters than geological ones (IPCC, 2014). The economic losses caused by climate disasters are huge and continue to increase as the frequency of climate disasters increases (Yang et al., 2015). Under the background of global climate change, meteorological disasters and their effects in East China have also generated new characteristics, and the sudden, massive and abnormal nature of all kinds of catastrophic and natural disasters are becoming gradually prominent (Kong et al., 2018). In the future, faced with new challenges from meteorological disasters, East China should strengthen the prevention of extremes weather events, address climate risks faced by economic and social development, enhance the relevant monitoring and early warning level, improve the system for meteorological disaster prevention and mitigation, and raise the public’s knowledge of disaster prevention and mitigation (Chen, 2013). This would comprehensively improve the emergency capacity to deal with sudden and catastrophic disasters and promote the establishment of the paradigm of regional comprehensive disaster prevention and mitigation. Meanwhile, the green economic development strategies with energy-saving and emission-reduction must be systematically implemented to fulfill the transformation of economic development mode in order to deal with all kinds of the adverse impacts from meteorological disasters (Kong et al., 2018).
5. Conclusions
In East China, rainstorm-induced flood disasters had the largest number of records of affected population, deaths, affected crops, total crop failure and direct economic loss, and also the largest amount of impacts or losses of population, crop and money, while low and high temperature disasters had less records and impacts during 1984-2010. Anhui was the province with the largest number of affected population, the largest affected area of crops, the largest area of total crop failure and the highest direct economic loss from four types of disasters, and Jiangxi had the highest number of deaths. Shanghai had the least impacts or losses of population, crops and money.
In the past 27 years, the yearly percentage of records of affected crops, total crop failure, affected population and direct economic loss by four types of meteorological disasters increased significantly at rates of 0.6, 1.8, 1.7 and 1.9% per decade, respectively, but the records of deaths decreased significantly at a rate of 1.4% per decade. The yearly percentage of affected population and direct economic loss increased significantly at rates of 1.4 and 2.2% per decade, respectively, but the percentage of deaths decreased significantly at a rate of 2.2% per decade. Neither the area of affected crops nor the area of total crop failure was statistically significant in East China.
Spatially, the total number of records of four types of meteorological disasters was higher in the southern part than in the northern part of East China. In general, Shandong, Jiangsu and Shanghai had fewer disaster records while Anhui, Jiangxi, Fujian and Zhejiang had more. The total number of people affected by four types of meteorological disasters was higher in Anhui and Jiangxi, and the deaths were more in southern Anhui, Jiangxi, Zhejiang and Fujian. Both the affected area and the total failure area of crops were more elevated in northern Anhui, eastern Jiangsu and eastern Shandong Peninsula. The direct economic losses were higher in the southern part of East China and the Anhui province.

