


 nueva página del texto (beta)
 Inglés (pdf)
 Artículo en XML
 Referencias del artículo
 Enviar artículo por email
 Citado por SciELO
  Similares en
SciELO
Similares en
SciELO 
 Permalink
1. Introduction
Climate change is a serious threat to food security worldwide. Agricultural food production plays a fundamental role in the complex system upon which food security relies (Hannah et al., 2017). Impacts on food production have already been observed, while food accessibility and price stability are expected to be impacted (FAO, 2016).
In Mexico, the agricultural sector is highly vulnerable to climate change, particularly small farmers and associated agro-ecosystem services (Hannah et al., 2017). Mexican agriculture has been found to experience high exposure to climate and high socioeconomic sensitivity, which leads to an increased vulnerability to climate change (Monterroso et al., 2014). According to the Encuesta Nacional Agropecuaria 2014 (national agricultural census; INEGI, 2015), the total land area in Mexico with agricultural activity was 27 496 118 ha (14%). Out of this area, 80% is used for rainfed agriculture while only 20% is irrigated. For this reason, changes in precipitation are expected to impact most of the agricultural sector of the country. Crop biological cycles are closely related to the environmental conditions where they grow. Therefore, a change in temperature and precipitation could directly affect their development (Granados et al., 2013). According to different studies conducted on the continent, tropical and subtropical regions are the most susceptible to climate change, even when warming is relatively small (FAO, 2016). Maize, wheat and rice crops in tropical and subtropical regions are susceptible to water availability change driven by warming (FAO, 2016).
Despite numerous efforts to understand the impact of climate change on crop yields, there are still several regions and crops that have not been addressed. Having more and better models will allow the design of policies targeting vulnerable groups, crops and regions (Hannah et al., 2017). Impacts of climate change in Mexico have been studied from four perspectives: change in growing seasons, water needs, change in crop distribution and crop yields (Monterroso et al., 2015). This study will focus on changes in crop yields. Since vulnerability includes adaptive capacity, food security would be more at stake to rainfed agriculture areas, with populations under precarious economic conditions with limited financial, social and natural capital (Monterroso et al., 2014).
The main goal of this study was to model current and future yields of seven staple crops in Mexico using a crop model to determine the impact of climate change on mostly rainfed land productivity. In this way, this work contributes to reduce the information gap that is frequently reported for the country. Also, we contribute to better knowledge on spatial impact of climate change in the country, which can facilitate better policy-oriented programs.
For maize, with climate change, differential decreases in yield from 20 to 40% by 2030 have been reported for most of the national territory (Conde et al., 1997). Only crops in areas of temperate or cold climates may benefit from higher temperatures and longer growing seasons (Conde et al., 2000). Rainfed beans, particularly from the northern states, contribute with 68% o the national volume production. Those states could be affected by a year-to-year climate variability and by decadal El Niño Southern Oscillation (ENSO) occurrences, which can cause losses of up to 30% in yields (Tiscareño et al., 2003). Studies conducted in Durango show possible long-term changes in climate patterns that could result in greater inter-annual variability in yields (Esquivel-Arriaga, 2014). Wheat, the second most important cereal, could be seriously affected by increased drought in the northern region of the country, the main producer region (Arredondo-Moreno and Huber-Sannwald, 2011). Although an apparent increase of 25% over the past two decades in yield has been recorded in certain areas, studies show that the factors associated with this improvement can have highly notable variations (Lobell et al., 2005).
Soybeans, one of the most important oil crops, has not been greatly studied in Mexico under the climate change approach. Studies at similar latitudes in India report decreases of 20 to 30% under climate change scenarios (Singh et al., 2015). For barley, a crop of increasing economic importance, Calderón et al. (2015) reported a study conducted in Tlaxcala in which future yields decreased from 5 to 100% depending on the time horizon of climate change scenarios. Sorghum, the second most important grain in cultivated area in Mexico, has been included in few studies on yields in climate change scenarios, as the case of potato, the most important tuber crop, accounting for 94% of this crop class.
Indirect impacts of losses in yield are related to socioeconomic and demographic variables. It has been reported that one of the effects of decreased yields due to climate change may be migration. Feng et al. (2010) found a significant relationship between climate change, loss of productive potential and migration to the United States. They estimated that for each 10% loss in yield, migration increases 2%, which, when projected with global warming scenarios, by 2080 would mean that 1.4 to 6.7 million Mexicans could be out-migrating. Since vulnerability depends on exposure, sensitivity and adaptive capacity, food security would be most compromised in areas of rainfed agriculture, with populations in precarious economic conditions with limited financial, social and natural capital (Monterroso et al., 2014).
Seven crops were chosen: maize, beans, wheat, soybean, barley, sorghum and potato, all annual crops and grown under rainfed conditions (except for wheat in some locations). Selection was based on historical importance as well as population involved in their production: Maize and beans, the main cereal and legume grown in Mexico, are frequently cultivated in association and are present in many food forms. Rainfed beans contribute 68% of the volume of national production, particularly in the northern states.
Wheat, the second most important cereal, could be seriously affected by increased drought in the northern region of the country, the main producer region (Arredondo-Moreno and Huber-Sannwald, 2011). Although an apparent increase of 25% in yield has been recorded in certain areas, studies show that the factors associated with this improvement can have highly notable variations (Lobell et al., 2005). Soybeans, one of the most important oil crops, has not been greatly studied in Mexico under the climate change approach. Studies at similar latitudes in India report decreases of 20 to 30% under climate change scenarios (Singh et al., 2015). For barley, a crop of increasing economic importance, Calderón et al. (2015) reported a decrease in future yields between 5 and 100%, depending on the time horizon of climate change scenarios, in a study conducted in Tlaxcala. Sorghum, the second most important grain in cultivated area in Mexico, has been included in few studies on yields in climate change scenarios, as the case of potato, the most important tuber crop, accounting for 94% of this crop class.
Per capita consumption of maize is 276 kg and 60% of the total production is used for human food in Mexico. A third of the production is for home consumption. Beans make up 85% of the production of legumes consumed in the country (the remaining 15% includes chickpea and others) and its annual per capita consumption is 10.8 kg (SIAP, 2015). Wheat is the second most important cereal in Mexico, after maize. Although Mexico is a consolidated exporter of crystalline wheat, occupying third place internationally in 2014 (34% of the national production is exported), more than 4.5 million tons of soft wheat is imported (65% of the national consumption) (SIAP, 2015). Soybean is the most important oilseed contributing more than 45% of the country’s edible oil production. Since 2002, soybean production has reported a mean annual growth rate of 22% due mainly to an area expansion following demand (SIAP 2016b). Barley has mainly industrial use and is grown in at least 23 of the 32 states of Mexico, while sorghum is the second crop in area and the third in volume of production; its uses are for livestock and industry (INEGI, 2015). Potatoes make up 94% of the national production of tubers and have been increasingly incorporated in Mexican diets, experimenting a growing trend on imports (INEGI, 2015). Potato is grown practically in 24 of the 32 states of the country.
2. Methods
The methodology was based on the use of the AquaCrop software developed by FAO (http://www.fao.org/nr/water/aquacrop.html). The early versions were released in 2009, and the latest version was developed in 2012. The model was calibrated and later applied to climate change scenarios for crops and case studies. Details of the method are described below.
Models for crop simulations are selected considering the scope of the research and the potential users of the results, but also considering the availability and quality of data needs. In previous studies some of the authors (e.g., Conde et al., 1997) used the Ceres-Maize model, which required daily climatological data (including radiation), detail on soil composition, and crop management. Also, numerical experiments included the CO2 fertilizing effect on maize (C4 plant), and genetic coefficients were assigned and calculated for each maize variety. Several years were needed to complete the databases, and the results can only be associated at a local level. At national level, a method was developed that considered “the most limiting factor from different variables that maize requires to grow”. These factors were compared, resulting in potential areas for maize distribution, classified in four different suitability levels: suitable, moderately suitable, limited suitability and not suitable (Monterroso et al., 2011). In that research, climate change scenarios (Conde, 2011) were used to study the changes in the suitability levels mentioned above.
More recently, authors analyzed the factors that determined current and future vulnerability to climate, developing a model that included more than 60 variables that address exposure, sensitivity and adaptive capacity, and analyzed the changes in that vulnerability over time (Monterroso et al., 2018). In the present study, we center our attention to determine “the sensitivity analysis (which) attempts to directly link future climate change scenarios with its potential effects or impacts” (Monterroso et al., 2011), using the AquaCrop model.
2.1 Crop model calibration
Yields were modeled using the FAO software AquaCrop v. 6.0. This biophysical crop model is oriented towards water use and it simulates annual crop development by using transpiration as an operative variable (Smith and Steduto, 2012). Some of the advantages of AquaCrop are free access to updated software, easy model calibration and acceptable conceptual robustness. It has been tested in diverse parts of the world, and in Mexico it has had good results in terms of reproducing observed yields for grains (Abedinpour et al., 2012; Calderón et al., 2015; Flores-Gallardo et al., 2013; Mkhabela and Bullock, 2012; Todorovic et al., 2009). The choice of the model was also made considering its skills for assessing potential climate change impacts on crops. AquaCrop model has been widely used for modeling crop development worldwide on both micro and regional levels. Several other studies have used AquaCrop for modeling climate change impact on crops, finding good correlations between observed yields and climatic variables such as precipitation (Yang et al., 2017). The model is able to reproduce scenarios of increased atmospheric CO2, therefore simulating the fertilization effect of CO2 on water productivity and leaf growth (Steduto et al., 2009). The effect of elevated CO2 in AquaCrop is simulated through decreased crop transpiration and increased crop water productivity (Vanuytrecht et al., 2011). A basic description of the AquaCrop process is shown in the supplementary material (section SM1, AquaCrop basic description).
AquaCrop requires information in four groups: climate, phenology, crops and soils. Climate information from weather stations was obtained from the CLICOM-CICESE platform (CICESE, 2016). Data collected were from 1980 to 2010 (30 years). Quality control was carried out with the Rhtest and RClimDex framework (López-Díaz et al., 2013). The required phenological information for each crop included 15 variables, all of them obtained through literature review as well as eight variables for crop and soil management (INEGI, 2009, 2014; SAGARPA, 2015a, b). A complete list of variables and their source of information is available in Table SMI of the supplementary material.
Sequenced inter-annual runs were carried out for all crops in order to obtain yields from 1990 to 2011. To calibrate crop models in a base scenario, observed yields reported by the Servicio de Información Agroalimentaria y Pesquera (Agri-Food and Fishing Information Service, SIAP) from 2000 to 2011 were used (SIAP, 2016a). The difference between observed and modeled averages was used as calibration parameter. Correlation indicators between observed and modelled yield were not considered since SIAP yields entail socioeconomic factors that could not be represented in the model.
2.2 Crop selection and case studies
The crops were selected in terms of their contribution to national food security, economic importance, or historical relevance. Crops were divided into basic grains (maize, bean and wheat) and other crops (soybean, barley, sorghum and potato), which are oil or industrial crops (SAGARPA-SIAP, 2014). We define case study as a place or territory with specific combination of climatic, crop, soil and crop management data; and the following criteria were used for selecting case studies: (1) climatic data availability, (2) representative growing areas, and (3) vulnerability to climate change. For each of these crops, two or three weather stations were calibrated and modeled (Fig. 1 numbers in parenthesis). Climatic data availability was checked through the databases available for retrieving meteorological information (CICESE, 2016). We define a meteorological station with sufficient data availability - when it had a minimum of 20 years of meteorological information - as representative of a particular crop growing area when linked to actual land-use maps provided by official data (SIAP, 2016a). We then overlay the selection with the spatial vulnerability to climate change impacts in the Mexican municipalities (SEMARNAT, 2014) in order to select those meteorological stations in most vulnerable municipalities. In total, 22 case studies were analyzed and each one was named after the corresponding meteorological station from where data was obtained. Figure 1 and Table I show the location of the case studies and site name.
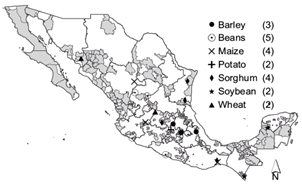
Table I Observed and modeled yield for barley, beans, maize, potato, sorghum, soybean and wheat in 22 case studies.
| Station code | Site | Latitude | Longitude | Mean annual precipitation (mm)* | Mean annual temperature (ºC) * | Data ** | Yield (t/ha) | Mean difference | ||||||||||||||
| 2000 | 2001 | 2002 | 2003 | 2004 | 2005 | 2006 | 2007 | 2008 | 2009 | 2010 | 2011 | Avg | (t/ha) | (%) | ||||||||
| Barley | 15101 | S.M. Tlaixpan State of Mexico | 19º49’N | 98º49’W | 606 | 15.4 | O | 2.13 | 2.5 | 1.24 | 3.73 | 1.68 | 1.49 | 1.81 | 1.4 | 2 | 2.15 | 2 | 1.9 | 2 | 0.03 | 0.70 |
| M | 2.72 | 2.26 | 1 | 3.96 | 2.71 | 1.21 | 0.14 | 2.83 | 3.31 | 2.65 | 0.48 | 1.09 | 2.03 | |||||||||
| 13012 | Huichapan, Hidalgo | 20º39’N | 99º39’W | 428 | 18.4 | O | 0.99 | 0.66 | 1.29 | 1.25 | 0.65 | 0.65 | 0.75 | 0.8 | 0.65 | 0.6 | 0.8 | 0.48 | 0.8 | 0.12 | 15.50 | |
| M | 2.13 | 1.45 | 0.07 | 0.32 | 0 | 0.63 | 1.46 | 1.95 | 2.21 | 0 | 0.49 | 0.35 | 0.92 | |||||||||
| 30128 | Perote, Veracruz | 19º16’N | 97º16’W | 328 | 15.4 | O | — | — | — | 0.46 | 0.6 | 0.4 | 1.1 | 0.6 | 2.15 | 0.7 | — | — | 0.86 | -0.02 | -1.90 | |
| M | — | — | — | 0.77 | 0.43 | 0.79 | 1 | 0.5 | 2 | 0.38 | — | — | 0.84 | |||||||||
| Beans | 32059 | Villa de Cos, Zacatecas | 23º21’N | 102º21’W | 322 | 17.3 | O | 0.22 | 0.2 | 0.53 | 0.42 | 0.41 | 0.1 | 0.51 | 0.24 | 0.37 | 0.09 | 0.16 | 0.1 | 0.28 | 0.22 | 78.40 |
| M | 0.31 | 0.1 | 0.16 | 0.48 | 0.34 | 0.17 | 1.54 | 0.31 | 1.48 | 0.67 | 0.39 | 0 | 0.5 | |||||||||
| 15170 | Chapingo, State of Mexico | 19º53’N | 98º53’W | 510 | 15.4 | O | — | — | — | 1.2 | 1.5 | 1.5 | 1.4 | 1.3 | 1.2 | 0.9 | 1 | — | 1.25 | 0.07 | 5.50 | |
| M | — | — | — | 1.92 | 1.79 | 1.31 | 0.42 | 2.28 | 1.17 | 1.96 | 1.94 | — | 1.6 | |||||||||
| 32054 | Sombrerete, Zacatecas | 23º37’N | 103º37’W | 549 | 14.5 | O | — | — | — | 0.86 | 0.41 | 0.49 | 0.9 | 0.7 | 0.63 | 1 | 0.82 | — | 0.73 | 0.02 | 3.40 | |
| M | — | — | — | 0.82 | 0.82 | 0.59 | 0.83 | 0.65 | 0.82 | 0.71 | 0.78 | — | 0.75 | |||||||||
| 6058 | Tecomán, Colima | 18º53’N | 103º53’W | 769 | 25 | O | — | — | — | 0.56 | 1 | 1.5 | 1.1 | 2 | 1.5 | 0.7 | 1.29 | — | 1.21 | 0.14 | 11.40 | |
| M | — | — | — | 1.63 | 0.84 | 0.99 | 1.66 | 1.66 | 1.28 | 1.47 | 1.62 | — | 1.39 | |||||||||
| Maize | 14017 | Atotonilco, Jalisco | 20º31’N | 102º31’W | 808 | 18.5 | O | 4.96 | 6.51 | 7.38 | 7.56 | 8.47 | 7.6 | 6.85 | 7.74 | 7.77 | 7.51 | 8.54 | 5.72 | 7.22 | -0.64 | -8.80 |
| M | 0.92 | 6.4 | 6.2 | 13.5 | 10.05 | 6.58 | 6.62 | 2.5 | 5.83 | 7.5 | 5.82 | 7.06 | 6.58 | |||||||||
| 20048 | Juchitán de Zaragoza, Oaxaca | 16º2’N | 95º2’W | 924 | 27.5 | O | 1.2 | 1.2 | 1.15 | 0.95 | 0.87 | 0.95 | 0.7 | 1 | 1.2 | 1.5 | 0.51 | 0.66 | 0.99 | 0.35 | 35.00 | |
| M | 1.23 | 1.38 | 1.36 | 1.25 | 1.19 | 1.27 | 1.18 | 1.44 | 1.45 | 1.29 | 1.52 | 1.49 | 1.34 | |||||||||
| 10012 | Cuencamé, Durango | 24º40’N | 103º40’W | 241 | 18.4 | O | 0.56 | 0.5 | 0.81 | 1.2 | 1.1 | 0 | 1.1 | 0.85 | 1.1 | — | — | — | 0.8 | 0.01 | 0.80 | |
| M | 0.29 | 0.53 | 0.27 | 1.09 | 0.33 | 0.29 | 2.4 | 0.56 | 1.52 | — | — | — | 0.81 | |||||||||
| 15170 | Chapingo, State of Mexico | 19º53’N | 98º53’W | 510 | 15.4 | O | — | — | — | 4.03 | 3.22 | 3.08 | 2.95 | 3.25 | 2.92 | 2.8 | 3.18 | — | 3.18 | 0.06 | 2.00 | |
| M | — | — | — | 3.82 | 3.64 | 2.29 | 2.35 | 3.82 | 2.61 | 3.74 | 3.67 | — | 3.24 | |||||||||
| Potato | 15009 | Atlacomulco, State of Mexico | 19º53’N | 99º53’W | 702 | 14.2 | O | — | — | — | 18 | 18.5 | 22 | 16.9 | 17.3 | 17.2 | — | — | — | 18.32 | -0.15 | -0.80 |
| M | — | — | — | 17.96 | 18.02 | 18.11 | 18.2 | 18.27 | 18.34 | — | — | — | 18.15 | |||||||||
| 30128 | Perote, Veracruz | 19º16’N | 97º16’W | 328 | 15.4 | O | — | — | — | 13 | 8 | 13 | 15 | 14.02 | 14 | 9.09 | 18 | — | 13.01 | -1.68 | -13.70 | |
| M | — | — | — | 8.24 | 5.99 | 12.93 | 9.59 | 14.99 | 11.84 | 10.78 | 6.94 | — | 10.16 | |||||||||
| Sorghum | 20039 | Ixtepec, Oaxaca | 16°6’N | 95°6’W | 855 | 27.5 | O | 2.5 | 2.8 | 3.03 | 1.7 | 1.2 | 1.2 | 1 | 1 | 3 | 3 | 2.41 | 1.9 | 2.06 | 0.05 | 2.30 |
| M | 2.39 | 2.22 | 2.04 | 1.92 | 2.27 | 2.52 | 1.86 | 2 | 1.94 | 1.95 | 2.05 | 2.14 | 2.11 | |||||||||
| 28035 | González, Tamaulipas | 22°26’N | 98°26’W | 859 | 24.5 | O | 2.1 | 2.22 | 1.57 | 1.92 | 1.05 | 2.11 | 0.96 | 1.68 | 2.5 | 2.9 | 1.2 | 1.3 | 1.79 | 0.28 | 15.40 | |
| M | 2.19 | 2.35 | 2.37 | 2.5 | 1.11 | 2.53 | 2.41 | 1.05 | 1.85 | 1.6 | 2.52 | 2.35 | 2.07 | |||||||||
| 11009 | Celaya, Guanajuato | 20°49’N | 100°49’W | 606 | 18.5 | O | — | — | — | 8.2 | 7.3 | 8.5 | 6.7 | 6 | 5.8 | 8.7 | 6.6 | — | 7.23 | 0.27 | 3.70 | |
| M | — | — | — | 7.36 | 6.69 | 8.21 | 6.84 | 8.02 | 8.14 | 6.03 | 6.94 | — | 7.28 | |||||||||
| 28086 | San Fernando, Tamaulipas | 24°9’N | 98°9’W | 659 | 23.6 | O | — | — | — | 2.5 | 2.5 | 3.4 | 2 | 2.1 | 2.2 | 1.6 | 2.5 | — | 2.35 | 0.17 | 7.30 | |
| M | — | — | — | 3.83 | 2.52 | 1.02 | 2.01 | 1.42 | 2.96 | 2.82 | 3.59 | — | 2.52 | |||||||||
| Soybean | 7191 | Tapachula, Chiapas | 14°16’N | 92°16’W | 3648 | 26.2 | O | 2.39 | 2.3 | 2.34 | 2.5 | 2.35 | 1.8 | 1.93 | 1.93 | 2.52 | 0 | 1.75 | — | 1.98 | -0.02 | -1.00 |
| M | 1.92 | 1.93 | 1.94 | 1.95 | 1.96 | 1.97 | 1.98 | 1.98 | 1.98 | 1.99 | 2 | — | 1.96 | |||||||||
| 4001 | Bolonchén, Campeche | 20°49’N | 89°49’W | 1095 | 25.7 | O | 2.46 | 1.49 | 1.8 | 1.1 | 2.5 | 1.51 | 0.65 | 1.64 | 2.29 | 2.45 | 1.53 | 2.25 | 1.81 | 0.24 | 13.50 | |
| M | 2.58 | 0.25 | 0.91 | 2.05 | 0.52 | 3.22 | 0.44 | 2.64 | 2.95 | 1.23 | 1.14 | 3.27 | 1.77 | |||||||||
| Wheat | 11050 | Ocampo, Guanajuato | 21°31’N | 101°31’W | 533 | 15.2 | O | 0.24 | 0.85 | 0.97 | 0.9 | 2 | 1.5 | 3 | 1.3 | 1.2 | 0.6 | 0.7 | 1 | 1.19 | 0.14 | 11.80 |
| M | 0.35 | 0.58 | 2.72 | 2.78 | 2.64 | 0.45 | 0.79 | 0.37 | 1.1 | 2.1 | 0.71 | 1.35 | 1.33 | |||||||||
| 26102 | Tres Hermanos, Sonora | 27°12’N | 109°12’W | 660 | 23.3 | O | 5.4 | 5.68 | 5.92 | 5 | 6.1 | 5.2 | 6 | 6.1 | 6.1 | 5.38 | 6.26 | 5.49 | 5.72 | -0.31 | -5.40 | |
| M | 4.9 | 5.2 | 5.4 | 5.6 | 5.7 | 6.04 | 5.1 | 5.4 | 5.3 | 5.2 | 5.8 | 5.3 | 5.41 | |||||||||
*Temperature and precipitation were averaged for 30 years
**O: observed yield (SIAP, 2015); M: modeled yield (this study).
2.3 Climate change scenarios
To determine yields with climate change scenarios, climate data corresponding to each model was updated, while soil, phenology and management information was considered constant in order to model the impact of climate itself. In addition, future climate variability was not considered, only that coming from the models. The climate change scenarios were five GCM: CNRM, GFDL, HadGEM, MPI and the Reliable Ensemble Averaging (REA), with two representative concentration pathways (RCP) (4.5 and 8.5 W m-2) and three time-horizons (2015-2039, 2045-2069 and 2075-2099). Climate data was retrieved from the project INECC-CCA/UNAM with climate anomalies already included in the datasets of future horizons (INECC-CCA, 2014). In this paper, we refer as near time horizon to the 2015-2039 period; medium time horizon to the 2045-2069 period; and far time horizon to the 2075-2099 period. In total, 28 climate change scenarios were considered (REA Ensemble is not available for the medium time horizon) and implemented for each case study. The rationale behind the scenario selection was that these GCM are commonly used in climate change impact studies in Mexico and by national communications to the United Nations Framework Convention on Climate Change (SEMARNAT 2006, 2009) therefore they are available. We selected from near to far time horizons in order to test the sensitivity of crops whose consumption is not likely to decrease even in the long-term. Calculation of evapotranspiration with climate change followed the same methodology as the base scenario, and the CO2 concentration under different RCP was provided by the program. For each scenario, future monthly precipitation, temperature, evapotranspiration and CO2 replaced observed data and projected yields were calculated. Planting dates for future scenarios were set the same as for the baseline scenario. The only changing conditions for future scenarios were therefore the climatic variables of temperature and precipitation, aiming to assess the impact of climate-only changes. Thus, no adaptive changes were modeled.
3. Results
3.1 Model calibration
Table I shows historical observed and modeled averaged yields for the 22 case studies. Most of them showed differences between historical observed and modeled yields no higher than 15%, thus considered an acceptable calibration for this study. The yields were averaged only for comparison purposes, being the year-to-year simulation different in climate data and yields. Among different crops, wheat and sorghum were more closely reproducing the observed yields. Beans’ case studies showed the highest difference between observed and modeled yield. However, only six out of 22 case studies showed a difference between observed and modeled yields higher than 10%. Therefore, we consider that the results are adjusted to the conditions observed and it is possible to apply AquaCrop with climate change scenarios.
3.2 Changes in future yield
In Mexico, climate change impacts on crop productivity are directly related to precipitation amount and spatial distribution. For most of the weather stations analyzed, precipitation is expected to decrease and undergo changes in intra-annual distribution. Globally, the models that project greatest impact (reductions in yields) were GFDL and HadGEM; those that predict little impact were MPI and CNRM, while the REA Ensemble predicted very low impact on the crop model. Figure 2 shows the yield change with climate change scenarios for case studies of maize, beans and wheat.

Fig. 2 Estimated yield change for maize, beans and wheat in Mexico (white bars for RCP 4.5 and gray bars for RCP 8.5; bars represent multimodel means and error bars max and min values).
Throughout the country, cultivation of maize under rainfed conditions differs in terms of management, genetics and climate conditions. In the case of temperate climates in central Mexico, it was found that changes in yields are uncertain in the short term with possibilities of gains or losses. However, losses are accentuated in more distant time horizons. Yield would increase in central and western Mexico by 33% and 50% for Jalisco and Estado de Mexico, respectively, according to the most optimistic model in the near time horizon.
Maize in warm and dry climates shows more marked effects than in temperate climates. For northern Mexico, in Durango, 28 scenarios agree with decreases in yield from -48 to -84%, for the most extreme models in the far time horizon. Considering that the current average yield is 0.76 t/ha-1, the potential impact of climate change could lead to a harvest that is less than 0.20 t/ha-1, according to the worst scenario in the distant future. This is explained by an estimated decrease in biomass production of about -40% for the near time horizon. Water stress affecting canopy expansion would increase between 14 and 41% under climate change conditions. Figures SM1 and SM2 of the supplementary material show monthly precipitation and total biomass production.
Beans under climate change conditions varied highly across cases. Only one out of the four case studies showed increases in yield (Sombrerete, Zacatecas) of 4.16 t/ha-1 for the least severe scenario; historical yield was only 0.71 t/ha-1. In contrast, Villa de Cos, Zacatecas had a decrease of -5% in the near time horizon, relative to the base scenario, with the HadGEM-RCP 4.5 model, while the most drastic decrease (-63%) was projected by the CNRM-RCP 8.5 model to the farthest time horizon. This is supported by the change in biomass between -36 and -52%; the CNRM-RCP 4.5 is the scenario with the greatest impact and the REA-RCP 8.5 has the lowest impact. This decrease may be due to water stress, which affects plant cover, passing from -53% of the base scenario to -70%, according to several climate change scenarios.
Bean cultivation in temperate climates, such as in central Mexico at Chapingo, Estado de Mexico can expect drastic decreases of up to -100% in most scenarios. According to the calibrated crop model, the factor responsible for this decrease could be the increase in water stress in the first stages of crop development, affecting optimal production by 43 to 68% and causing a decrease in water productivity.
Wheat yields in Mexico have experienced increases in recent decades, although much of this increase may be due to irrigation and the use of agrochemicals. Yield could be affected from the near time horizon with reductions of -3 and -15%, according to the CNRM and GFDL models, respectively. Productive potential will decrease in the far future showing reductions in yields of -15 and -28%, according to the MPI and HadGEM models under an RCP 8.5. The above is congruent with what was found for biomass formation, which could expect decreases of -3 to -15% for the near and far time horizons, respectively, in Tres Hermanos, Sonora. Despite at least four irrigations during the development period (as recommended by the software), water stress from 20 to 30% will occur in most of the climate change scenarios. Moreover, in one of the most drastic scenarios, water productivity will decrease from 1.32 to 0.99 g m-2 in the far time horizon.
Soybean in our study was modeled under rainfed conditions in two sites of southern and southeastern Mexico with warm climate. For both sites, an increase in potential yield was projected, according to most of the climate change scenarios. The station analyzed in the Yucatán Peninsula showed increases in yield of up to 57%, according to the most favorable model for the far future, which was GFDL-RCP 4.5. Nevertheless, increases with an RCP 8.5 showed more moderate increases, between 20 and 49%, relative to the historical scenario. Most of the far time horizon scenarios report increases in soybean yields in Tapachula, Chiapas, although in the near future changes between -8 and +6% are expected. Even in scenarios of positive impact on the far time horizon, increments in yield would be only 19% for models such as CNRM and GFDL. It has been established that climate change could benefit soybean cultivation in medium and high latitudes. Figure 3 shows climate change yields for the case studies of soybeans, sorghum, barley and potatoes.

Fig. 3 Estimated yield changes for soybean, sorghum, barley and potato in Mexico (white bars for RCP 4.5 and gray bars for RCP 8.5; bars represent multimodel means and error bars max and min values).
Sorghum was evaluated in four sites located in warm and semi-dry climates. All the cases projected reductions in yields for most of the climate change scenarios, placing this crop in the category of highly susceptible to climate change. It should be noted that the crop is C4 photosynthesis, which means is not affected by CO2 fertilization and have high optimal temperature that makes water use more efficient. Tamaulipas, the state that concentrates almost half of the country’s sorghum production, could have decreases in yields according to the results of two cases in the municipalities of San Fernando and González. Changes in yield in González could experiment decreases of around -50 % in the near time horizon, according to the MPI model and the REA Ensemble with an RCP 8.5. In the far future, most of the models predict decreases of -65 and -75% for the two RCPs. The impact at the San Fernando station could be even more serious since for the far time horizon in an RCP 8.5 three of five models agree on a -100% decrease.
Sorghum is an important crop in central Mexico. For the station in Celaya, Guanajuato, losses from -25% for the near time horizon up to -53% for the far time horizon are expected by some of the models with an RCP 8.5. In the isthmus region of Oaxaca, sorghum has been introduced as a secondary crop that supports incomes in combination with other crops. According to the crop model in Ixtepec, Oaxaca, decreases of -30 and -64% can be expected for the near and far time horizons, respectively, according to some of the models. Considering that the yield in this area is around 2.3 t ha-1, the decreases mean that between 1.6 and 0.83 t ha-1 will be harvested.
Barley was modeled in three sites of central Mexico. The State of Mexico ranks fifth at national level in barley production (SIAP, 2016a). Barley is grown mostly under rainfed conditions. The case study modeled in S.M. Tlaixpan indicates that on a near time horizon, yield could be benefited with an increment of 12% to 43%, according to most of the models with an RCP of 4.5 W m2. Nevertheless, on the medium time horizon, this gain is lost and most of the models predict yields similar to the historical scenario. Higher CO2 in the atmosphere may fertilize plant growth, but it has been shown that other conditions (soil nutrients) will become limited. For the far time horizon and an RCP 8.5, the situation is inverted and decreases of -45 and -92% could be expected, according to the MPI and GFDL models, respectively.
Results of the barley case in Perote, Veracruz, indicate a yield decrease on the near time horizon, particularly with RCP 4.5 W m-2 scenarios. In contrast, the barley model in Huichapan, Hidalgo projected generalized increases of more than 100% in most of the models. A parameter that helps to explain this exponential growth is water productivity, which will increase from 0.29 to 0.60 g m-2.
Potato production was modeled in two case studies located in central Mexico. The decrease in precipitation in Perote, Veracruz, could be more than -50% in most of the scenarios, even in near time horizons, and thus water stress may increase from -45 to -66% on the far time horizon, according to most of the models. Consequently, the biomass produced could be affected by decreases of -34%, for the MPI model on the near time horizon, and up to -57% less on the far time horizon, according to the GFDL model. In the potato case in Atlacomulco, State of Mexico, a gradual decrease in yield along the time horizons was found. According to several scenarios on the far time horizon with RCP 8.5 W m-2, yields will decrease between 30 and 50%. The case study modeled for Perote, Veracruz coincides with the diminishing trend, although the most drastic scenarios predict decreases of -53 and -60%, according to the CNRM and GFDL models, respectively.
4. Discussion
4.1 Model selection and calibration
In many studies, observed yields are retrieved from governmental-based databases (Yang et al., 2017). Methodologies for collecting data at national level often implies a generalization and averaging of the local conditions (SIAP, 2016b). Therefore, the observed yield retrieved from available official databases might not have the similar resolution as the site-specific experiments of a crop model. For instance, yield differences are not considered due to levels of fertilization. This might partially explain that some of the study cases reported differences in averaged yields higher than 15%. In order to deal with this difference of details we decided to use only the average inter-annual yield for model calibration purposes.
Planting dates were kept constant in both historical and future scenarios. In reality, planting dates are dynamically chosen according to the rainy season. Keeping planting dates constant aimed to assess the impact of climate (precipitation and temperature) only. Therefore, results in both historical and future scenarios are comparable.
4.2 Impact of climate change on yields
Some studies have reported that temperate regions could receive beneficial effects on crop phenology through the increase of growing degree days available per year, as a result of an increase in temperature. Our results are consistent with a study on maize in a temperate climate region (Tlaxco, Tlaxcala), where it was found that minimum temperature tended to increase; this would extend the growing season, fostering maize production (Conde, 2011). A study conducted at the Distrito de Desarrollo Rural de Toluca, State of Mexico reports that for the Hadley A2 and B2 models, a slight increase in temperature by 2050 will benefit the phenological cycle of maize by diminishing frosts. Nevertheless, the study underlines that the decrease in precipitation would prevent taking advantage of the favorable temperatures (Granados et al., 2013). In a previous national study reported by Conde et al. (1997), maize yield was analyzed under conditions of climate change; they found that in most of the sites the effects would be negative, particularly in the ripening phase. Moreover, they emphasize that climate impacts will be derived not only from climate change by itself, but also from an increase in extreme climatic events. These findings are in line with the cases modeled in our research, highlighting the importance of developing adaptation strategies according to local conditions.
Climate change impacts on beans productivity have not been reported frequently in the literature. A study on maize in the state of Durango suggests that changes in climate would result in an increase in yield of 0.3 t ha-1 resulting from bimodal behavior of precipitation (Sánchez-Cohen et al., 2018). This finding contrasts with our modeled results for Durango, where we found decreases in the expected yield. Nevertheless, the above-mentioned study used local stochastic methodologies and did not consider the latest general models of atmospheric circulation. In another research, Esquivel-Arriaga (2014) used the EPIC software to model beans yields in Durango, considering two planting dates under A2 and A1B climate change scenarios, and estimated losses and gains in yields. He predicted that on average the same yields would be maintained if conventional cultural practices are kept.
The northwestern region of Mexico is where most of the country’s wheat is produced. The yields in those regions are 5.3 t ha-1 with irrigation conditions. However, indiscriminate use of agrochemicals and low efficiency of irrigation are causes of soil degradation, which may become more acute under climate change conditions (IMTA, 2014). In a study conducted in the Yaqui and Mayo valleys of Sonora and San Luis Río Colorado in Baja California, two of the largest producers of wheat in the country, an increase in yields was found due to cooler night temperatures during the vegetative period. Considering that climate change scenarios involve a generalized increase in temperature, the probable gain in wheat yield in this region may not hold for the upcoming decades (Lobell et al., 2005). These findings are congruent with our results, since yield analyzed in the Sonora case study showed decreases even with current irrigation techniques.
Case studies of soybean showed potential increases in yields under climate change scenarios. To this matter, a research conducted in the Great Lakes region of the United States indicates that yields will increase up to 120%, relative to the base scenario, due to carbon dioxide fertilization. Nevertheless, it is highlighted that lower latitudes may experience yield decreases (Southworth et al., 2002).
Sorghum turned out to be one of the most negatively impacted crops by climate change scenarios. From the literature it is highlighted that changes in climate, even in current years, have motivated the generation of resistant varieties, especially for Tamaulipas (Montes et al., 2018). Because of the different uses of sorghum and its agro-industrial importance, economic adaptation measures such as contract agriculture have recently been explored. Nevertheless, even in a base scenario, it has been found that these systems are highly vulnerable because contracts are not met due to adverse climate (Echánove-Huacuja, 2012). Therefore, local adaptation measures are required in order to prevent sorghum shortage in the future.
Few studies have been conducted regarding climate change impacts on barley yields in Mexico. A study conducted in Tlaxcala by Calderón et al. (2015) used the AquaCrop software to model barley yields with six climate change scenarios and to estimate the future benefit-cost ratio. They found that future yields will decrease from -5 to -100% depending on the time horizon, while the benefit-cost ratio will be reduced from 1.4 to 0, affecting the economy of the region’s farmers. These findings are coherent with the two cases developed in our research. This is particularly critical for the far time horizon, where the strongest decrease in yield is expected.
4.3 Potential social and economic implications
The biophysical and economic implications of the impacts of climate change on yields can be of large dimensions, especially for subsistence agriculture. If it is totally dependent on rain for production, the drastic changes and extreme climate events can affect rainfed crops relatively much more than irrigated crops. According to the study conducted by Gabriel (2003), the socioeconomic level of the population that lives in the 1232 municipalities with subsistence agriculture is very low, and it is estimated that 70% of the population of these municipalities are directly related to primary activities. Nelson et al. (2014) modeled some economic impacts on agriculture as a result of climate change. They found that by 2050 maize, rice and wheat global prices will increase by 87, 31 and 44%, respectively. However, to model the biophysical yield, they used a grid with a spatial resolution of 0.5 × 0.5, which indicates that the study was conducted at small scales. In another global economic research, it was found that food prices could increase by 19% due to changes in temperature and precipitation, or by 6% even with the beneficial effect of CO2 on production (also considering changes in price elasticity for demand) (Lobell et al., 2011).
A situation that encompasses the dimensions of food security and poses maize as a crop of special attention is Mexico’s commercial dependence on other countries, such as the United States. According to Turrent et al. (2010), the dependence on maize food, understood as the difference between imports and exports, has evolved from 20% during the period 1995-1999 to 32% in 2005-2008. According to the projections of these authors, by 2025, this dependence is expected to have reached 45 to 50% of all the maize consumed in Mexico. An independent estimation, based on official data, found that Mexico’s maize dependence was 30% in 2014. Considering the per capita consumption reported for 2014 and the number of inhabitants counted in the 2015 census, the national demand for maize was around 33.1 million tons. However, in 2014 only 23.3 million tons were produced, leaving a deficit of 9.8 million tons, which required 1920 million dollars in maize imports (SIAP, 2015).
Most of the studies have concentrated on the staple crops of maize, beans or wheat. Maize and beans, the main cereal and legume grown in Mexico, respectively, are frequently cultivated in association and they are present in many food forms. For maize, with climate change, differential decreases in yield from 20 to 40% have been reported for most of the national territory, assuming arbitrary changes in precipitation (±20%) and temperature (+2 ºC, +4 ºC), followed by two General Circulation Models (Conde et al., 1997). Only crops in areas of temperate or cold climates may benefit from higher temperatures and longer growing seasons (Conde et al., 2000).
Beans grown under rainfed conditions contribute 68% of the volume of national production, particularly in the northern states. However, these states could be affected due to ENSO, which can cause losses of up to 30% in yields (Tiscareño et al., 2003). Studies conducted in Durango, Mexico show possible changes in climate patterns that could result in greater inter-annual variability in yields (Esquivel-Arriaga, 2014). Together, ENSO and climate change will result in high exposure of rainfed beans. Wheat, the second most important cereal, could be seriously affected by increased drought in the northern region of the country, the main producer-region (Arredondo-Moreno and Huber-Sannwald, 2011). Although an increase in wheat yield has been recorded since 1980 for some regions, cultivar improvement, crop management or policy reforms may play an important role in this trend (Lobell et al., 2005).
Soybeans, one of the most important oil crops, have not been greatly studied in Mexico under a climate change approach. Studies at similar latitudes in India report decreases of 20 to 30% under climate change scenarios (Singh et al., 2015). Barley is a crop of increasing economic importance. Calderón (2015) found a decrease from 5 to 100% on barley yields in Tlaxcala, Mexico, depending on the time horizon of climate change scenarios. Sorghum, the second most important grain grown in Mexico, has been included in few studies on yields in climate change scenarios, as the case of potato, the most important tuber crop, accounting for 94% of this crop class.
5. Conclusions
Decreases in yields for most crops are expected. Maize, sorghum, wheat and potatoes are projected with decreases in yield in all crop locations. Barley and beans will have decreases in some sites and light increases in others. Soybean is expected to have increases in two of the modeled locations. The biggest impacts are found for RCP 8.5 and the far horizon.
It was corroborated that water productivity will decrease for most of the studied crops, therefore, water requirements will be higher starting from the near-time horizon. During the phenological development of the crops, water stress was the factor that most contributed to biomass loss, especially in the initial growth phase. Some case studies show low yield conditions from the base scenario, and these cases under climate change conditions are expected to be the most impacted. Some cold climate sites could have a higher biomass production potential, benefiting from an increase in the growing season, although water availability would limit this advantage. An increase in the concentration of carbon dioxide could lead to higher productivity, although water demand would increase. Losses in yield were found for most of the seven modeled crops, especially for maize and wheat. Beans and barley present cases in which yield increases or decreases, and only for soybeans are gains projected in regions of high rainfall.
Climate change impacts are expected differently depending on the crop or region in the country, but technological advances and adaptation strategies with respect to the environment can be included to lessen its consequences. More experimental studies are needed to help understand the impact of climate change on crop development, particularly with the aim of promoting timely adaptation.

