


 nueva página del texto (beta)
 Inglés (pdf)
 Artículo en XML
 Referencias del artículo
 Enviar artículo por email
 Citado por SciELO
  Similares en
SciELO
Similares en
SciELO 
 Permalink
1. Introduction
The North Atlantic Subtropical High (NASH) system has intensified over the last 40 years, associated with anthropogenic warming, extending its western ridge further west (Li et al., 2011; Díaz-Esteban and Raga, 2018). The NAHS has a direct effect over the regional coastal climate, as shown by Zhu and Liang (2013) over the eastern United States. To characterize the NASH variability, Zhu and Liang (2013) used an index that is the result of a sea-level pressure gradient between two specific locations: Bermuda (40º N, 60º W) and New Orleans (30º N, 90º W). Previous studies computed a similar index using the location of New Orleans but different locations near Bermuda, such as (32.5º N, 65º W) by Katz et al. (2003) and (35º N, 65º W) by Ortegren et al. (2011). Those studies indicate that positive values of the Bermuda Index corresponded to the westward displacement of the western edge of the NASH from its normal position (Katz et al., 2003).
A coral reef corridor lies close to the shore along the southwestern Gulf of Mexico, with coastal lagoons, mangroves, and towns in the state of Veracruz, Mexico. Human activities along this coastline depend on fishing, tourism, oil, gas and commercial pier activities (Jordán-Dahlgren and Rodríguez-Martínez, 2003; Tunnell et al., 2007; Jiménez-Badillo, 2007; Mendoza-Cantú et al., 2011). Yet, ecosystems’ functions are threatened, among other forcing factors, by the effects of climate change driving extreme climatic events (Moberg and Folke, 1999; Hoegh-Guldberg et al., 2007), threatening also the lives of over seven million people along the coastline (INEGI, 2010). A good understanding of local scale present climate variability is crucial to understand and predict future scenarios and to design adaptation strategies (Adger et al., 2005; Tang et al.,2010; Pandolfi et al., 2011; Palumbi et al., 2014). The climate of the reef corridor of the southwestern Gulf of Mexico could be influenced by the westward displacement of the NASH. This regional climate variability could influence changes in coastal ecosystems, from coral bleaching events and coral-disease epizootics, to even life-threatening extreme weather events. Thus, one hypothesis of this study is that regional climate fluctuations on the reef corridor of the southwestern Gulf of Mexico are potentially driven by the NASH displacement further west than its normal position (Fig. 1).
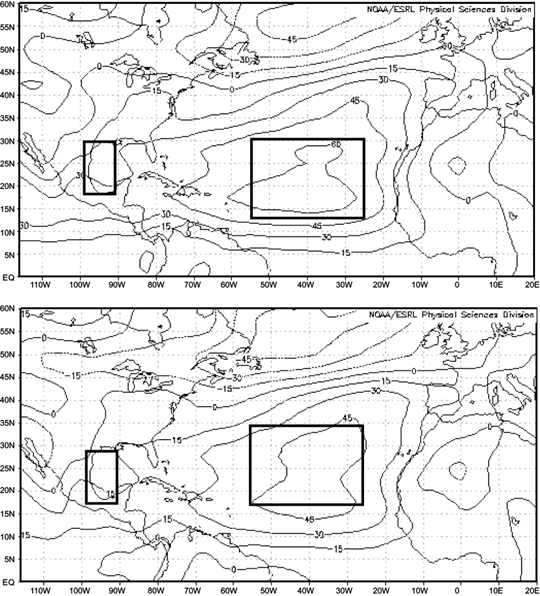
Fig. 1 Anomalous mean sea-level-pressure field derived from daily maps for a 66-year period. Upper panel: 1948 to 1979; lower panel: 1980 to 2015. Note the displacement of the NASH between these two periods over the Atlantic Ocean (black squares) and Gulf of Mexico, and the consequent displacement around the Veracruz coast (black rectangles). Image provided by the Physical Sciences Division, ESRL/NOAA, from their website athttp://www.esrl.noaa.gov/psd/
Atmospheric and oceanic teleconnections from the tropics and extra-tropics may also modulate climate variability in the Gulf of Mexico on a broader range of time and spatial scales (Kucharski et al., 2010). Teleconnections of the El Niño Southern Oscillation (ENSO) and the North Atlantic Oscillation (NAO) could influence climate variability in the Gulf of Mexico associated with the location and strength of the NASH. Such oscillations could influence regional air temperature and precipitation in areas of the basin particularly sensitive to floods/droughts (Saravanan and Chang, 2000; Stahle and Cleaveland, 1992; Salas-Pérez and González-Gándara, 2016).
Tett et al. (2002) strongly suggest that anthropogenic forcing (by tropospheric ozone, well-mixed greenhouse gases alone, sulfate aerosol) over the worldwide climate have been the dominant cause of air temperature changes over 30-50 years around the world, following a periodicity related to the Multidecadal Atlantic Oscillation (AMO). However, natural forcing like solar irradiance and stratospheric aerosol due to explosive volcanic eruptions could influence climate variability in smaller proportions. Thus at large scale, climate variability response to anthropogenic and natural forcing could cause temperature changes at regional and local scales too. In conjunction, these signals could potentially affect climate anomalies and trends on the three main areas of the Veracruz-reef systems of the reef corridor of the southwestern Gulf of Mexico: Sistema Arrecifal Lobos-Tuxpan (SALT, Spanish acronym), Parque Nacional Sistema Arrecifal Veracruzano (PNSAV) and Los Tuxtlas reefs (Jordán-Garza et al., 2017; Salas-Pérez and Jordán-Garza, 2018). Because it is unclear how local climate will follow global climate trends, this study analyzed trends of key selected climate variables from two meteorological stations next to the three main Veracruz-reef systems: Tuxpan, Veracruz and Coatzacoalcos, using the National Center for Environmental Predictions and North American Regional Reanalysis (NCEP-NARR) model (Mesinger et al., 2006). The objectives of the study were to (1) identify common oscillations of local climate variables and the North Atlantic High-pressure System (NASH); (2) characterize local trends of climate anomalies at three locations (north, central, south) along the coastal Veracruz; and (3) identify return periods of climatic anomalies.
2. Materials and methods
2.1 Study region and data sets
The reef corridor is in the central part of the southwestern Gulf of Mexico (Fig. 2). Numerous rivers, wetlands and lagoons characterize the coastal area (Carricart-Ganivet and Merino, 2001; Rivera-Guzmán et al., 2014; Salas-Pérez and González-Gándara, 2016; Salas-Pérez and Jordán-Garza, 2018). Despite conditions driven by river discharges that cause high variability in turbidity, temperature, salinity, etc. (Salas-Pérez et al., 2008; Jordán-Garza et al., 2017), numerous reefs have developed and are distributed in the abovementioned three main systems (Fig. 2).
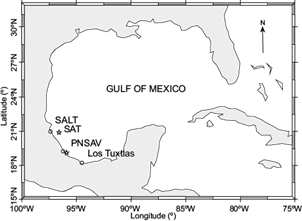
Fig. 2 Reef corridor of the southwestern Gulf of Mexico showing the three main reef systems: Tuxpan (SALT), Veracruz (PNSAV) and Coatzacoalcos (Los Tuxtlas). The meteorological stations and the NCEP-NARR model grids are shown with pentagrams and circles, respectively.
Daily time series for air temperature, relative humidity and atmospheric pressure at mean sea level dating from 1980 to 2015 were provided by the Servicio Meteorologico Nacional (National Weather Service) and the Comisión Nacional del Agua (National Water Commission). These data came from the Tuxpan (north) and Veracruz (central) meteorological stations (Fig. 2). The data sets were inspected for outliers (values larger than three standard deviations from the mean) and missing daily values were replaced using linear interpolation (Salas-Pérez et al., 2007, 2012). No station data were available neither for Coatzacoalcos nor for rainfall at any location. Thus, NCEP-NARR modeled data were downloaded from their site at http://www.esrl.noaa.gov/psd/data. To select the data, three reanalysis grid points were selected around the study zones (Fig 2). The distance between the reanalysis grid points to the meteorological stations was 8 and 4 km for Tuxpan and 1 and 4 km for Veracruz (Fig. 2).
Also, a matching daily time series (1980-2015) of the atmospheric pressure at mean sea level of the NASH (32º N and 66º W) was obtained from the NCEP-NARR node at http://www.cgd.ucar.edu/cas/catalog/climind/index.html (Messinger et al., 2006).
2.2 Data analysis
The in-situ data of air temperature and relative humidity from Tuxpan and Veracruz were compared with the model data using a mean squared error:
where y i and x i are the data from each time series and N is the number of observations of the time series. Descriptive statistics (mean and standard deviation) and the MSE comparing the air temperature and relative humidity time series are shown in Table I for Tuxpan and Veracruz and in Figure 1 of the supplementary material (Fig. SM-1).
Table I Mean values (± standard deviation) and mean squared error (MSE) of in situ and modeled (NCEP-NARR) data for Tuxpan and Veracruz.
| Tuxpan (in situ) | Tuxpan (modeled) | Veracruz (in situ) | Veracruz (modeled) | Tuxpan, Vercaruz (MSE) | |
| Air temperature (ºC) | 24.27 ± 2.44 | 23.99 ± 3.08 | 25.44 ± 2.15 | 24.12 ± 2.21 | 2.89 ± 1.15 |
| Relative humidity (%) | 77.24 ± 9.62 | 78.24 ± 9.62 | 75.19 ± 8.43 | 78.19 ± 8.43 | 0.90 ± 2.85 |
Although no in situ rainfall data was available, several studies have shown that the NCEP-NARR rainfall data is reliable at local scales (Kalnay et al., 1996; Nieto et al., 2004; Messinger et al., 2006; Tolika et al., 2006; Ruane, 2010; Salas-Pérez and González-Gándara, 2016). In this study, the time series of the Bermuda Index is computed from daily mean sea level pressure at 32º N, 66º W, minus the Tuxpan reefs (20.999º N, 97.348º W), Veracruz (19.285º N, 96.208º W) and Coatzacoalcos (18.248º N, 94.465º W).
To understand local climate variability related to large-scale processes, the time series of air temperature, relative humidity and rainfall were correlated with time series of the NASH through a wavelet coherence analysis with zero-time lag (Grinsted et al., 2004). Wavelet coherence allows investigating the temporal variation of the correlation between two signals in a cross-spectral density diagram. A near-zero coherence indicates no linear relationship between the series while a value close to 1 indicates linear relationship (Labat et al., 2005). The period and time of occurrence of significant coherence are depicted by a thick black line in the wavelet maps. Also, arrows within the contour lines indicate if the series were in phase (arrows pointing right), anti-phase (arrows pointing left), or if one series is lead by 90º (arrows pointing down) or vice versa (arrows pointing up). The analysis was done using Matlab (2017).
Seasonal means from the daily time series of air temperature, relative humidity, and rainfall were calculated and then anomalies were obtained for each time series (i) using Eq. (2):
where a
it
is the anomaly of series i at time t, x
it
is a datum of series i at time t, and
The maximum positive and negative seasonal climate anomalies per year were selected to from annual minima and maxima time series:
where Y maxsummeri and Y minwinteri represent the maximum values of positive and negative anomalies selected to form the i annual time-series.
Linear trends for each maximum positive and negative time series anomalies were estimated using a generalized least squares regression that accounts for autocorrelation in the residual series (Cowpertwait and Metcalfe, 2009). The analysis was done using the “nlme” library (Pinheiro et al. 2016) in R (R Core Team, 2016).
Using the maximum positive and negative data of the seasonal climate anomalies, two new yearly times series were constructed. These time series depict the extreme anomalies that occurred during the summer (positive, maxima) and winter (negative, maxima) for the 35-year data set. These extremes were modeled using a generalized extreme value distribution following the block maximum approach with the “extRemes” library (Gilleland and Katz, 2014). To capture spatial variation, an extreme value distribution was fit to positive and negative maximum anomalies time series by location (Murphy et al., 2004; Cooley, 2009). Model fitting was assessed using quantile-quantile and density plots (Gilleland and Katz, 2014), and the probability that annual minima or maxima exceeded the 75 percentiles of each series was estimated (Tank et al., 2009).
3. Results
The annual cycle in this region is characterized by a cold and dry winter, with increasing temperature and humidity during spring, reaching a maximum in summer and decreasing again in fall (Salas-Pérez and Granados-Barba, 2008; Salas-Pérez and Jordán-Garza, 2018). The mean for each climate variable followed this seasonal pattern at the three locations, but rainfall data showed higher variability than air temperature and relative humidity (Fig. 3, based on modeled data).
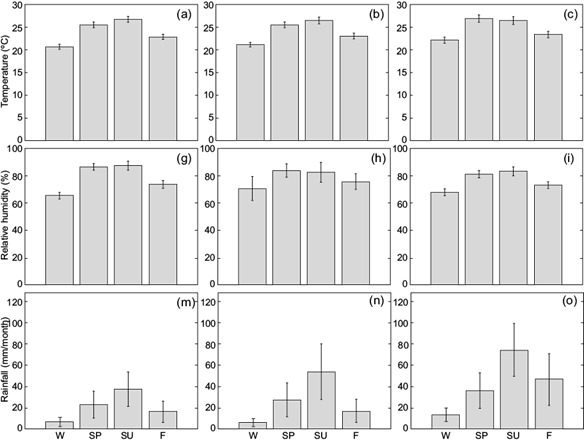
Fig. 3 Mean 35-year seasonal patterns for air temperature, relative humidity and rainfall at the three locations: (a, g, m) Tuxpan, (b, h, n) Veracruz, and (c, i, o) Coatzacoalcos. Bars show means and whiskers show 95% confidence intervals.
Climate anomalies followed a similar annual pattern as the mean climatic series, with negative anomalies predominating on winter and fall and positive on spring and summer; variability was larger for rainfall anomalies (Fig. 4).
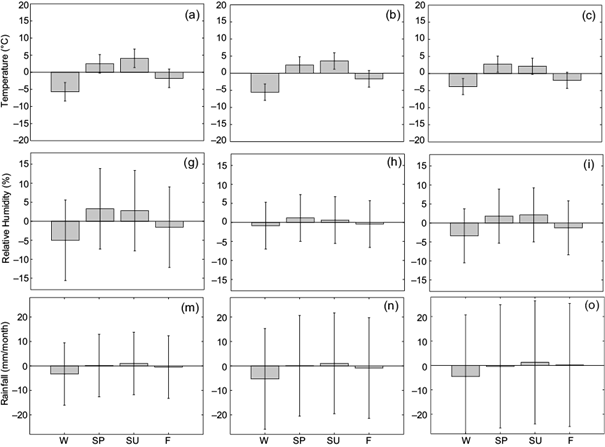
Fig. 4 Mean 35-year annual patterns for anomalies of air temperature, relative humidity and rainfall at the three locations: (a, g, m) Tuxpan, (b, h, n) Veracruz, (c, i, o) Coatzacoalcos. Bars show means and whiskers show 95% confidence intervals.
3.1 Results from the Bermuda High Index
Bermuda High Index computed at the reef locations of this study, showed positive values indicating its influence on climate variability (Fig. 5). Note the similarity between time series (which have multi-annual fluctuations) due to the influence of the NASH over the relatively small area where the three locations are situated.
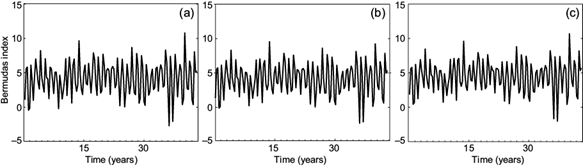
Fig. 5 Bermuda High Index at reef locations. The local index was computed as the difference of the Bermuda High and the pressure at mean sea level over the reef systems. (a) Tuxpan, (b) Veracruz, (c) Coatzacoalcos. The positive values indicate the influence of the Bermuda High over the reef locations.
3.2 Coherence with the Bermuda High pressure system
The three climate variables showed significant coherence at different periods and years with the North Atlantic High-pressure System at the three locations (Fig. 6).
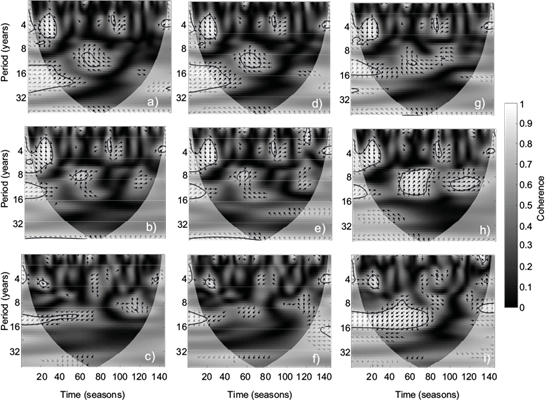
Fig. 6 Wavelet coherence of air temperature, relative humidity and rainfall with the Bermuda High Index. (a, b, c) At the Tuxpan location; (d, e, f) at the Veracruz location; (g, h, i) at the Coatzacoalcos location. Black contours show significant coherence at the 95% confidence. The gray scale shows coherence values.
Significant coherence at periods of approximately 4 years was common to the three variables and on the three locations (Fig. 6). The arrows within the significant coherence pointed up or were inclined to the right, suggesting that the changes in the climate variables occurred slightly before or at the same time as the changes of atmospheric pressure at mean sea level (Bermuda High pressure oscillation) (Fig. 6). A similar pattern occurred with significant coherence between the signals at periodicities of 8+ years, particularly in Coatzacoalcos, the southern location (Fig. 6 c, i).
3.3 Linear trends in minimum and maximum anomalies
In general, climate anomalies of all three variables (air temperature, relative humidity, and rainfall) showed similar trends at the three locations for the studied period (Table II). Maximum anomalies of air temperature showed significant increasing trends in the northern and central locations and minimum anomalies showed a significant increasing trend at the southern location (Table II). Maximum anomalies of relative humidity showed significant increasing trends at all locations and minimum anomalies showed no significant trends (Table II). Maximum rainfall anomalies showed a significant increasing trend only at the central location, and minimum anomalies showed no significant trends (Table II).
Table II Linear trends for climate anomalies (maximum and minimum) at the three locations along Veracruz*.
| Anomalies | Location | Slope | p-value | Differences between locations |
| Air temperature (max, ºC/ year) | Tuxpan Veracruz Coatzacoalcos | 0.03 (0.0007, 0.05) 0.03 (0.01, 0.05) 0.02 (-0.004, 0.05) | 0.01 0.007 0.1 | Tuxpan = Veracruz > Coatzacoalcos |
| Air temperature (min, ºC/ year) | Tuxpan Veracruz Coatzacoalcos | 0.01 (-0.004, 0.03) 0.01 (-0.0015, 0.03) 0.02 (0.002, 0.04) | 0.15 0.08 0.03 | Tuxpan = Veracruz < Coatzacoalcos |
| Relative humidity (max, %/year) | Tuxpan Veracruz Coatzacoalcos | 0.13 (0.05, 0.22) 0.14 (0.05, 0.24) 0.16 (0.06, 0.26) | 0.048 0.005 0.002 | Tuxpan = Veracruz = Coatzacoalcos |
| Relative humidity (min, %/year) | Tuxpan Veracruz Coatzacoalcos | 0.003(-0.07, 0.07) 0.025 (-0.04, 0.08) 0.06 (-0.01, 0.13) | 0.93 0.43 0.09 | Tuxpan = Veracruz = Coatzacoalcos |
| Rainfall (max, mm/month.year) | Tuxpan Veracruz Coatzacoalcos | 0.21 (-0.4, 0.8) 0.98 (0.003, 1.9) 0.83(-0.005,1.72) | 0.49 0.05 0.07 | Tuxpan < Veracruz > Coatzacoalcos |
| Rainfall (min, mm/month.year) | Tuxpan Veracruz Coatzacoalcos | -0.017 (-0.11, 0.07) -0.12 (-0.25, 0.006) -0.11 (-0.25, 0.03) | 0.7 0.07 0.13 | Tuxpan = Veracruz = Coatzacoalcos |
*Figures are the result of a generalized least squares regression showing the slope (representing the linear trend), its 95% confidence interval, and significance (p-value). Differences between locations were based on the slope significance and represent which location experiences similar (=), larger (>) or smaller (<) change between each other.
3.4 Extreme values
For all cases, the quantile-quantile plots and density plots showed a reasonable model fit (Gilleland and Katz, 2014). In general, the return level of maximum positive and negative anomalies followed a gradually decreasing trend with the return period, except for negative anomalies of rainfall at Tuxpan and Veracruz (see Fig. 7 for Tuxpan and supplementary Fig. SM-5).
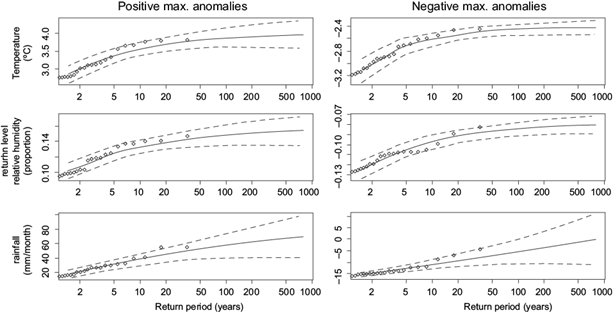
Fig. 7 Return-level plots of maximum positive and negative climate anomalies at Tuxpan. The solid lines show the associated general extreme value distribution and the dotted lines the 95% confidence intervals. Note different values on the y-axes. Similar patterns were observed at the other locations (see Fig. SM-5a, b).
The thresholds for each anomaly were chosen using the 75th percentile for each variable and each location. The probability of exceeding these thresholds was calculated for each variable and location; in all cases, it was > 0.5 (Table III).
Table III Estimated probabilities of exceeding an anomaly threshold for the observed dataset.
| Climate anomalies | Location | 75 percentile | Probability of exceeding the 75 percentile |
| Positive maximum air temperature (ºC/year) | Tuxpan | 3.15 | 0.68 |
| Veracruz | 2.77 | 0.7 | |
| Coatzacoalcos | 3.87 | 0.98 | |
| Negative maximum air temperature (ºC/year) | Tuxpan | -2.87 | 0.69 |
| Veracruz | -2.12 | 0.98 | |
| Coatzacoalcos | -1.41 | 0.99 | |
| Positive maximum relative humidity (%/year) | Tuxpan | 11.8 | 0.73 |
| Veracruz | 12.9 | 0.98 | |
| Coatzacoalcos | 9.84 | 0.81 | |
| Negative maximum relative humidity (%/year) | Tuxpan | -10.93 | 0.74 |
| Veracruz | -7.4 | 0.99 | |
| Coatzacoalcos | -6.74 | 0.78 | |
| Positive maximum rainfall (mm/month.year) | Tuxpan | 26.58 | 0.73 |
| Veracruz | 47.38 | 0.75 | |
| Coatzacoalcos | 49.02 | 0.74 | |
| Negative maximum rainfall (mm/month.year) | Tuxpan | -14.03 | 0.69 |
| Veracruz | -6.01 | 0.99 | |
| Coatzacoalcos | -27.89 | 0.72 |
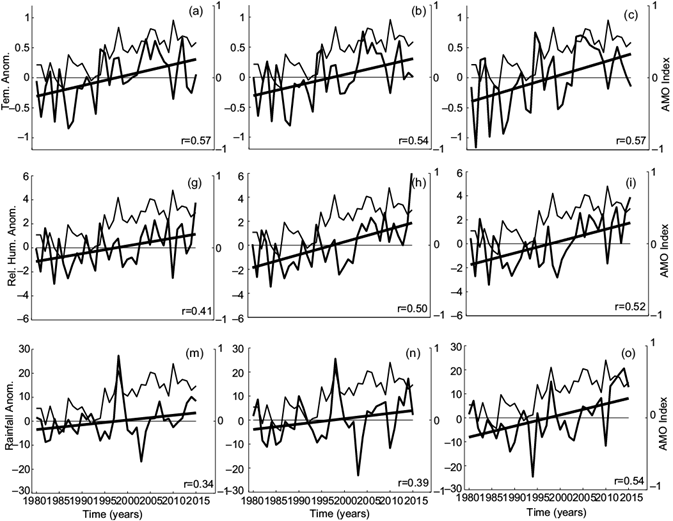
The correlation between anomalies of the three meteorological variables with ENSO, NAO and AMO indexes is shown in the supplementary information (Figs. SM-3 and SM-4). It is observed that correlation coefficients of the ENSO and NAO indexes with anomalies are lower (-0.4 to 0.4) than with the AMO index (> 0.5) and, in some cases, negative. Thus, the correlation with the Bermuda High Index appears to dominate. However, in Figure 8 the AMO index had correlation coefficients > 0.5 and significant (p = 0.001). Hence, both the NASH and the AMO can potentially affect climate variability over the reef corridor of the southwestern Gulf of Mexico.
4. Discussion and conclusions
All climate variables at the three locations along the reef corridor of the southwestern Gulf of Mexico showed significant coherence with the Bermuda High pressure index at periods from 4 to 8 years, and only for air temperature and relative humidity, at multidecadal (> 16 years) periods. Climate variability has been related to changes in the atmospheric fluxes of heat and rain that can occur over large spatial scales and different temporal scales (Marshall et al., 2001). These periods of significant coherence for climate variables suggest the modulation of different atmospheric phenomena that can act through teleconnections (Sheridan, 2003). For example, ENSO, NAO, and AMO could influence interannual to interdecadal scales (Jin and Kirtman, 2010; Zhu and Liang, 2013) (see Figs. SM-3 and SM-4).
The influence of the synoptic-scale circulations can generate short-term (a few days) up to seasonal fluctuations in air temperature, relative humidity, and rainfall at the study area (Salas-Pérez and Granados-Barba, 2008; Salas-Pérez and Arenas-Fuentes, 2011) (Fig. SM-1). Several synoptic-scale phenomena, like tropical waves, and tropical cyclones can locally increase the amount of rainfall in the western Gulf of Mexico (Tejeda-Martínez and Welsh-Rodríguez, 2006). It is not clear if the shortest meteorological scales can influence the seasonal scales on an interannual basis (Gutiérrez de Velasco and Winant, 1996). But a previous study on the north location of the reef corridor (Fig. 2) showed that teleconnections like the ENSO inter-annual signal have an impact on rainfall fluctuations in the study area (Salas-Pérez and González-Gándara, 2016; Díaz-Esteban and Raga, 2018).
Stahle and Cleaveland (1992) measured the influence of NASH on the southern United States and southwestern North Atlantic, through the pressure gradient across their study area. Their results showed positive values, indicating that the western edge of the Bermuda High was located farther east than its normal position (Katz et al., 2003), which may correspond to enhanced southerly moisture advection and reduced stability of the atmospheric layer over the southeast United States (Henderson and Vega, 1996).vIn this context, the coherence phase arrows of the pressure at mean sea level of the Bermuda High and the meteorological variables in the reef corridor of the southwestern Gulf of Mexico showed that, in general, atmospheric pressure at mean sea level was leading changes in air temperature, relative humidity and rainfall in periods of 4 to 8 years, which could be related to the ENSO signal affecting the study area (Salas-Pérez and Gónzalez-Gandara, 2016). A multidecadal signal affecting mainly air temperature could be related to AMO and its effects to the increased variability in rainfall over the region (Fig. 8). Enfield et al. (2001) showed that during the warm phase of AMO rainfall was minimum in the United States and it increased during the transition to a cold AMO phase.
Positive anomalies of air temperature showed significant increasing trends except in Coatzacoalcos (southern location), where negative anomalies became warmer. These patterns depict a future increase of positive temperature anomalies in spring and summer at the central and northern locations and milder cold anomalies in winter and fall at the southern location. These trends are following the general warming of sea surface temperature that has been observed in other regions of the Gulf of Mexico (Kuffner et al., 2015). Winter cooling and warming have also been reported (Chollett et al., 2012), and the latter has facilitated a range expansion of coral species to northern latitudes in Florida (Precht and Aronson, 2004). Yet, these warming patterns are expected to cause important changes in the ecology of the reef systems in the study area (Walther et al., 2002; Bruno et al., 2007; Heron et al., 2010; Ruiz-Moreno et al., 2012). Positive relative humidity anomalies showed a significant trend at the three locations, just like positive rainfall anomalies did at the central location. These patterns depict moister spring and summer conditions in the region that can potentially increase the risk of floods in the area (Milly et al., 2002), which could be related to teleconnections, mainly with the AMO mode. It is known that when the Bermuda High approaches the Gulf of Mexico, rain amounts increase, and when the Bermuda High moves away, then rain amounts decrease at interannual and decadal scales (Kucharski et al., 2010).
We acknowledge that the data set analyzed encompasses a relatively short period (1980 to 2015), so the significant trend of warmer air temperature anomalies is not surprising. Historical reconstructions of global air temperature have shown that, since 1880, global mean temperature has increased about 0.85 ± 0.2 ºC (Easterling et al., 1997; Reynolds et al., 2008; Wiles et al., 2014; IPCC, 2014). This warming could, in turn, influence changes in relative humidity and rainfall, as the three climate variables are highly correlated (Table SM-I). An interesting observation is the increase of positive anomalies regarding relative humidity at the three locations of the study area. As temperature increases, so does saturated vapor pressure, and relative humidity should decrease or remain constant, but only if vapor pressure remains the same or increases at a lower rate than temperature, which could be the result of the relative short time-series analyzed in this study.
The coherence of the pressure at mean sea level of the Bermuda High pressure system with the raw meteorological time-series showed variability consistent with well-known modes such as ENSO, NAO, and AMO. Positive and negative anomalies showed low correlation values (-0.4 to 0.4) with the ENSO and NAO modes while correlations were high (> 0.5) and significant with the AMO mode. Therefore, the results indicate that both the Bermuda High and the AMO modes modulate the climatic variability of the reef corridor in the southwestern Gulf of Mexico.

