


 text new page (beta)
 English (pdf)
 Article in xml format
 Article references
 Send this article by e-mail
 Cited by SciELO
  Similars in
SciELO
Similars in
SciELO 
 Permalink
1. Introduction
Colombia has considerable geophysical, geological, and hydroclimatic diversity. In the past 40 years (1970-2011), it has experienced losses due to socio-natural disasters estimated at more than USD 7.100 billions (Campos et al., 2012). The rainy period of 2010-2012 and the La Niña phenomenon (Blunden et al., 2011) affected 1027 municipalities (Sedano-Cruz et al., 2013), four million people and caused economic losses of approximately USD 7.8 billions (Hoyos et al., 2013a). On the other hand, the El Niño Southern Oscillation (ENSO) of 1997-1998 generated damages to the agricultural sector estimated at more than USD 101 millions in the year 2000 in addition to 124 million USD in indirect losses produced by adverse effects on the balance of payments and the absence of exports (Campos et al., 2012). The total amount of damages caused in the Latin American Andean Community (Peru, Ecuador, Colombia, Bolivia, and Venezuela) was estimated at USD 7.543 billions (Jovel, 2000).
The warm phase of ENSO, known as El Niño, has been associated with droughts in the Colombian regions (Montealegre and Pabón, 2000; Poveda, 2004; Poveda et al., 2011; Hoyos et al., 2013b). Zuluaga (2009), using the Standardized Precipitation Index (SPI) found that the strongest droughts in the Colombian Andean region occurred during the El Niño years of 1997-1998, 1991-1992, 1982-1983, 1976-1977 and 1987-1988. This condition was repeated in other areas of Colombia, with some variations in the order of events. In the Pacific region (western Colombia), the most important events occurred in the following periods: 1984-1985, 1997-1998, 1991-1992, and 1987-1988. During these events, there was a consistent pattern of climatic and hydrological anomalies in the tropical regions of South America (SA), which during the warm phase (El Niño) produces negative anomalies of precipitation, soil moisture and river discharge, as well as positive anomalies of air temperature, and consequently droughts (Poveda et al., 2000, 2001).
Severe or recurrent droughts can result in significant environmental and economic damage, with negative effects on human and ecological water demand, soil degradation, hydropower, agriculture, human resources and ecosystems (Patrick, 2003; Seth, 2005; Wilhite and Buchanan, 2005; Guenang and Kamga, 2014; Ionita et al., 2016). Below et al. (2007) report that droughts were responsible for more than 50% of deaths from natural disasters between 1900 and 2004, representing 35% of the total population affected, and 7% of economic losses, after losses incurred by floods and earthquakes (Loaiza et al., 2015).
However, the physical mechanism of drought is complex and difficult to establish because its multiscale character adds much complexity to any analysis. McKee et al. (1993) presented the characteristics of droughts by considering available water resources: soil moisture, groundwater, snow, river discharges, and stored deposits. The time scale in which deficits accumulate is very important and separates the different types of drought into meteorological, hydrological, and agricultural. This multitemporal character makes it difficult to identify clear relationships between atmospheric circulation patterns and drought variability (Vicente-Serrano and López-Moreno, 2005; Patel et al., 2007; Lorenzo-Lacruz et al., 2010; Vicente-Serrano et al., 2011).
The strong influence of the Pacific and Atlantic oceans and the Amazon basin makes the Andean and Pacific Colombian regions sensitive to several phenomena, such as the Tropical Easterly Waves, the North Atlantic Oscillation (NAO), ENSO, the Madden-Julian Oscillation (MJO), and the Atlantic Multidecadal Oscillation (AMO), among others (Mesa et al., 1997; Hoyos et al., 2013b). However, ENSO is perhaps the ocean-atmosphere coupling phenomenon with the most significant influence on climate in the interannual time scale. It is associated with exceptional hydroclimatic events and is considered a notable source of climatic variability (Waylen and Poveda, 2002; Carvajal-Escobar et al., 2007; Puertas and Carvajal-Escobar, 2008; Poveda et al., 2011; Rojo, 2011; García et al., 2012).
Given its geographical location, Colombia receives the direct influence of the ocean-atmosphere coupling system in the tropical Pacific Ocean associated with the ENSO (Tedeschi et al., 2013, 2015); in the El Niño phase, ENSO causes hydrological deficits in most of the national territory of Colombia, particularly in the Atlantic and Andean regions. The Colombian Andes are prone to hazards due to the complexity of the geographic terrain combined with the spatial and temporal climate variability (Hoyos et al. 2013b; Ávila et al., 2019). The rainfall decrease restricts the availability of water for agriculture, energy generation, and the supply to population (Poveda et al., 2002; Montealegre, 2009; Reboita et al., 2012).
The climate in the municipality of Cali is representative of the Alto Cauca basin, which is considered as one of the regions with greatest potential for social and economic development in Colombia, in terms of the natural resources, since it comprises a wide valley characterized by fertile lands and abundant water sources, among other resources (Velásquez and Jiménez, 2004). Previous studies indicate that this region represents the climatic conditions of the western slope of the Andes, with a bimodal precipitation cycle with a maximum in April-May and a second more intense peak in October-November, alternated with lower precipitation periods in January-February and June-August (Guzmán et al., 2014; Enciso et al., 2016; Estupiñán, 2016). The double-crossing of the Intertropical Convergence Zone (ITCZ), the transport of moisture from the Pacific and Atlantic Oceans and the Amazon basin, the three branches of the Andean Cordillera and the superficial hydrological processes determine the variability of the precipitation in the area. In the geographical valley and the eastern slope of the Western Cordillera of the Andes, the dryness predominates due to the steep slope that characterizes this slope and the passage of air masses from the Pacific, devoid of moisture that has already been discharged upwind (Poveda, 2004; Guzmán et al., 2014).
In addition, several studies have shown different global influences of ENSO due to the location of the sea surface temperature (SST) anomaly in the central Pacific Ocean (CP) or in the eastern Pacific Ocean (EP) (Weng et al., 2007; Kug et al., 2009; Li et al., 2011; Tedeschi et al., 2013). The EP El Niño causes a decrease in rainfall in northern SA and increases in the southeastern part of the continent, mainly between September and November and from December to February (Larkin and Harrison, 2005; Grimm and Tedeschi, 2009). Tedeschi et al. (2015) found a decrease in the occurrence of extreme rainfall events in the tropical region of SA during the CP El Niño compared to normal years and the EP El Niño. The opposite occurs in the southeast area of the continent, increasing the occurrence of extreme events during the EP El Niño compared to CP El Niño. This indicates that ENSO episodes have considerable importance in modulating the frequency of extreme precipitation events in SA; although there are studies relating the climate variability associated with ENSO in Cali’s area of influence (Carvajal-Escobar et al., 1998; Poveda et al., 2005; Enciso et al., 2016), there are no studies that quantify the influence of different types of El Niño.
Therefore, the objective of this paper is to analyze the semi-annual and annual rainfall variations in Cali, Colombia, and their relationship to the ENSO through the SPI, correlation analysis, and wavelet transform. The following section describes the data and methodology. The results are shown in section 3, and discussion and conclusions are drawn in section 4.
2. Data and methodology
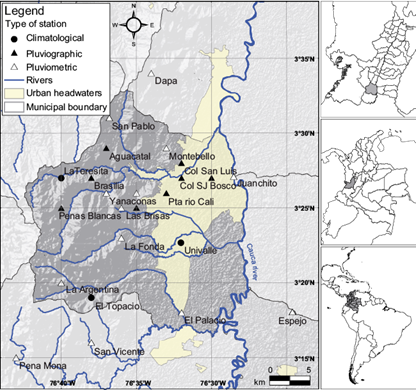
Precipitation data from 24 stations with common records from 1971 to 2011 were used. The data were supplied by the Corporación Autónoma Regional of Valle del Cauca (CVC). The selection criteria considered the location of the station and the percentage of missing data (which should be less than 10%, according to the normal proportions method). The station locations are illustrated in Figure 1. Among the most used drought indices during recent decades, the SPI, considered the most robust and effective index (Mckee et al., 1993; Vicente-Serrano and López-Moreno, 2005; Livada and Assimakopoulos, 2007; Vicente-Serrano et al., 2011; Guenang et al., 2014; Ionita et al., 2016; Santos et al., 2017), allows to determine the duration, magnitude and intensity of the droughts (Hayes et al., 1999), and can be calculated in different time scales to quantify various types of droughts (Wilhite et al., 2000; Ji and Peters, 2003).
The SPI is defined as the number of standard deviations by which a normally distributed random variable deviates from its long-term mean (Guenang et al., 2014). In this study, the SPI is computed for three different accumulation periods: three months (SPI-3, quarterly), six months (SPI-6, semi-annual) and 12 months (SPI-12, annual). Data sets are fitted to the gamma function to define the relationship of probability to precipitation (Mckee et al., 1993), which fits very well with precipitation data and provides the best model for describing precipitation (McKee et al., 1995; Lloyd-Hughes and Saunders, 2002; Türkeş and Tatli, 2009; Bedoya et al., 2010; Krepper and Zucarelli, 2010; Penalba and Rivera, 2015). Once the series were transformed to a standardized normal distribution (with mean 0 and variance 1), the strength of the anomaly was classified according to Table I. For precipitation, high positive values correspond to wet sequences, and high negative values correspond to dry periods (Guenang et al., 2014). Table I also shows the probabilities associated with the strength of the anomaly that arises from the normal probability density function P.
Table I Classification of SPI and associated probabilities.
| SPI | Category | Probability (%) |
| Greater than 2.0 | Extreme humidity | 2.3 |
| 2.0 to 1.5 | Severe humidity | 4.4 |
| 1.5 to 1.0 | Moderate humidity | 9.2 |
| 0 to 1.0 | Light humidity | 34.1 |
| 0 to -1.0 | Mild drought | 34.1 |
| -1.0 to -1.5 | Moderate drought | 9.2 |
| -1.5 to -2.0 | Severe drought | 4.4 |
| Less than -2.0 | Extreme drought | 2.3 |
The SPI of a month n refers to the last month of the interval considered for its calculation. Each drought event starts when the index is equal to or less than -1.00 and ends when it becomes greater; the value reached by the SPI for each grouping is the intensity of the event, and the magnitude is obtained from the sum of the consecutive values of the SPI indicating drought. Since the magnitudes might refer to several values, for a drought classification according to the magnitude, five types of meteorological droughts were considered. The ranges are calculated according to the behavior of the data, as seen in Table II.
Table II Types of droughts according to their magnitude.
| Category | SPI-6 | SPI-12 |
| Abnormally dry | 1 ≤ M < 5 | 1 ≤ M < 10 |
| Moderate | 5 ≤ M < 10 | 10 ≤ M < 20 |
| Severe | 10 ≤ M < 15 | 20 ≤ M < 30 |
| Extreme | 15 ≤ M < 20 | 30 ≤ M < 40 |
| Exceptional | > 20 | > 40 |
The normalized anomalies of the monthly vertical velocity in the pressure coordinate at 500 hPa (ω) data of the period 1971-2011 were used to examine the atmospheric conditions that generated the most significant drought in the municipality of Cali. These data were obtained from the Reanalysis I of the National Centers for Environmental Prediction (NCEP) and the National Center for Atmospheric Research (NCAR) (Kalnay et al., 1996); they have a spatial resolution of 2.5º × 2.5º in a global grid. The analysis covered the region between 30º N-30º S and 180º-10º W. The composite analysis was used, and the statistical significance of the means was tested with the Student t-test and a confidence level of 95%.
The climatic indices used were as follows: SST data for the Niño regions 1 + 2 (0º-10º S; 90-80º W), Niño 3 (5º S-5º N; 150-90º W), Niño 3.4 (5º S-5º N; 170-120º W), and Niño 4 (5º S-5º N; 160º E-150º W) from the National Oceanic and Atmospheric Administration (NOAA); the Southern Oscillation Index (SOI), which is calculated as the standardized difference in atmospheric pressures between Tahiti and Darwin (Trenberth and Caron, 2000); the Oceanic Niño Index (ONI) computed as the three-month moving average of the SST anomalies in the Niño region 3.4 (L’Heureux et al., 2013), and the Multivariate ENSO Index (MEI) which uses six variables (pressure at sea level, zonal and meridional surface wind components, SST, surface air temperature and total cloud cover) (Wolter and Timlin, 2011). The indices were smoothed for the semi-annual and annual scale (moving averages) to be comparable with the results of the SPI. Pearson correlations were used to analyze the relationships between the ENSO indices and SPI. The significance of the correlations was tested with Student’s t-test and considering the confidence level of 95%.
The wavelet analysis was performed once the correlation analysis between the SPI and the climatic indices had been completed. Morlet’s wavelet was used for the time-frequency analysis of a given time series, and the cross-wavelet analysis was used to compare two-time series. The computational procedures of the wavelet analysis described by Grinsted et al. (2004) and Torrence and Compo (1998) were used in this study. The global wavelet power (GWP) for a given scale s is the average time of all the local wavelet power spectra (WPS) and is quantified using equation 22 in Torrence and Compo (1998):
The calculation of the wavelet coherence and the phase difference was applied using the methodology proposed by Grinsted et al. (2004) and Torrence and Webster (1999). Given two time series, X(t) and Y(t), with their respective wavelet transforms, W X (t,s) and W Y (t,s), the wavelet cross-spectrum is defined as W XY (t,s) = W X (t,s) W Y* (t,s), where (*) indicates the complex conjugate. The square of the wavelet coherence is defined as the square of the modulus of the smoothed cross-wavelet spectrum, normalized by the smoothed wavelet spectrum:
where 〈〉 denotes the smoothing in time and scale. The factor s -1 is used to convert the square of wavelet coherence into energy density. Finally, it is observed that the wavelet coherence is an accurate representation of the (normalized) covariance between the two times series because the wavelet transformation preserves the variance (Torrence and Compo, 1998). Additionally, the phase difference in wavelet coherence is indicated by the following Eq. (3):
where (ℑm) and (ℜe) are the imaginary and real parts of W XY (t,s), respectively (Grinsted et al., 2004).
3. Results
3.1 Standardized precipitation index
Figure 2 provides an example of the monthly evolution of the SPI smoothed with the 3-, 6- and 12-month averages for the El Topacio station, in which a high (low) frequency variability of the quarterly (semi-annual and annual) rainfall is observed. Consistently, previous studies have shown that particular systems and regions respond to drought conditions at different temporal scales (Vicente-Serrano and López-Moreno, 2005; Quiring and Ganesh, 2010; Vicente-Serrano et al., 2011).
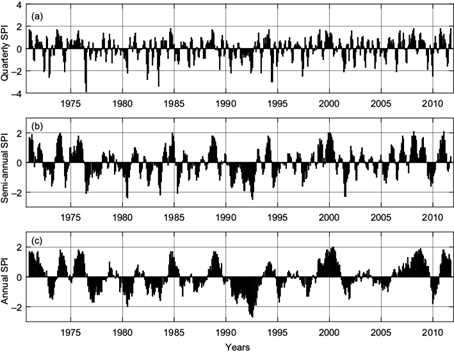
Fig. 2 Monthly evolution of SPI smoothed with the monthly 3-, 6- and 12-month averages at El Topacio station.
The El Topacio station was selected because its precipitation time series adequately represents the precipitation variability of the other chosen stations (Fig. 3). The rainfall time series in El Topacio and the average rainfall of the other 23 stations are highly correlated (0.84). Also, the rainfall time series in El Topacio is significantly correlated with 22 individual rainfall time series out of 23 time series (Fig. 3).
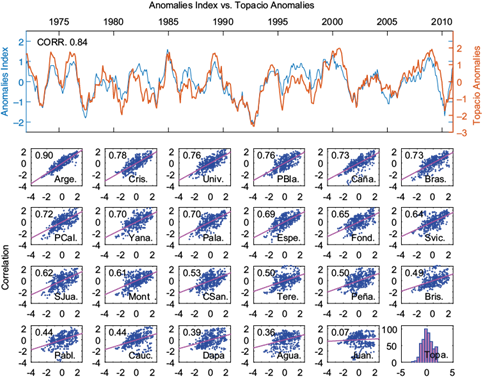
Fig. 3 Correlation between the precipitation in El Topacio station and the anomaly precipitation index (upper panel), and between precipitation in El Topacio and in individual stations within the study domain (lower panel). Climatology for El Topacio (station is shown in the right corner of the lower panel [mm month-1]).
As seen in Figure 2c, the SPI-12 for the El Topacio station tends to stabilize has fewer fluctuations and identifies the 1982-1983, 1991-1992, 1997-1998 and 2009-2010 as dry years with great efficiency. These years coincide with those classified by NOAA as with strong El Niño events. The strongest drought in the region occurred during 1991-1992, and the moderate events, during the periods 1987-1988, 1994-1995 and 2006-2007. Both high and moderate-intensity events can be identified at quarterly, semi-annual, and annual scales of the SPI (Fig. 2). Besides, once ENSO is the main inter-annual variability phenomenon that modulates the spatio-temporal variations of the precipitation anomalies in Colombia, it is possible to represent these events with greater clarity with the 12-month temporal smoothing.
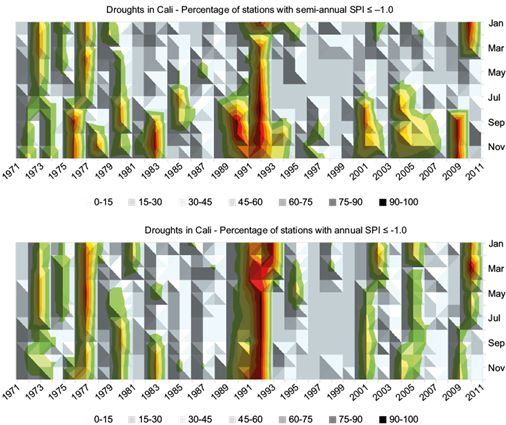
The SPI-6 for the El Topacio station indicated 27 drought events and categorized the 1991-1992 event as the longest extreme drought during the period of analysis, with a rainfall deficit from October 1990 to March 1993 (Fig. 2b). This event was identified in 90% of the stations between May 1992 and February 1993 except for the Juanchito and Dapa stations. Consistently, Figure 4 shows the percentage of stations with SPI ≤ -1.0 during the 40-yr study period. For the 487 semesters studied, 80% of the stations reported four events with substantial deficits in Cali: 1976-1977, 1983-1984, 1990-1992 and 2009-2010. Events are also identified in the annual scale in more than 90% of the stations, except the 1983-1984 event, which was only reported in 50% of the stations. The semi-annual and annual rainfall deficits in August 1992 were reported in 100% and 95% of the stations, respectively, and the annual precipitation deficits in March 1992 were registered in 83% of the stations. In accordance, using the ONI, MEI and SOI indices, the 1990-1991 El Niño can be classified as a strong one.
According to the drought classification based on the magnitude (Table II), the average number of droughts for SPI-6 (SPI-12) recorded at each rain gauge station was 21 (13) events. The SPI-6 data indicated that 63.5%, 20.2%, 8.5%, 5.0%, 4.0% of the semi-annual droughts were, respectively, in the categories abnormally, moderate, severe, extreme and exceptional. The SPI-12 data indicated that 73.6%, 12.7%, 8.4%, 2.5%, 2.8% of the annual events were, respectively, abnormal, moderate, severe, extreme, and exceptional droughts.
Based on the SPI-12 data, the La Teresita station reported the longest event, from November 1989 to April 1993 (3.5 consecutive years), followed by the Cauca River Plant station, with a rainfall deficit from July 1974 to May 1977 (three consecutive years). Finally, at the Juanchito station, the longest dry event was recorded from April 2004 to April 2006 (two consecutive years). These events were also identified with SPI-6 data.
The SPI values ≤ -1.0 were rolled back for each station analyzed to determine the minimum precipitation limit so that drought does not occur. Accordingly, when the annual rain event x fails to store the minimal amount of rainfall, conditions would indicate that a drought may occur (Loaiza et al., 2015). The results show that the minimum precipitation that must be accumulated in 12 months to prevent substantial deficits in Cali varies with elevation. The average threshold in the lowlands is 500 to 1200 mm/year, and in the highlands, 1500 to 2500 mm/year.
The dry SPI-12 of 1991-1994 was the most persistent over the municipality of Cali, in comparison with more intense events such as El Niño 1997-1998. The temporal sequences of the ω anomalies occurred from March-May (MAM) of 1991 to December-February (DJF) of 1994 (Fig. 5) and from MAM of 1997 to DJF of 2000 (Fig. 6). These maps illustrate differences in the Walker and Hadley cells in the study region. The 1991-1994 event presented positive values (anomalous subsidence) over northwestern of SA in all analyzed trimesters except in September-November (SON) of 1993 (Fig. 5). An anomalous Walker cell with its ascending branch over the central Pacific Ocean caused subsidence over Colombia from JJA-1991 to JJA-1992. Once the 1991-1992 El Niño was terminated, positive ω anomalies persisted over northwestern SA from SON-1992 to JJA-1993, which were associated with an anomalous Hadley cell with ascending branch over the Caribbean Sea and a descending one over central Colombia and Ecuador.
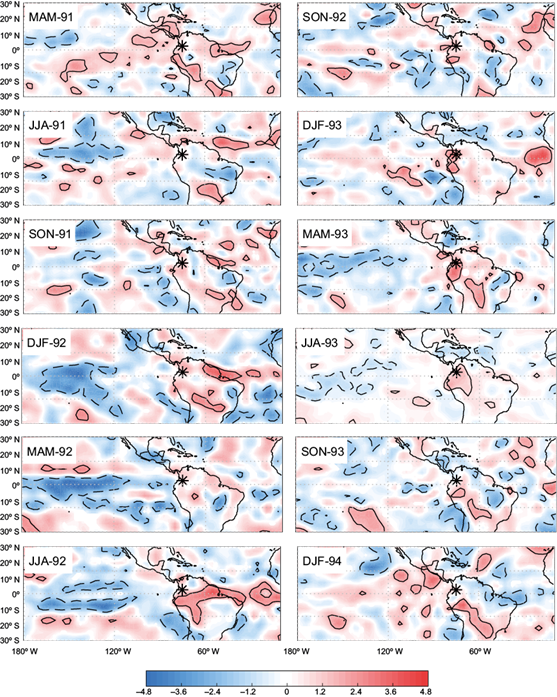
Fig. 5 Temporal sequence of quarterly ω anomalies during the period 1991-1994. The contour interval is 0.1 standard deviations. Red (blue) shaded areas encompass positive (negative) values, which are significant at the 95% confidence level.
On the other hand, the more intense 1997-1998 event showed intermittent effects on northwestern SA (Fig. 6). Indeed, an anomalous cell with its descending branch between 10º N-10º S on the South American continent, and its ascending branch over the eastern Pacific Ocean was observed during the El Niño onset stage (JJA to SON-1997), causing decreased precipitation in northern SA and increased in the southeast of the continent (Weng et al., 2009; Li et al., 2011; Tedeschi et al., 2015). However, from DJF-1998 to SON-1998 the descending branch shifted towards the south of the equator, leaving the study area on the influence of the upward movements that persisted until JJA-1999.
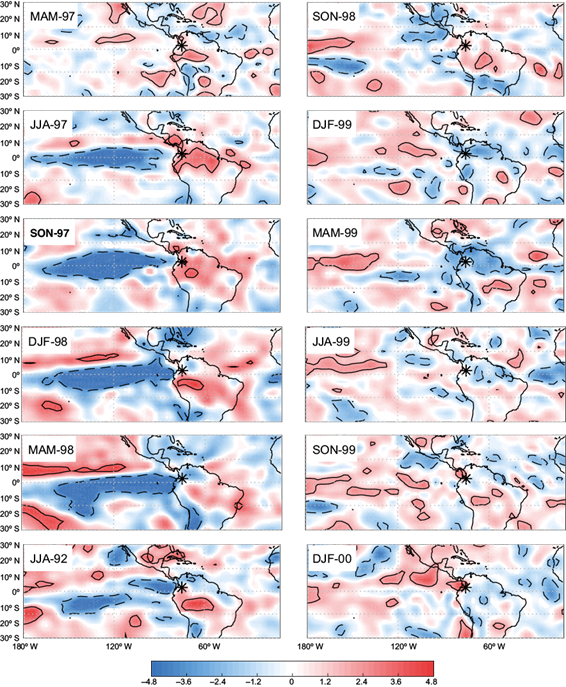
Fig. 6 Temporal sequence of quarterly ω anomalies during the 1997-2000 period. The display is the same as in Figure 5.
These results show persistent positive ω anomalies in the study domain during the 1991-1994 period (Fig. 5), which indicated the absence of the upward movements over the region. This result is consistent with the great drought of 1991-1992 indicated by the negative SPI-12. For the strong 1997-1998 El Niño event (Fig. 6), their persistent character in the region was not very clear in comparison with the 1991-1992 event.
3.2 Standardized precipitation index and its primary relationships with the ENSO
The relationship between SPI and ENSO events has been studied using the correlations and cross-wavelet analysis. The correlation coefficients between the annual SPI and the climatic indices SOI, ONI, MEI, and Niño regions 1 + 2, 3, 3.4, and 4 (Table III) were calculated. The results show significant correlations in the higher-elevation area of the municipality (eastern flank of the Western Cordillera, see Fig. 7) between Peña Mona (1676 masl) and San Pablo (1871 masl). Rain was less (more) abundant during El Niño (La Niña) than usual. The strongest relationship was for the ONI index (significant correlations greater than -0.5 at ten stations) and Niño regions 3.4 and 4 (not presented in the maps because they exhibit the same spatial pattern as the ONI). The correlations for these indices were negative and significant for the central and higher-elevation parts of the municipality, in addition to the southern part of the urban area. Similar results were obtained at the semi-annual scale, mainly for the part of the municipality with higher elevation.
Table III Correlations between the standardized precipitation index and the annual oceanic indices of the Pacific Ocean.
| Code | Station | Elevation (masl) | Annual | ||||||
| ONI | Niño 4 | Niño 3.4 | Niño 3 | Niño 1 + 2 | MEI | SOI | |||
| AG | Aguacatal | 1649 | -0.13 | -0.01 | -0.12 | -0.15 | -0.10 | 0.00 | 0.02 |
| BR | Brasilia | 1864 | -0.47 | -0.45 | -0.45 | -0.38 | -0.18 | -0.46 | 0.47 |
| CA | Canaveralejo | 1056 | -0.57 | -0.50 | -0.54 | -0.50 | -0.36 | -0.51 | 0.50 |
| SL | Col San Luis | 1053 | -0.29 | -0.19 | -0.27 | -0.28 | -0.22 | -0.22 | 0.26 |
| SJ | Col SJ Bosco | 1000 | -0.35 | -0.29 | -0.33 | -0.31 | -0.21 | -0.29 | 0.31 |
| DA | Dapa | 1716 | -0.17 | -0.08 | -0.16 | -0.18 | -0.13 | -0.09 | 0.13 |
| PA | El Palacio | 950 | -0.49 | -0.50 | -0.48 | -0.41 | -0.23 | -0.41 | 0.39 |
| TO | El Topacio | 1676 | -0.73 | -0.71 | -0.72 | -0.64 | -0.40 | -0.69 | 0.70 |
| HE | Hda. El Espejo | 980 | -0.44 | -0.38 | -0.42 | -0.38 | -0.19 | -0.36 | 0.35 |
| JU | Juanchito | 950 | -0.02 | -0.02 | 0.00 | 0.02 | 0.09 | 0.09 | -0.12 |
| LA | La Argentina | 1794 | -0.65 | -0.66 | -0.63 | -0.53 | -0.29 | -0.63 | 0.68 |
| LF | La Fonda | 1298 | -0.53 | -0.58 | -0.53 | -0.47 | -0.25 | -0.48 | 0.42 |
| LT | La Teresita | 1950 | -0.46 | -0.48 | -0.44 | -0.35 | -0.19 | -0.44 | 0.41 |
| LB | Las Brisas | 1228 | -0.33 | -0.32 | -0.33 | -0.28 | -0.17 | -0.30 | 0.36 |
| LC | Los Cristales | 1312 | -0.64 | -0.63 | -0.61 | -0.53 | -0.30 | -0.57 | 0.59 |
| MO | Montebello | 1260 | -0.41 | -0.37 | -0.39 | -0.32 | -0.17 | -0.37 | 0.40 |
| PM | Peña Mona | 2100 | -0.57 | -0.58 | -0.54 | -0.42 | -0.18 | -0.47 | 0.45 |
| PB | Peñas Blancas | 2158 | -0.53 | -0.55 | -0.49 | -0.36 | -0.11 | -0.49 | 0.54 |
| PC | Río Cali | 1070 | -0.44 | -0.39 | -0.43 | -0.40 | -0.25 | -0.41 | 0.44 |
| RC | Río Cauca | 956 | -0.19 | -0.07 | -0.18 | -0.22 | -0.18 | -0.11 | 0.11 |
| SP | San Pablo | 1871 | -0.47 | -0.45 | -0.43 | -0.36 | -0.15 | -0.40 | 0.39 |
| SV | San Vicente | 1442 | -0.56 | -0.60 | -0.56 | -0.44 | -0.20 | -0.47 | 0.52 |
| UV | Univalle | 996 | -0.50 | -0.54 | -0.50 | -0.41 | -0.19 | -0.47 | 0.48 |
| YA | Yanaconas | 1730 | -0.59 | -0.60 | -0.59 | -0.50 | -0.29 | -0.60 | 0.64 |
Values in bold indicate significant correlations at the 0.05 level; shaded values in blue/green indicate correlations greater than 0.5
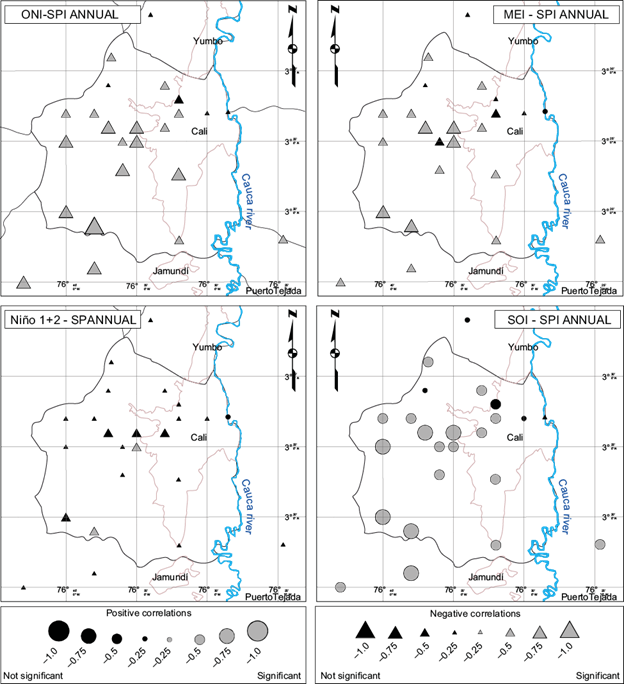
The MEI (SOI) showed significant negative (positive) correlations at 80% of the stations, mainly at the El Topacio and La Argentina stations (eastern flank of the Andean western cordillera in Colombia, see Fig. 7) and in the piedmont (stations Los Cristales and Cañaveralejo). There were no significant correlations between Niño region 1 + 2 and any of the stations except for Cañaveralejo and El Topacio. Although Niño region 1 + 2 indicated a positive correlation with the Juanchito station (plains of the Cauca river valley), it was not statistically significant.
The coefficient of determination (R2) indicated that the ONI, SOI and Niño 4 and Niño 3.4 represented between 40% and 53% of the annual rainfall variability at the El Topacio station. Similar relationships were found for the higher-elevation stations (La Argentina, Peña Mona and San Vicente [30% to 41%]) and for the stations in the piedmont of the mountain range (Cañaveralejo, La Fonda and Yanaconas [28% to 35%]); correlations in the northern part of the urban area were not significant (Juanchito, Río Cauca Plant and San Luis).
3.3 Wavelet transformation
The time-frequency variations of the time series for the ONI and annual SPI at El Topacio station obtained from the wavelet transform were analyzed. The ONI energy spectrum showed a dominant variability in the 2-7 years time scale for almost the entire period of analysis, while the energy spectrum of the SPI indicated substantial interannual variations of 2-6 years, mainly between 1975-2005 (Fig. 8a), i.e., precipitation at the El Topacio station (higher elevation) showed a dominant variability of 2-6 years, which was superimposed on the energy spectrum of the ONI time series. Therefore, at least for this period, variations in precipitation were probably related to the variability in SST at the central tropical Pacific Ocean. For the lowland zone (Univalle and Cali River Plant) and the piedmont (Los Cristales), the energy spectrum showed inter-annual variations on the scale of 2-3 years, although they were for short periods (figures not displayed).
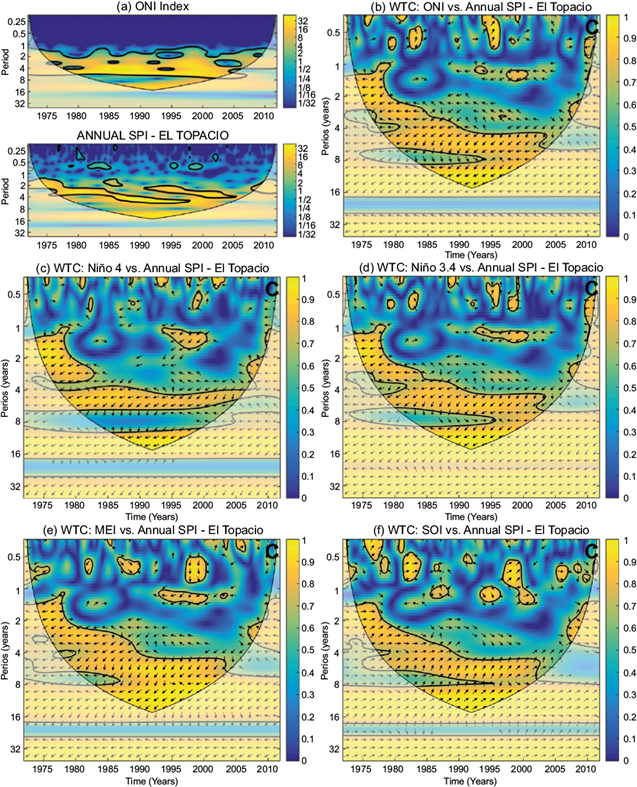
Fig. 8 (a) Energy spectra of wavelets for ONI and SPI-12 at El Topacio. The closed contours encompass significant variations at the 95% confidence level, and the region where the edge effects are important lies under the U-shaped curve. (b) Wavelet coherence and phase differences between ONI and the SPI-12 series at El Topacio. (c) Niño 4. (d) Niño 3.4. (e) MEI. (f) SOI. The closed contours represent the squared wavelet coherence. The significant IOC is delimited by a thin line. The arrows indicate the phase differences as follows: in phase (0º), pointing to the right; out of phase (180º), pointing to the left; the first time series leading the second by 90º, pointing down; and the first time series lagging the second by 90º, pointing upwards.
The coherence wavelets between ONI, Niño 4, Niño 3.4 and MEI with the SPI-12 showed similar relationships, mainly at a time scale of 4-6 years from 1980 to 2005 with a phase difference from -135º to 180º, and at a time scale of 2-3 years from the end of 1975 to 1985 with phase difference of 180º (Fig. 8b, c, d, e). For the time scale of 4-6 years (inter-annual), the phase difference of -135º generates a lag between the maximum peak of the indices and the minimum peak of the SPI-12 of 45º (6-9 months). In other words, the maximum (minimum) precipitation anomalies occur in the development phase of a La Niña (El Niño) event. For the time scale of 2-3 years (biennial), the phase difference of 180º indicates that the maximum wet (dry) conditions coincide with the mature stage of the La Niña (El Niño) event. These series also exhibited notable coherences for the time scale of 8-16 years from 1985 to 2000 with a phase difference of -145º, indicating that decreases (increases) in rainfall precede the El Niño (La Niña) mature stage by approximately 10-18 months at the decadal scale.
Significant coherences between the SOI and the annual series of precipitation anomalies were noted, mainly at the time scale of 4-7 years from 1980 to 2000, acting in the same phase with a variance of 45º to 50º; i.e., the negative (positive) precipitation anomalies were followed by negative (positive) SOI values with a delay of approximately 6-10 months (Fig. 8f). This association between the SOI and the SPI can be understood in terms of the interannual variability of the ENSO such as prolonged periods of negative (positive) SOI values that coincide with the abnormally warm (cold) ocean waters in the eastern tropical Pacific Ocean typical of the El Niño (La Niña) episodes. For the 8-16-year time scale, the 45º phase difference indicates that a decrease (increase) in rainfall precedes a low (high) pressure in the eastern tropical Pacific Ocean by approximately 12 to 24 months.
The relationship between Niño 3 (eastern Pacific) and rainfall was not as evident in the coherence wavelet, and a well-defined pattern cannot be observed (Fig. 9a). This result, which is based mainly on the 1990s with a phase difference of -135º at the scale of 4-7 years, indicates that the maximum (minimum) precipitation anomalies precede the minimum (maximum) SST anomalies of the eastern Pacific Ocean by 6-11 months. In the case of Niño region 1 + 2, it was not possible to define a significant coherence with the rainfall of the region except for the period 1990-2000, in which a phase difference of -100º appears at the scale of 4-6 years, which indicates that the maximum (minimum) rainfall precede the minimum (maximum) SST anomalies of Niño 1 + 2 by 11-16 months (Fig. 9b).
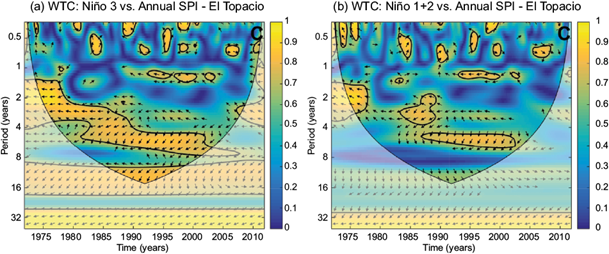
Fig. 9 Same as Figure 8b, but for the coherence wavelet and phase differences between the annual SPI of El Topacio station and (a) Niño region 3, (b) Niño region 1 + 2.
4. Discussion and conclusions
The SPI proved to be an adequate indicator of the meteorological drought for different temporal groupings (quarterly [not presented in this work], biannually and yearly). In the case of Cali, Colombia, the annual grouping tends to stabilize, has fewer fluctuations, and dry years corresponded to those classified by NOAA as El Niño years, mainly those of strong intensity as 1982-1983, 1991-1992 and 1997-1998. In addition, it was possible to identify the number of drought events, the frequency of occurrence, and the minimum rainfall thresholds.
Also, the correlations analysis between ENSO indices and SPI showed stronger relations of rainfall with the SST anomalies of the Pacific. This relation is consistent with the previous studies. Poveda et al. (2001, 2006) also found significant correlations (~ 0.7 to 0.8), in the western and central regions of Colombia, mainly during the mature phase of ENSO (December-February). Carvajal-Escobar (2004) identified, through cross-correlation analysis, a greater relationship between rainfall in the region and the Niño 3.4, MEI and SOI indices with a lag of one month. On the other hand, in the results presented here, the maximum correlations occur with SST anomalies in the central Pacific. This result may be associated with the increase in frequency and persistence in the last decades of El Niño episodes in the central Pacific (Lee and McPhaden, 2010; Yu and Kim, 2013).
The results of the cross-wavelet analysis further confirmed the relationship between Cali rainfall (northern South America) and the SST in the Pacific Ocean, with indications that this relation is stronger with the SST in the central and western regions (Niño 3.4 and Niño 4 regions). Additionally, the 1991-1992 El Niño event activated a descending branch over northwestern South America, while the 1997-1998 El Niño generated a descending branch to the south of the region, resulting in less influence on rainfall anomalies in comparison with El Niño 1991-1992.
The most interesting features revealed in the present work are related to the multiscale characteristics of the relation between precipitation and SST and their phase relations not documented in previous studies. For the interannual (4-6 years) and biennial (2-3 years) scales, the relations are preferentially associated with the SST of the central and western Pacific (Niño 3.4, Niño 4, ONI and MEI indices) with maximum (minimum) precipitation anomalies occurring up to 6-9 months in advanced and simultaneously with the minimum (maximum) SST indices, respectively. Poveda and Mesa (1996), Poveda (2004) and Estupiñán (2016) indicate that climate variability at the interannual time scale is strongly related to ENSO. But it also has a quasi-biennial component with a recurrence time between 2-2.5 years, as well as a low frequency of 4-5 years. Their results support our analysis.
Finally, extreme events such as the droughts resulting from ENSO are a climatic hazard that has been little studied in Colombia despite their economic impacts in the country and the region, especially in agriculture and ecosystems. It constitutes one of the main problems for rural populations, mainly regarding malnutrition and poverty; however, the impacts can be minimized as the most susceptible areas are identified, according to the intensity and periodicity, confronting them through measures of mitigation and adaptation, which are consistent with the sustainability of the systems that interact in the affected area. A better understanding of extreme droughts is necessary to undertake coordinated projects to alleviate the response of different productive sectors and reduce the risks for local populations. In this study, the SPI allowed to classify and quantify the dry periods in a simple way. Also, aspects related to the dominant scale of the SST variability and the difference of phases between the maximum anomalies of the SST of the tropical Pacific and the rainfall in Cali indicate the importance of monitoring tropical SST variations. The result presented here might be useful for territorial planning, monitoring of precipitation anomalies, and comprehensive climate risk management.

