


 nueva página del texto (beta)
 Inglés (pdf)
 Artículo en XML
 Referencias del artículo
 Enviar artículo por email
 Citado por SciELO
  Similares en
SciELO
Similares en
SciELO 
 Permalink
1. Introduction
Accurate rainfall estimation over India has vital importance in agricultural production, which has a large impact in social and economic life. The best sources for accurate rainfall estimation are rain gauges and weather radars, but the heterogeneous distributions over land and oceanic regions limit their use for meteorological applications. Alternatively, satellite-based rainfall estimations provide continuous spatial and temporal distributions of rainfall, which enable more accurate flood forecasting, agriculture and water resource management, numerical weather prediction, moisture budget calculations and many other applications in hydro-meteorological sciences.
Rainfall estimation techniques using meteorological satellites have improved quite rapidly in recent decades. As geostationary satellites provide frequent updates of weather systems at high spatial resolution, they are supposed to be a viable source of information for Indian monsoon monitoring. Following the launch in 2002 of the first Indian dedicated meteorological satellite, Kalpana-1, by the Indian Space Research Organization (ISRO), it is now possible to monitor the onset, progress and performance of the Indian monsoon consistently for various applications (Kaila et al., 2002). The advanced meteorological satellite of the Indian National Satellite System (INSAT-3D) is more useful for weather studies, since it has higher spatial and temporal resolution and increased number of channels. An overview of satellite-based rainfall estimation methods is given by Levizzani et al. (2002). Also, some satellite-based rainfall estimation techniques are developed by integrating infrared (IR) and passive microwave techniques, which are applied to the monitoring of various weather parameters and rainfall events (Gairola and Krishnamurti, 1992; Gairola et al., 2003; Prakash et al., 2010).
The first technique for rainfall estimation is developed by deriving a simple relationship with visible (VIS) and IR brightness temperature (BT), which has the advantage of being easy to apply but also shows a relatively low degree of accuracy (Levizzani et al., 2002). The main drawback of IR channels is that they only provide information about cloud top. Therefore, the major problem of estimating rainfall from these measurements is the difficulty to distinguish between precipitating and non-precipitating clouds. In general, methods based on cloud-top temperature tend to overestimate rainfall in dry environments and underestimate it in more humid atmospheres. A complete overview of the early work and physical premises of VIS and thermal IR (10.5-12.5 µm) techniques is provided by Barrett and Martin (1981) and Kidder and Vonder Haar (1995). This technique is mostly used in climatological applications over long time scales. But there are some sources of errors due to the presence of high-level cirrus and other non-precipitating clouds often considered as precipitating with this simple relationship. After the initiation of passive microwave (MW) measurements, several existing VIS/IR techniques were re-examined and some of the well-known problems such as inferring precipitation only from cloud top information were addressed. At passive MW frequencies, the attenuation of upwelling radiation is mainly due to oxygen and water vapor. Thus, MW techniques are physically more appropriate than those based on VIS/IR radiation. Depending on the frequency of the upwelling radiation, the size and type of precipitation particles can be detected (Liu and Curry, 1993). Some commonly used passive MW precipitation estimation techniques use scattering index (SI) (Ferraro et al., 1994) and polarization corrected temperature (PCT) (Spencer et al., 1989) for precipitation estimation over land and ocean. Moreover, the combined use of SI and PCT can provide more accurate precipitation estimates than the single SI or PCT based method (Mahesh et al., 2011). An overview of passive MW rainfall estimation methods is given by Wilheit et al. (1994) and Gairola et al. (2003). Various geophysical parameters like rain rate, cloud liquid water, integrated water vapor, ocean surface wind speed, etc., can also be estimated using microwave measurements. The biggest limitation of MW sensors over VIS/IR sensors is their poor spatial and temporal resolution. Hence, passive MW techniques perform mainly for instantaneous applications over land and oceans, while combined IR and MW techniques show improvement in a wide variety of applications. Merging of MW, VIS and IR imagery data provides further scope for the improvement of instantaneous rainfall retrievals. The Adjusted Geostationary Operational Environmental Satellites Precipitation Index (GOES-AGPI) method proposed by Adler et al. (1994) corrects the GOES Precipitation Index (GPI) monthly rainfall estimates (Arkin and Meisner, 1987) using an adjustment factor based on MW and IR data. Xu et al. (1999) developed the MW and IR data-based new Universally Adjusted GPI (UAGPI) method, which provides stable estimates of monthly rainfall at different spatial scales. Gairola et al. (2015a) demonstrated a combined satellite-IR and rain gauge-based rainfall algorithm and the results were highly encouraging.
Global satellite-based rainfall products are being generated from various sources like low earth orbiting microwave sensors, IR sensors in geostationary platforms, and combined microwave and IR observations from various satellite missions using a variety of merging techniques (e.g., Sorooshian et al., 2000; Kuligowski, 2002; Kidd et al., 2003; Turk and Miller, 2005; Huffman et al., 2007; Kubota et al. 2007; Joyce et al., 2011; Mitra et al., 2003, 2009, 2013). All the available products differ in measurement accuracy, sampling frequency, and merging methodology. MW sensors are the most suitable instruments for estimating precipitation, since the radiative signatures are more directly linked to precipitating particles, whereas IR sensors on geostationary platforms only provide precipitation estimates from cloud top radiances at high temporal resolutions (up to 15-min intervals on some platforms). The microwave-calibrated infrared measurements of brightness temperature can provide essential information for the estimation of rainfall fields, decreasing the traditional dependency on the point measurements.
In the present study, the Global Precipitation Mission (GPM) Microwave Imager (GMI) estimated rainfall, based on the Goddard profiling algorithm (GPROF) (Kummerow et al., 2015), is used for merging with INSAT-3D IR based rainfall. The IMSRA algorithm (Gairola et al., 2015b) has been applied routinely to INSAT-3D data for estimating rainfall over Indian land and oceanic regions. For each INSAT-3D image, collocated passes of GPM are used for objective analysis. This experiment was done for all available images of INSAT-3D for the complete period of the 2015 southwest (SW) monsoon. GMI-based rainfall data is considered as the more accurate rainfall product for merging with IR-based INSAT-3D rainfall data. Finally, both the ground based and the concurrent independent satellite based products are utilized for validation. The dominant component for the validation of merged IMSRA (M-IMSRA) rain products are ground data for a period longer than 122 days (June 1 to September 30, 2016) of rain gauge data from the Indian Meteorology Department (IMD). This represents the complete SW monsoon domain, having all possible dynamic ranges of rainfall amounts. The M-IMSRA data is also validated with independent data form the Tropical Rainfall Measuring Mission (TRMM) Multi-satellite Precipitation Analysis (TMPA-3B42) (Huffman et al., 2003; 2007), and with the concurrent Integrated Multi-satellitE Retrievals for GPM (IMERG) product (Huffman et al., 2015).
2. Data sources
2.1 INSAT-3D data
The INSAT-3D satellite is an advanced weather satellite launched by the Ariane-5 ECA and operating since July 26, 2013. This geostationary satellite carries four payloads: a six channel multi-spectral imager, a 19 channel sounder, a data relay transponder (DRT), and search and rescue transponders. The multi-spectral imager operates in six wavelength bands, namely visible, short wave IR (SWIR), mid wave IR (MWIR), water vapor (WV), thermal infrared-1 (TIR1) and thermal infrared -2 (TIR2). The details of wavelengths and spatial resolutions are presented in Table I. The operational product used for this study is the INSAT Multi-Spectral Rainfall Algorithm (IMSRA), which takes advantage of the accuracy of MW-based estimates and relatively low sampling errors of IR-based estimates (Prakash et al., 2009; Gairola et al., 2010). The development of IMSRA includes two major steps: the classification of rain-bearing clouds with a cloud classification scheme (Roca et al., 2002) utilizing Kalpana-1 IR and WV BTs. This scheme is able to delineate the non-raining clouds based on the threshold BTs in both IR and WV channels. Afterwards, a proper spatial and temporal collocation of Kalpana-1 IR BTs with TRMM-precipitation radar (PR) surface rain rate is generated to establish a regression relation between them. The rainfall products from this method were tested for different weather conditions in different temporal and spatial scales using standard rainfall products and satisfactory error statistics were reported (Prakash et al., 2009; 2010; Mahesh et al., 2014a, b; Gairola et al., 2014; Bushair et al., 2016, 2019). This algorithm was developed for small-scale precipitation estimation over the Indian region and the rainfall dataset may be downloaded from https://www.mosdac.gov.in.
Table I INSAT-3D imager band names, wavelengths and spatial resolution.
| Band name | Wavelength (μm) | Spatial resolution (km) |
| Visible (VIS) | 0.55-0.75 | 1 |
| Short wave infrared (SWIR) | 1.55-1.70 | 1 |
| Middle wave infrared (MWIR) | 3.80-4.0 | 4 |
| Water vapor (WV) | 6.50-7.10 | 8 |
| Thermal infrared-1 (TIR1) | 10.3-11.3 | 4 |
| Thermal infrared-2 (TIR2) | 11.50-12.50 | 4 |
2.2 GPM-GMI rainfall products
The GPM mission is exclusively intended for advanced precipitation measurements from a low-Earth orbit platform using microwave sensors. After the success of TRMM, the National Aeronautics and Space Administration (NASA) and Japan Aerospace Exploration Agency (JAXA) successfully launched the GPM core satellite on February 28, 2014. The satellite carries the first space borne dual-frequency precipitation radar (DPR) operating at Ku (13.6 GHz) and Ka (35.5 GHz) and a conical-scanning multichannel (10-183 GHz) microwave imager (GMI). This sensor package is an advanced form of TRMM instruments (Kummerow et al., 1998), and has the capability to estimate from heavy rain to light rain over tropical and subtropical land and oceans. The Ku band precipitation radar (KuPR) and Ka band precipitation radar (KaPR) provide co-aligned 5-km resolution footprints on Earth’s surface, with cross track swath widths of 245 km and 120 km, respectively. Both radars have nominal vertical range resolution of 250 m, sampled at every 125 m (Hou et al., 2014). Heavy, moderate, and light precipitation can be detected with the help of different channels (10 to 183 GHz) present in the GMI sensor. For this study, GPM-GMI retrieved rainfall is used (Kummerow et al., 2015; Brown et al., 2016), which is downloaded from the Precipitation Processing System (PPS).
2.3 Integrated Multi-satellitE retrievals for GPM (IMERG)
IMERG is an integrated algorithm that provides a multi-satellite precipitation product in every half hour at 0.10º × 0.10º resolutions based on the GPM satellite. This algorithm inter-calibrates, merges and interpolates all available satellite microwave precipitation estimates (Table II) together with microwave-calibrated IR satellite estimates, precipitation gauge analyses, and potentially other precipitation estimators at fine time and space over the entire globe (Huffman et al., 2015; Kirschbaum et al., 2016). IMERG also includes temporal interpolation and “morphing” of MW rain rate estimates using IR data. Recently, Prakash et al. (2015) assessed the performance of the GPM-based IMERG rainfall product against IMD rain gauge data over the Indian territory. A notable improvement over TMPA-3B42 for detecting heavy rainfall frequency across India at daily time scale during SW monsoon season was reported. In this study, the IMERG product is used for qualitative comparison to assess the accuracies of the proposed regional algorithm for merging with INSAT-3D. IMERG data is downloaded from the Precipitation Processing System (PPS) webpage at ftp://arthurhou.pps.eosdis.nasa.gov/.
Table II Members of the GPM constellation.
| Advanced Microwave Scanning Radiometer (AMSR)-2/Global Change Observation Mission for Water (GCOMW)-1 |
| Special Sensor Microwave Imager/Sounder (SSMIS)/Defense Meteorological Satellite Program (DMSP) |
| Microwave Analysis and Detection of Rain and Atmospheric Structures (MADRAS)/Megha Tropiques |
| Sounder for Probing Vertical Profiles of Humidity (SAPHIR)/Megha Tropiques |
| Microwave Humidity Sounding (MHS)/National Oceanic and Atmospheric Administration (NOAA)-19 |
| MHS/Meteorological operational satellite (MetOP) series |
| Advanced Technology Microwave Sounder (ATMS)/Suomi National Polar-orbiting Partnership (SNPP) |
| ATMS/Joint Polar Satellite System (JPSS) and Defense Weather Satellite System (DWSS) |
2.4 TMPA-3B42 data
TRMM was a joint US-Japan Satellite Mission to monitor tropical and subtropical precipitation and to estimate its associated latent heating. It was launched in late November 1997 to a near circular orbit approximately at 350 km altitude (raised to 403 km since 2001) at a 35º inclination from the equatorial plane. After 17 years of productive service in space, the instruments of TRMM switched off on 08 April, 2015. The complete description of the sensor package of TRMM is given by Kummerow et al. (1998). The operational TRMM data set used in the present study is called 3B42, which is a merged product from Geostationary IR and Microwave data (Huffman et al., 2003, 2007). The 3B42 estimates are produced in four stages: (1) calibrating and combining the microwave estimates precipitation, (2) creating the infrared precipitation estimates using calibrated microwave precipitation, (3) combining the microwave and IR estimates, and (4) rescaling to monthly data. Even though the satellite is switched off, the TMPA-3B42 product is still generated (likely to be continued in 2018) from all available sensors. This product has been obtained from the TRMM Online Visualization and Archive System (TOVAS) in 0.25º x 0.25º grid for inter-comparison purposes. The TMPA-3B42 product is also used for validation purposes.
2.5 IMD gridded gauge based rainfall data
Surface rain gauge (SRG) based daily gridded rainfall data over the Indian land is available since January 1901 at a spatial resolution of 0.25º × 0.25º. This data set is prepared by the India Meteorological Department (IMD) from daily measurements from about 7000 SRG stations well-spread across the country after performing the necessary quality control test (Pai et al., 2014), which involves verifying the location of the gauge station, eliminating missing data and coding errors, performing extreme value checks, etc. These data are interpolated using the Shepard interpolation method into a regular grid. The distribution of gauges over India is satisfactory in terms of number and regional distribution, except some small regions of Jammu and Kashmir, as well as the extreme northwest parts of India (Pai et al., 2014).
3. Methodology
Satellites with suitable IR and MW sensor channels provide very useful information about rainfall. These datasets could be further improved using ground station values by blending satellite data with station(s) data. The common procedure adopted in blending is performed using a modified inverse distance weighting (IDW) approach that borrows some concepts from the kriging, particularly simple and ordinary kriging. The basic process uses two datasets: (1) a point dataset with values at discrete points in space (e.g., rain gauges) which requires fairly good information to ensure reasonable representativeness and (2) a grid dataset with values varying continuously over space (e.g., a satellite-based rainfall estimate pixel, grid or a climatic average). With this concept, INSAT-3D IMSRA derived rainfall and GMI derived rainfall (>1 mm hr-1) are merged using the successive correction method (Cressman, 1959; Thiebaux and Pedder, 1987), which is one of the most popular and simple techniques. The basic need for augmentation of INSAT-3D-based IMSRA rainfall data is that it underestimates high rain events. At the same time, multichannel microwave measurements from GMI portray heavy rainfall quite well. Less than 1 mm hr-1 of rainfall may invariably be seen in GMI, as observed in the sub-satellite tracks (Figs. 1b and 2b) where it seems like noise or artifacts that could influence the final products. Thus, a threshold of 1mm hr-1 is reasonably chosen for removing the noise while combining the two measurements mainly for heavy rain events. In the successive correction method, observations (here GMI rainfall) are treated as point measurements and these values are objectively utilized for correcting the background data (here IMSAR rainfall). Recently, Jangid et al. (2017) used this method to improve the accuracy of INSAT-3D sea surface temperature (SST) estimates by merging polar-orbiting Aqua Moderate Resolution Imaging Spectroradiometer (MODIS) SST at daily scale over the tropical Indian Ocean.
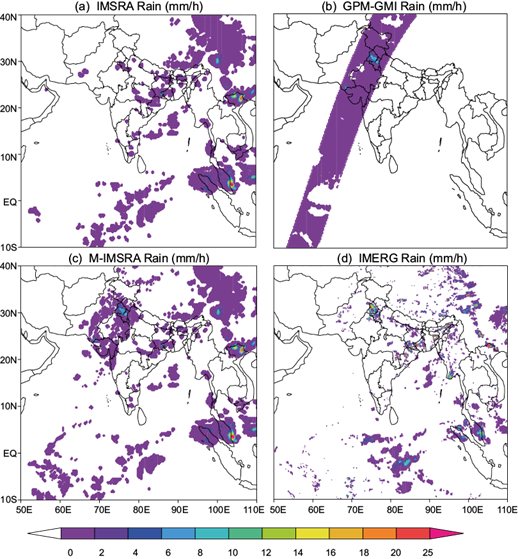
Fig. 1 Rainfall estimation for July 3, 2015 at 1400 GMT from (a) IMSRA, (b) GPM-GMI, (c) M-IMSRA and (d) IMERG.
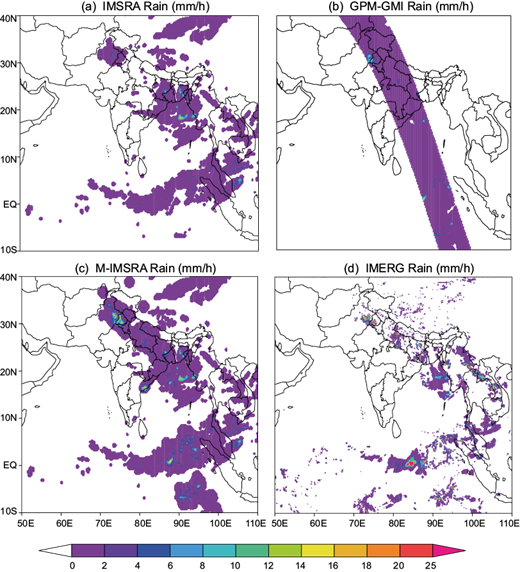
Fig. 2 Rainfall estimated on 06 July, 2015 at 2300 GMT from (a) IMSRA, (b) GPM-GMI, (c) M-IMSRA and (d) IMERG.
This method involves the modification of the INSAT-3D IMSRA based rain using GPM-GMI MW rain. The background IMSRA field is modified by the reliable information from GMI iteratively during several analysis scans until the correction between the interpolated value and actual information converges (Gairola et al. 2015a). A distance-dependent method is used to calculate the interpolated weights and the correction factor (C) is estimated using the following equation:
where P o is rainfall at the observation point, P p is the interpolated grid point data at the observation point, N is the number of observations, and the W is the weight given by
where R is the radius of influence of rainfall and d is the distance to the nearest reliable data point from the grid. The values of R used in the successive correction method start from 10 km up to 50 km, at the interval of 10 km.
A maximum of 48 images every 30 min are available per day from INSAT-3D, in which IMSRA rainfall is used as background field. Here, if a GMI pass is available over its scanning region within 10 min of each INSAT-3D image scan time, the GMI derived rainfall is considered as the reliable data and it is merged with INSAT-3D rainfall to a spatial resolution of ~10 km using the successive correction method. This time interval is chosen as optimal because a polar orbiting satellite (like GPM) takes approximately 10 min to cover the common area of study of a typical geostationary tropical observation.
The skill of IMSRA and M-IMSRA are evaluated using different verification scores. The four count (a, b, c, d) events in the 2 × 2 contingency table, which contains the number of hits, false alarms, misses, and correct rejections at different thresholds, are used to assess the performance of the algorithms (Mason, 2003). The bias score (BS), hit rate (HR), equitable threat score (ETS) and extreme dependence score (EDS) are computed based on the contingency table for different thresholds. A brief description of these statistical scores is given by Wilks (1995) and Ashok et al. (2002). The BS compares the total number of times an event is forecasted/estimated with the total number of times an event is observed:
For an unbiased estimation, BS = 1, whereas BS >1 corresponds to an overestimation and BS < 1 to an underestimation. The hit rate is the ratio of correct estimation to the total observed events:
The value of HR ranges from 0 to 1, and the more accurate the estimate, the higher the value. The equitable threat score (ETS) measures the ability to estimate/predict the precipitation above a given threshold and its value ranges from -1/3 to 1. For a perfect estimation/forecast the value of ETS should be 1; if it goes below 0, the estimation/forecast can be called as unskilled:
where
The ETS has the disadvantage of tending to 0 for extreme rare events. This creates the misleading impression that rare events cannot be skillfully estimated/forecasted. The extreme dependency score (EDS) is proposed as a more informative alternative for the assessment of such extreme rare events irrespective of the precipitation amount (Stephenson et al., 2008). For a perfect prediction/estimation EDS will be 1:
4. Results and discussion
Even though there is significant rainfall magnitude variation across land, India receives an annual average rainfall of 105 cm for the entire country, of which about 80% is contributed by the SW monsoon (Selvaraju, 2003). The successive correction method is applied to the INSAT-3D derived IMSRA half hourly rainfall for the 2015 SW monsoon season (June 1 to September 30, 2015) and M-IMSRA is generated. The results of some case studies are presented here for brevity. One case study corresponding to July 3, 2015 at 1400 GMT is presented in Figure 1. The GPM pass along the Indian region is selected during this time (within 15 min) and the successive correction method is applied. Ideally, how quickly precipitation features are likely to change, depends on the de-correlation length of the rainfall process in time and spatial domain. Thus, the temporal separation has been chosen well within the time and spatial window of both INSAT-3D and GMI observations, which have been followed for synergy and blending in the present study.
The rainfall pattern ranging from 2-6 mm around 30º N and 77º E is not registered by the IMSRA product (Fig. 1a), but the GMI rainfall retrieved from the MW sensor (Fig. 1b) has clearly registered that specific high region with orography-induced rainfall around Himachal Pradesh in north of India. The light rainfall around 25º N and 69º E is also missing in the IMSRA image. After applying the successive correction method, all the MW detected rainfalls are merged with IR detected rainfall, which can be seen in the resulting product (Fig. 1c). The merged product is further compared qualitatively with the GPM-based IMERG product (Fig. 1d) for the same time. Rainfall detected around Delhi and Punjab (28º-32º N, 74º-78º E) is registered well in the IMERG product also. Rainfall patterns found around Malaysia, Philippines, West Bengal and some regions of China are comparable in both IMERG and merged products. Another example corresponds to July 6, 2015 at 2300 GMT, which is shown in Figure 2a, b, for INSAT derived IMSRA and GMI derived rain products, respectively.
Figure 2d shows high precipitation in IMERG and in the merged product (Fig. 2c) around the border between Punjab and Pakistan (30º-33º N, 74º-76º E). All other patterns in the IMERG images are also comparable with the merged product. These case studies show the advantage of physically-based MW measurements, which can be used for successive correction of the IR-based rainfall product. The quantitative comparison of M-IMSRA with IMERG is also carried out for assessment and validation. Instantaneous images of IMSRA are compared with the concurrent IMERG rainfall for the period July 1-15, 2015, when the SW monsoon is normally active and different error statistics were calculated. The correlation coefficient between M-IMSRA and IMERG shows a notable improvement from 0.4 to 0.9, while the correlation coefficient between IMSRA and IMERG improves from 0.3 to 0.7 as shown in Figure 3. Similarly, there is a significant improvement in root mean square deviations (RMSD) when M-IMSRA and IMSRA are compared with IMERG rain (Fig. 4).

Fig. 3 Correlation coefficient of IMSRA and M-IMSRA with IMERG rainfall at instantaneous scale for the period July 1-15, 2015.

Fig. 4 Root mean square deviation of IMSRA and M-IMSRA with IMERG rainfall at instantaneous scale for the period July 1-15, 2015.
Different verification scores of IMSRA and M-IMSRA for different thresholds are represented in Figure 5, considering IMERG rainfall as reliable information. The bias score of IMSRA and M-IMSRA does not show significant differences up to 20 mm hr-1, beyond which the improvement in M-IMSRA can be seen. The BS of both products is very close to 1 up to 15 mm hr-1, from which the high estimation skill of the algorithms over those thresholds may be inferred. The HR of M-IMSRA is higher than IMSRA as expected over all thresholds, which reveals the accuracy of the product for detecting rain events. The ETS of M-IMSRA is also high in all thresholds but the score gradually decreases with increasing thresholds. Over high thresholds, rain events will be less as compared to other thresholds, which may lead to low ETS values, as discussed earlier. Therefore the EDS, which is designed for extreme rare events, is found to be a more appropriate and informative verification skill as high rain events are decreasing over high thresholds. The notable point is that, over all thresholds, M-IMSRA shows higher EDS values compared to IMSRA. Hence, all verification skills clearly show the better accuracy of M-IMSRA over IMSRA over all rainfall thresholds considered.
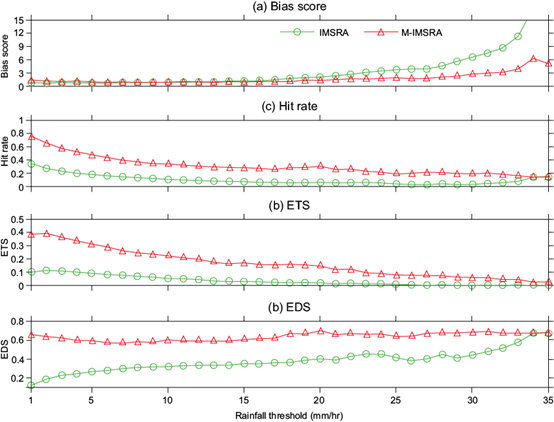
Fig. 5 (a) Bias score, (b) hit rate, (c) equitable threat score and (d) extreme dependency score from IMSRA and M-IMSRA for the period July 1-15, 2015.
Further, images augmented with the GMI rain rate are used along with routine INSAT-3D images to produce the daily rainfall product. At a particular location during a day, MW-estimated rainfall from a single pass corrects only one image of INSAT-3D out of 48. These daily rainfall products are compared qualitatively and quantitatively with the TMPA-3B42 v. 7 product. For qualitative comparison, one case study corresponding to July 15, 2015 is presented (Fig. 6). All the available passes of GPM on that specific day are shown in Fig. 6a. Rainfall retrieved from each pass is merged with collocated observations of INSAT-3D images and the average daily rainfall rate (mm hr-1) is estimated (Fig. 6b). For qualitative comparison, the difference between merged IMSRA and M-IMSRA alone is represented in Fig. 6c, where it is clear that even though GMI rainfall corrects few images of INSAT-3D in a day, the improvements concerning rainfall in the daily averaged product is observed.

Fig. 6 (a) GPM-GMI average daily rainfall rate along its track on July 15, 2015. (b) IMSRA average daily rainfall rate on July 15, 2015 after successive correction. (c) Difference between M-IMSRA and IMSRA rainfall on July 15, 2015.
Daily rainfall (mm day-1) from M-IMSRA is compared quantitatively with IMD rain gauge and TMPA-3B42 daily data at a spatial scale of 0.25º from June 1 to September 30, 2015 and different error statistics are calculated. There is no significant improvement in the correlation coefficient because only few points are corrected in a day due to the low temporal resolution of GMI compared to that of INSAT-3D. However, there is a noticeable improvement in RMSD as seen in the time series plot in Figures 7 and 8 for IMD and TMPA-3B42, respectively; error statistics are given in Table III.


Table III Statistics of M-IMSRA when compared to IMD gridded rainfall and TMPA-3B42 data for the period June 1 to September 30, 2015.
| Comparison with IMD rain | Comparison with TMPA-3B42 | |||
| IMSRA | M-IMSRA | IMSRA | M-IMSRA | |
| Correlation coefficient (R) | 0.46 | 0.50 | 0.63 | 0.68 |
| RMSD (mm) | 18.00 | 16.54 | 9.31 | 7.42 |
| Bias (mm) | 0.76 | 0.60 | -0.80 | -0.67 |
| Number of points | 588 682 | 588 682 | 14 124 527 | 14 124 527 |
Further, the M-IMSRA data set is partitioned into orographic and non-orographic regions (heights greater than 500 m are categorized as orographic terrain) over the Indian territory (Fig. 9), and validation is performed separately for each region using IMD data. The scatter plot of IMSRA and M-IMSRA with IMD rainfall over orographic and non-orographic regions is given in Figure 10. The statistics over orographic regions show that the rain estimates from the IMSRA method have a poor correlation of 0.39 with a bias of 0.99 mm and a root mean square error of 20.53 mm, whereas the M-IMSRA method has a correlation of 0.42 with a bias of 0.87 mm and a root mean square error of 19.36 mm. Similarly, the statistics over non-orographic regions show that rain estimates from the IMSRA method have a correlation of 0.51 with a bias of 0.60 mm and a root mean square error of 17.08 mm, whereas the M-IMSRA method has an improved correlation of 0.56 with a bias of 0.55 mm and a root mean square error of 15.12 mm. The algorithm performs quite well over non-orographic regions, as is evident from the error statistics. However, the slightly poor performance of the algorithm over orographic regions is obviously due to the land inhomogeneity and its influence on the distribution of precipitation.
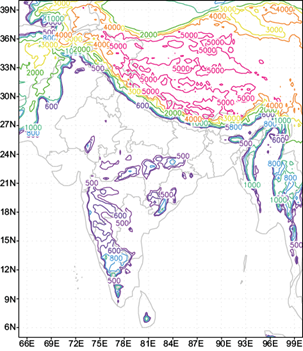

Fig. 10 Scatter plots between IMD rainfall and (a) IMSRA, (b) M-IMSRA over orographic regions, (c) IMSRA and (d) M-IMSRA over non-orographic regions for JJAS 2015. Bias, RMSD and correlation coefficient are given in each plot.
The underestimation in the IR-based rainfall product can be rectified to a large extent if the MW-detected rainfall product is continuously present for that region. Thus, the missing patterns in IR-based products could also be included in the merged product in the presence of more reliable MW measurements. Until the development of new technology permits the portability of microwave sensors in geostationary orbits with similar temporal resolution as IR sensors, tropical rainfall could be monitored more reliably by having microwave sensors on low earth orbiting satellites such as TRMM (35º) and Megha-Tropiques (28º). This study can be extended by optimally combining all possible microwave sensor observations with INSAT-3D for better products suited regionally to the Asian sector.
5. Conclusions
Near-real-time precipitation information at fine resolution is required to monitor flash floods. The combination of low earth orbiting microwave and geostationary IR-based measurements has a great potential for improving rainfall estimations on different temporal and spatial scales, and it can also address various other applications. This study is an attempt to estimate rainfall over the Indian monsoon region by the synergistic use of geostationary INSAT-3D TIR-derived IMSRA rainfall estimates and rain data from the GPM-GMI. The integrated IR and microwave method applied here for rainfall estimation shows a significant improvement over the IR-based rainfall estimates alone. This M-IMSRA product has been confirmed after the validation with IMD rain gauge data for a significant period of 122 days (June 1 to September 30, 2015) spanning the complete SW monsoon season. In addition, the comparison with independent satellite products such as TMPA-3B42, also confirms a considerable agreement in terms of root mean square deviation after correction. The qualitative and quantitative comparison shows that low inclination satellite microwave radiometer data can be used for further improvement of regional geostationary satellite data. It is concluded that M-IMSRA can provide regionally (in the Asian sector) precipitation information in a timely manner at fine spatial and temporal resolution required to monitor flash floods and daily monsoon performance. Furthermore, it is also recommended that polar orbiting GMI-like microwave sensors would be more suitable in low inclination satellite orbits like Megha-Tropiques and TRMM for significant coverage, in order to obtain more accurate tropical rainfall data for improving a number of application areas, including weather forecasting.

