


 nueva página del texto (beta)
 Inglés (pdf)
 Artículo en XML
 Referencias del artículo
 Enviar artículo por email
 Citado por SciELO
  Similares en
SciELO
Similares en
SciELO 
 Permalink
1. Introduction
The South Asian monsoon, in general, and the Indian monsoon, in particular, are two of the most important and influential phenomena of Earth’s climate system (Garnett and Khandekar, 1992; Gadgil, 2006; Roy, 2017). Eighty percent of the annual rainfall over the Indian region is generally received during the summer monsoon period, i.e., June to September (Sahai et al., 2003). In tropical countries like India, rainfall is the main input for agricultural farming as 61.3% of the gross cropped area falls under rainfed agriculture (Bhakar et al., 2008). In spite of the rapid increase in irrigated areas during the last few decades, around 80% of the farmers still solely depend on the monsoon rainfall (Bhakar et al., 2008; BLS, 2010). The success of rainfed agriculture is mostly determined by the onset and withdrawal of monsoon rainfall. For example, the pre-monsoon showers are a prerequisite for preparation of agricultural lands and the planting of crops, whereas early withdrawal of monsoon rainfall may lead to yield reduction due to moisture stress during the grain filling stages (Dixit et al., 2005). Hence, any kind of alteration in the onset, withdrawal, breaks or extreme rainfall events of Indian summer monsoon during critical crop growth stages may lead to decrease in crop acreage and reduced crop production. The spatial and temporal distribution of rainfall and its changing pattern would have a direct impact on the cropland patterns and productivity (Kumar et al., 2010). The annual and seasonal rainfall analysis gives a general idea about the prevailing rainfall patterns in the region, whereas weekly rainfall analysis was found to be more useful for agricultural planning (Reddy et al., 2008). According to Reddy (1990), the information on onset and withdrawal of rainfall along with the duration and distribution of wet spells can provide deep insight into the rainfall variability and farm management options.
The probability analysis of summer monsoon rainfall, including dry and wet spells, is being studied at regional levels. In particular, the Markov chain models have been extensively utilized by many researchers to find the probability of wet/dry weeks using long-term rainfall data over different parts of India (Pandharinath, 1991; Singh and Ranada, 2009) as well as in different parts of the globe (Gringorten, 1966; Lohani and Logananathan, 1997; Wilks and Wilby, 1999; Paulo and Pereira, 2007). Markov chain models have also been widely used in the field of natural resources, climate sciences, economics, etc. for understanding and forecasting the stochastic characters of different systems (Liu et al., 2009). This process, named after the Russian mathematician Andrey Markov (Shannon, 1948), accounts for the transition of one state to another in the form of a chain. It works like a chain where the probability of the outcomes depends on the previous step(s), i.e., the probability of being dry (wet) on a particular day is based on whether it was dry (wet) on the previous days (Tettey et al., 2017). The major assumption of the Markov chain process is that it considers the two states, i.e., dry and wet spell, mutually exclusive and completely exhaustive. The seasonal and annual rainfall patterns along with their probability distribution have been employed by many researchers for rainfed agricultural planning, probable alteration in the cropping pattern, etc., towards optimized utilization of the rainfall pattern (Sharma et al., 1979; Prakash and Rao, 1986; Chattopadhyay and Ganesan, 1995; Sharma and Thakur, 1995; Agnihotri, 1999; Bhakar et al., 2008; Reddy et al., 2008).
In the present study, a high resolution (0.5º × 0.5º) gridded rainfall data for a period of 35 years was used to study the initial and conditional probability of wet spells over the entire Indian region. The initial wet spell probability was converted to probable wet week information, and its start date and duration of the longest consecutive probable wet weeks were analyzed for agricultural planning and management.
2. Methodology
2.1 Preparation of the gridded rainfall dataset
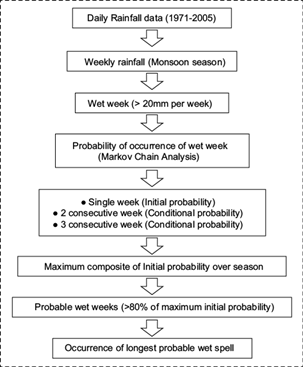
In the present study, the high-resolution daily gridded (0.5º × 0.5º) rainfall data over a 35-yr period, generated by the India Meteorological Department (IMD) for the entire Indian subcontinent, was used. As any climatic study requires a minimum of 30-35 yrs of data, we used the datasets available for 1971-2005 in this study. Similar datasets have been successfully utilized by many researchers for studying trends and rainfall patterns over the Indian region (Srivastava et al., 2008; Dash et al., 2013; Pingale et al., 2014, 2016). The Indian mainland with 34 meteorological subdivisions is shown in Figure 1. One may refer to Rajeevan and Bhate (2009) for details of the generation of gridded rainfall data. The daily rainfall data during the monsoon period, i.e., June to September, was converted to weekly cumulative rainfall. The threshold of more than 20 mm rainfall was used to consider a week as a wet spell (Pandharinath, 1991; Reddy et al., 2008). According to Reddy (1990), a minimum of 3 mm rainfall is essential for crops to satisfy their water requirements during the growing season (Yemenu and Chemeda, 2010). A week which was not able to fulfill the wet spell criteria is designated as dry spell. The detail of the methodology is given in Figure 2.

2.2 Wet spell probability using Markov chain analysis
The weekly wet spell information for each grid during the study period (1971-2005) over the Indian mainland was analyzed. The probability distribution of a wet spell for each week was estimated using the Markov chain analysis. The details of the equations are given below:
where PWw1 is the probability of the week being wet (first week), i.e., the conditional probability of dry to wet week; PWWw2 is the probability of the second week being wet, given the preceding week wet, and PWWw3 is the probability of the third week being wet, given the preceding two wet weeks.
2.3 Occurrence of the longest probable wet spell
During the Indian monsoon season, the amount and distribution of rainfall varies from one region to another in the Indian subcontinent. For example, the south-east monsoon generally hits the northeastern part of India in the initial part of June and throughout the monsoon period it remains wet. On the other hand, the western part of India generally receives its first showers during mid-July only and remains wet for a very short period. Similarly, the maximum value of the wet spell probability along with its occurrence and duration of the longest wet spell was found to be varying at spatio-temporal scale, which is mainly attributed to the variations in the onset time of the monsoon. Hence, the longest wet spell information based on a fixed probability value cannot be used for all of India for agricultural planning.
In the present study, a novel approach was adopted to find out the longest probable wet weeks, which can be further utilized for agricultural planning by rainfall water management. The maximum wet spell probability layer was generated from the weekly wet spell probability maps by using the maximum compositing technique. The maximum composite approach was adopted to estimate the maximum possible wet spell probability for a given pixel/grid during the entire study period. It was assumed that a grid is considered to be probably wet for a given week if the probability value for a wet spell was more than 80% of the maximum wet spell probability. According to Gupta et al. (1975), the rainfall at 80% probability can be safely considered as assured rainfall, whereas 50% can be taken as the maximum limit for taking risks. Based on the above-mentioned criteria, the start and duration of the longest wet spell for each grid in India was generated, which can be utilized for efficient agricultural planning and determining the cropping pattern. The duration of the longest wet spell represents the number of continuous weeks that fulfill the above criteria, i.e., 80% of the maximum wet spell probability for a given grid, whereas the start of the longest wet spell is the starting week of the longest spell.
3. Results and discussion
3.1 Initial wet spell probability
The initial probability (P W ) of wet spell, derived from 35-yrs daily rainfall data using the Markov chain model, is shown in Fig. 3. It was observed that the spatio-temporal distribution of the wet spell probability values represents the progress of the summer monsoon over the Indian region. At the start of June, the P W of wet spell was more than 80% in Kerala, northeastern parts of India, sub-Himalayan West Bengal and coastal Karnataka. With the progress of the monsoon season, the higher probability values spread over the western coast and eastern India. At the end of June, the entire west coast and northeastern India; the eastern region covering the Gangetic West Bengal, Jharkhand, Orissa, Chhattisgarh and parts of East Madhya Pradesh, Bihar, Vidarbha; the northern region covering parts of east Uttar Pradesh, Uttarakhand, Himachal Pradesh, the P W value was more than 80%. Whereas a value of more than 70% was observed in Bihar, Uttar Pradesh, Madhya Pradesh, Vidarbha, Marathwada and some parts of Telangana and coastal Andhra Pradesh in southern India. During July, the entire central and northern India, covering Vidarbha, east and west Madhya Pradesh, east Rajasthan, east and west Uttar Pradesh, Himachal Pradesh, Uttarakhand and parts of Marathwada, Haryana, Punjab, along with the entire east and northeastern region, achieved high P W values. During the 29th standard meteorological week (SMW) the overall PW was highest among all the SMW of the monsoon season, i.e., from the 22nd to the 39th week.
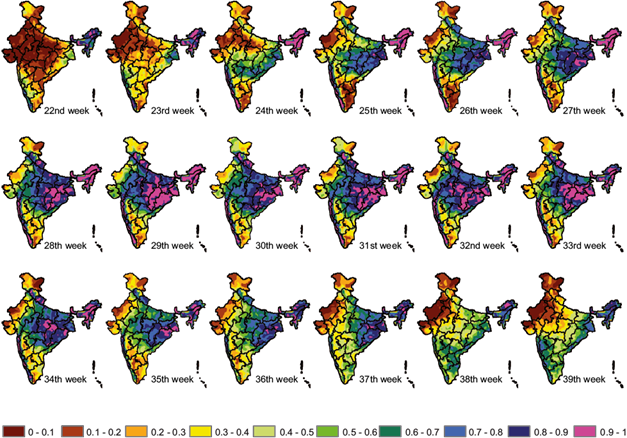
An almost static scenario between the 28th and 32nd SMW was observed. During these weeks, consistent high rainfall was received in most parts of the country, represented by the high wet spell probability values. Beyond mid-August, the withdrawal of the Indian summer monsoon (ISM) symptom was observed, represented by the decreasing values of P W in the western and central parts of India. According to the Indian Meteorological Department (IMD), the withdrawal of the ISM starts around the September 1 over west Rajasthan, whereas it begins around October 1 over central India (https://www.tropmet.res.in/~kolli/MOL/Monsoon/year2016/Monsoon-2016.pdf). The withdrawal of the monsoon phenomenon is associated with enhanced convective activity along with the dry phase of the inter-seasonal oscillation. The dynamic and elongated low pressure zones build up over north-west India due to excessive solar radiation, generally known as monsoon trough, leads to remarkable alterations in the rainfall pattern (Syroka and Toumi, 2004).
The spatial as well as interannual variability of the ISM withdrawal was found to be higher than its onset (Syroka nad Toumi, 2004), and similar information was successfully utilized for studying rainfall variability, water resource management, relationship with crop harvest, spread of malaria, etc. (Das, 1987; Mooley and Shukla 1987; Rupa Kumar et al., 1992; Bouma and Van der Kaay, 1996). It is interesting to note that except for parts of Telangana, coastal Andhra Pradesh, northern Tamil Nadu and south interior Karnataka, almost the entire southern India could hardly achieve wet spell probability values of more than 40% up to the 34th SMW, i.e., the last week of July. Beyond this week, the P W was increased in this region, whereas in the rest of India the probability started decreasing. This may be attributed to the withdrawal of monsoon rainfall from most of India and the commencement of north-east monsoon in southern India. The observations related to the onset, progression and withdrawal of summer monsoon over the Indian region have been reported by many researchers (Mooley and Shukla, 1987; Ananthakrishna and Soman, 1988; Despande and Singh, 2010).
3.2 Conditional probability of wet spell for consecutive weeks
The conditional probabilities of two and three consecutive wet weeks (2W and 3W, respectively) starting with the 22nd week on all India, are shown in Figures 4 and 5, respectively. During the initiation of the monsoon season, i.e., 22nd-23rd SMW, almost the entire Indian region except the western and northeastern parts, showed low probability (< 60%) for two consecutive wet spells. With the progress of the monsoon season, the 2W started increasing. The pattern of increase in the 2W followed the similar pattern of the P W , but the values, in terms of conditional probability, are lower than initial probability. The overall highest 2W values were observed during the 29th week, when in most the parts of India the values were more than 60% with some patches of more than 80% over the northeast, east and central India. The 2W values remained below 20% up to the 33rd SMW in most parts of southern India, representing a very low probability of two consecutive wet spells. Similar to the P W , the values of 2W in southern India started increasing beyond the 35th SMW, i.e., during mid-September. The start of the monsoon withdrawal symptoms was also captured by the decreasing values of 2W beyond the 33rd week almost over all India. It was interesting to note that in the entire west Rajasthan and Gujarat region, the 2W values could reach more than 20% throughout the monsoon season, depicting very low chances of getting persistence wet spells.
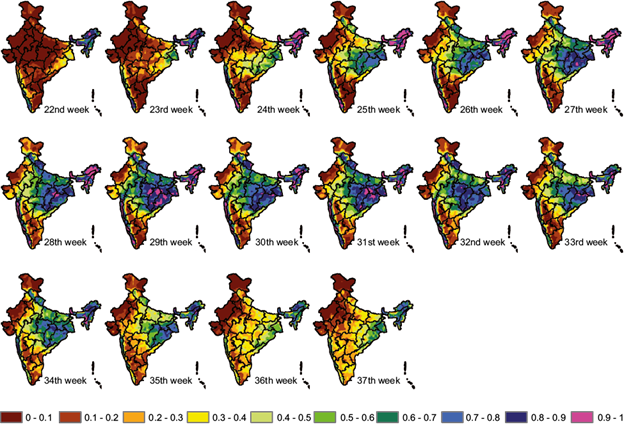
Fig. 4 Probability of two consecutive wet weeks starting on a week based on the Markov chain model (1971-2005).
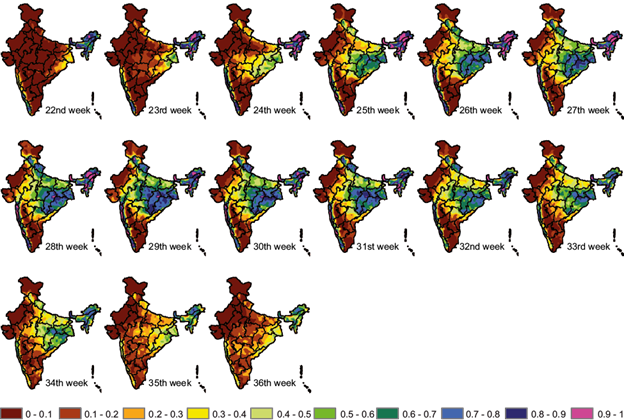
Fig. 5 Probability of three consecutive wet weeks starting on a week based on the Markov chain Model (1971-2005).
On the contrary, in the west coast and northeastern parts of India, very high 2W values (> 80%) were observed throughout the monsoon season. Low probability values in western India may lead to insufficient water supply for agricultural needs, whereas persistent rainfall in the northeast of the country may result in flood-like situations.
During the initial part of the monsoon season, the probability of wetness for three consecutive weeks was found to be much less in most of India, except the western coast and northeastern parts of the country. The values of 3W were more than 70% in the above mentioned regions, whereas the values were < 10% in the rest of country, except parts of west Bengal and Orissa (with 3W values around 30 to 40%). The probability values remained high throughout the monsoon season in the northeastern meteorological subdivisions of India, whereas the values remained lower than 10% in regions covering west Rajasthan, Gujarat, Madhya Maharashtra, north and south interior Karnataka, Rayalseema, Tamil Nadu. Similar to the P W , and 2W, the wet spell probability of three consecutive weeks also showed the progress of the monsoon in the Indian mainland. The highest 3W values were found during the 29th SMW, whereas beyond the 33rd week a clear monsoon withdrawal symptom was observed in most parts of India. Unlike the rest of India, in the southern parts of the country, specifically Tamil Nadu and parts of Andhra Pradesh and Karnataka, the northeastern monsoon plays a major role along with the southwestern monsoon rainfall. The northeastern monsoon over south India could be captured by the Pw, however it was not observed in 2W and 3W. This may be due to the fact that the northeastern monsoon generally occurs beyond October, which is facilitated by the withdrawal of the southwestern monsoon.
The subdivision-wise mean wetness probability for 3W is shown in Table I. As discussed earlier, the distribution of the 3W varied spatially as well as temporally. The longest wet spell with considerable 3W values (> 60%) was observed over the Assam and Meghalaya subdivision, followed by Konkan and Goa. Whereas, very low 3W values (< 25%) were found in subdivisions like Saurashtra, Gujarat, south and north interior Karnataka and Rayalseema, denoting very low rainfall regimes not suitable for rain-fed agriculture. The subdivisions including Nagaland-Manipur-Mizoram-Tripura (NMMT), the sub-Himalayan West Bengal, Chhattisgarh, Orissa, Jharkhand, Gangetic West Bengal and coastal Karnataka showed an intermediate level of 3W values (40 to 60%) with moderate persistence, representing a favorable rainfall distribution for rain-fed agricultural activities. The highest values of 3W during the monsoon season varied from one meteorological subdivision to another. For example, in Assam and Meghalaya the highest value was 0.76, whereas it was 0.79 in Chhattisgarh with less persistent wet spells. Similarly, in the case of Saurashtra the highest 3W value was less than 10% during the whole monsoon and around 20% over north interior Karnataka. Hence, the maximum values of wet spell probability and its persistency was found to vary from one meteorological subdivision to another. Dry and wet spells largely depend on the monsoon depression over the Bay of Bengal. Recently, Midya et al. (2019) reported that a variation of meridional SST gradient during pre-monsoon months and the frequency of the north-west Pacific weather system (number of typhoons and super typhoons) during monsoon months may be possible causes of change of the monsoon depression over the Bay of Bengal. Moreover, the association by El-Niño events and deficiency of rainfall is also reported by different scientists throughout the world. The spatial variations in wind patterns, amount of water vapor, presence of cloud condensation nuclei, etc., may be some of the governing factors along with orographic effect towards variations and persistency of wet spells across different parts of India. Recent studies showed that condensation cannot start without cloud condensation nuclei (CCN) of proper dimension. The biogenic volatile organic compounds (BVOC) emitted by forest zones act as CCN, which affects the rainfall patterns in those forests (Midya et al., 2015). On the other hand, Ganda et al. (2012) reported that rainfall in urban areas gradually increases with respect to non-urban belts. It is concluded that anthropogenic volatile compounds (AVOC) produced due to vehicular pollution, urban heat island, etc., may be the cause of the increase in rainfall patterns over the urban region.
Table I Meteorological subdivision-wise condition probability for three consecutive wet weeks during each week of the monsoon period.
| Meteorological subdivisions | 22nd | 23rd | 24th | 25th | 26th | 27th | 28th | 29th | 30th | 31st | 32nd | 33rd | 34th | 35th | 36th |
| Jammu and Kashmir | 0.02 | 0.02 | 0.03 | 0.06 | 0.07 | 0.09 | 0.10 | 0.10 | 0.07 | 0.05 | 0.06 | 0.06 | 0.04 | 0.02 | 0.01 |
| Himachal Pradesh | 0.05 | 0.10 | 0.19 | 0.29 | 0.34 | 0.41 | 0.47 | 0.48 | 0.47 | 0.40 | 0.37 | 0.32 | 0.23 | 0.15 | 0.09 |
| Punjab | 0.02 | 0.05 | 0.15 | 0.25 | 0.35 | 0.42 | 0.43 | 0.46 | 0.42 | 0.40 | 0.34 | 0.29 | 0.23 | 0.09 | 0.04 |
| Uttarakhand | 0.09 | 0.22 | 0.23 | 0.40 | 0.52 | 0.58 | 0.61 | 0.64 | 0.64 | 0.60 | 0.57 | 0.49 | 0.40 | 0.25 | 0.16 |
| Haryana | 0.02 | 0.04 | 0.07 | 0.15 | 0.19 | 0.27 | 0.28 | 0.29 | 0.27 | 0.25 | 0.18 | 0.19 | 0.12 | 0.05 | 0.04 |
| West UP | 0.03 | 0.09 | 0.15 | 0.28 | 0.43 | 0.45 | 0.59 | 0.55 | 0.55 | 0.50 | 0.41 | 0.36 | 0.30 | 0.15 | 0.11 |
| West Rajasthan | 0.00 | 0.00 | 0.00 | 0.01 | 0.03 | 0.05 | 0.04 | 0.05 | 0.05 | 0.03 | 0.04 | 0.03 | 0.02 | 0.01 | 0.00 |
| Arunachal Pradesh | 0.48 | 0.51 | 0.52 | 0.56 | 0.54 | 0.54 | 0.51 | 0.46 | 0.46 | 0.42 | 0.38 | 0.39 | 0.40 | 0.36 | 0.37 |
| Assam and Meghalaya | 0.68 | 0.70 | 0.75 | 0.76 | 0.76 | 0.74 | 0.72 | 0.69 | 0.66 | 0.67 | 0.63 | 0.61 | 0.60 | 0.53 | 0.50 |
| East UP | 0.04 | 0.13 | 0.17 | 0.33 | 0.51 | 0.49 | 0.56 | 0.55 | 0.53 | 0.53 | 0.40 | 0.41 | 0.39 | 0.21 | 0.15 |
| East Rajasthan | 0.00 | 0.02 | 0.05 | 0.11 | 0.21 | 0.21 | 0.29 | 0.33 | 0.24 | 0.23 | 0.24 | 0.18 | 0.11 | 0.05 | 0.04 |
| SHWB | 0.48 | 0.50 | 0.52 | 0.55 | 0.55 | 0.55 | 0.54 | 0.52 | 0.51 | 0.52 | 0.50 | 0.48 | 0.46 | 0.42 | 0.39 |
| NMMT | 0.49 | 0.54 | 0.59 | 0.59 | 0.58 | 0.58 | 0.56 | 0.56 | 0.52 | 0.52 | 0.51 | 0.48 | 0.45 | 0.39 | 0.36 |
| Bihar | 0.16 | 0.25 | 0.31 | 0.45 | 0.56 | 0.57 | 0.56 | 0.56 | 0.53 | 0.53 | 0.43 | 0.43 | 0.45 | 0.30 | 0.24 |
| West MP | 0.01 | 0.07 | 0.15 | 0.25 | 0.34 | 0.37 | 0.42 | 0.54 | 0.44 | 0.40 | 0.45 | 0.37 | 0.26 | 0.17 | 0.10 |
| Jharkhand | 0.12 | 0.25 | 0.34 | 0.51 | 0.62 | 0.58 | 0.63 | 0.64 | 0.64 | 0.64 | 0.52 | 0.53 | 0.53 | 0.34 | 0.27 |
| East MP | 0.02 | 0.11 | 0.20 | 0.45 | 0.52 | 0.55 | 0.60 | 0.70 | 0.62 | 0.65 | 0.61 | 0.55 | 0.45 | 0.23 | 0.15 |
| Ganeetic WB | 0.24 | 0.41 | 0.42 | 0.54 | 0.58 | 0.59 | 0.61 | 0.62 | 0.60 | 0.55 | 0.51 | 0.54 | 0.45 | 0.38 | 0.33 |
| Saurashtra | 0.00 | 0.02 | 0.03 | 0.06 | 0.08 | 0.09 | 0.08 | 0.10 | 0.06 | 0.03 | 0.02 | 0.02 | 0.02 | 0.02 | 0.02 |
| Gujarat | 0.01 | 0.03 | 0.08 | 0.14 | 0.22 | 0.22 | 0.26 | 0.32 | 0.22 | 0.19 | 0.19 | 0.14 | 0.11 | 0.07 | 0.06 |
| Chhattisgarh | 0.06 | 0.17 | 0.36 | 0.62 | 0.70 | 0.73 | 0.76 | 0.79 | 0.74 | 0.77 | 0.67 | 0.62 | 0.57 | 0.33 | 0.20 |
| Orissa | 0.19 | 0.29 | 0.46 | 0.60 | 0.65 | 0.69 | 0.70 | 0.73 | 0.69 | 0.68 | 0.66 | 0.64 | 0.56 | 0.40 | 0.30 |
| Madhya Maharashtrata | 0.07 | 0.11 | 0.18 | 0.22 | 0.30 | 0.28 | 0.31 | 0.37 | 0.31 | 0.25 | 0.27 | 0.19 | 0.14 | 0.13 | 0.15 |
| Vidarbha | 0.04 | 0.14 | 0.32 | 0.43 | 0.50 | 0.48 | 0.52 | 0.56 | 0.51 | 0.49 | 0.47 | 0.38 | 0.32 | 0.21 | 0.18 |
| Marathwada | 0.05 | 0.08 | 0.15 | 0.18 | 0.20 | 0.21 | 0.24 | 0.23 | 0.22 | 0.19 | 0.21 | 0.15 | 0.14 | 0.16 | 0.20 |
| Konkan and Goa | 0.26 | 0.44 | 0.63 | 0.69 | 0.74 | 0.75 | 0.77 | 0.77 | 0.76 | 0.73 | 0.68 | 0.60 | 0.48 | 0.36 | 0.39 |
| Telangana | 0.06 | 0.10 | 0.26 | 0.35 | 0.36 | 0.45 | 0.51 | 0.46 | 0.46 | 0.41 | 0.39 | 0.30 | 0.23 | 0.19 | 0.20 |
| Coastal AP | 0.06 | 0.07 | 0.16 | 0.18 | 0.19 | 0.30 | 0.29 | 0.29 | 0.30 | 0.28 | 0.24 | 0.24 | 0.22 | 0.20 | 0.24 |
| NI Karnataka | 0.07 | 0.09 | 0.14 | 0.14 | 0.14 | 0.16 | 0.20 | 0.18 | 0.19 | 0.14 | 0.11 | 0.11 | 0.13 | 0.15 | 0.19 |
| Rayalaseema | 0.02 | 0.02 | 0.06 | 0.07 | 0.08 | 0.12 | 0.13 | 0.11 | 0.12 | 0.13 | 0.11 | 0.11 | 0.12 | 0.14 | 0.15 |
| SI Karnataka | 0.05 | 0.04 | 0.07 | 0.09 | 0.08 | 0.10 | 0.12 | 0.11 | 0.13 | 0.14 | 0.07 | 0.05 | 0.09 | 0.09 | 0.12 |
| Coastal Karnataka | 0.49 | 0.61 | 0.70 | 0.72 | 0.73 | 0.71 | 0.73 | 0.75 | 0.73 | 0.68 | 0.60 | 0.46 | 0.35 | 0.28 | 0.30 |
| TamilNadu | 0.04 | 0.04 | 0.04 | 0.03 | 0.04 | 0.06 | 0.07 | 0.05 | 0.08 | 0.08 | 0.07 | 0.07 | 0.13 | 0.11 | 0.15 |
| Kerala | 0.52 | 0.57 | 0.62 | 0.62 | 0.61 | 0.58 | 0.60 | 0.61 | 0.56 | 0.55 | 0.45 | 0.32 | 0.27 | 0.25 | 0.27 |
3W > 50% are shown in grey; 3W > 75% in bold characters.
3.3 Start and duration of the longest probable wet weeks
In the present study, a threshold approach (i.e., 80% of the maximum initial probability) has been adopted to standardize the effect of spatial variability. A week was designated as probable wet week if the initial probability of the week was more than 80% of the maximum P W for a given pixel. For example, the values for a week to be considered as probable wet week should be 0.72 and 0.40 for pixels with maximum initial probability of 90% and 50%, respectively. Hence, the above-mentioned threshold was utilized to calculate the maximum probability of occurrence of a wet week, the total duration of the longest probable consecutive wet weeks and its starting week. The span of the longest probable wet weeks can be used for improved rain-fed agricultural planning, i.e., time of sowing/planting, selection of crops and varieties based on their length of growing period, harvesting of the crops to avoid wet weeks, etc.
The details of the maximum probability for occurrence of a wet week, duration and start week of the longest probable wet weeks over the Indian region is given in Figure 6. It was observed that in all northeastern India and the western coast, along with West Bengal, Bihar, Orissa, Jharkhand, Chhattisgarh, Uttarakhand, Madhya Pradesh, Uttar Pradesh and parts of Himachal Pradesh, Telangana, Coastal Andhra Pradesh and Vidarbha, the maximum probability was more than 80%, whereas lower values (< 50%) were observed in the entire Jammu and Kashmir, West Rajasthan, Haryana, and parts of Tamil Nadu and Punjab (Fig. 6a). In the rest of the regions, the maximum wet spell probability varied from 50 to 80%. Figure 6b represents the duration of the longest probable wet weeks derived from the initial probability and proposed thresholds. The duration was almost more than 15 consecutive weeks in northeastern parts of India, whereas it was around 13 consecutive weeks in the entire western coast. The values of longest probable wet weeks were around 11 to 14 in West Bengal, whereas in most parts of Jharkhand, Bihar, Chhattisgarh, Orissa and Uttarakhand the values were between 9 and 12. The lowest values (7 to 10 for the longest consecutive probable wet weeks) were observed in parts of Vidarbha and Madhya Pradesh.
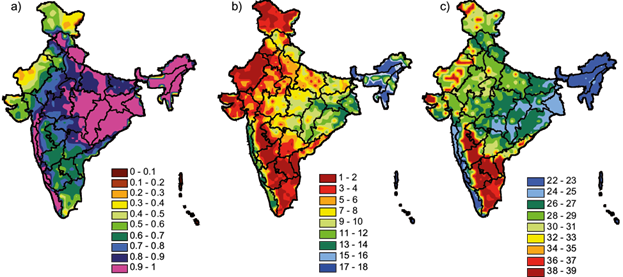
Fig. 6 Contour maps showing (a) maximum probability of occurrence of a wet week, (b) duration and (c) start week of longest probable consecutive wet weeks.
In the rest of the Indian region, the overall duration of the longest consecutive probable wet weeks was less than five, whereas in West Rajasthan, Gujarat, Madhya Maharashtra, Rayalseema, North Interior Karnatak and parts of South Interior Karnataka, Tamil Nadu and coastal Andhra Pradesh, the values were even less than two, representing either very low probability of wet spell or irregular temporal distribution of rainfall. Similarly, the start week of the longest consecutive probable wet weeks for different regions of India is given in Figure 6c. The longest consecutive probable wet weeks for most parts of northeastern India, the west coast, West Bengal and parts of Orissa, Jharkhand, Chhattisgarh and Vidarbha, generally occurred during the first fortnight of June, whereas in Uttar Pradesh, Madhya Pradesh, Haryana, Himachal Pradesh, Uttarakhand, east Rajasthan and parts of Gujarat and Telangana, this occurred in the second fortnight of June. In southern India, consisting of Tamil Nadu, Rayalseema, North and South Interior Karnataka, Madhya Maharashtra and parts of coastal Andhra Pradesh, along with parts of Gujarat and West Rajasthan, the longest spell of probable wet weeks generally started in the second fortnight of September.
In southern India, the delay may be due to the dominance of the north-east monsoon, whereas in Gujarat and West Rajasthan it might be attributed to the delayed arrival of the southwest monsoon rainfall. The meteorological subdivision-wise details of the longest consecutive probable wet weeks are given in Table II. The spatial variation in Indian summer monsoon is mainly attributed to the convection over the Bay of Bengal (Gadgil, 2003). According to Murakami (1976), consecutive wet spells result from the overlapping development of the propagation systems over the Bay of Bengal, however no such systems occur over the monsoon zone during breaks. Hence, the variations in the monsoon’s date of arrival, the meteorological parameters, land use and land cover pattern may be driving factors for the spatial variations of the longest wet spells and their corresponding persistence period.
Table II Meteorological subdivision-wise probable wet week information.
| Meteorological subdivisions | Maximum probability | Longest probable consecutive wet weeks | |||
| Threshold | Start week | End week | Duration (days) | ||
| Jammu and Kashmir | 0.47 | 0.38 | 30 | 35 | 32 |
| Himachal Pradesh | 0.77 | 0.62 | 27 | 34 | 49 |
| Punjab | 0.82 | 0.66 | 28 | 35 | 52 |
| Uttarakhand | 0.89 | 0.71 | 26 | 36 | 69 |
| Haryana | 0.68 | 0.55 | 28 | 33 | 33 |
| West UP | 0.87 | 0.69 | 28 | 34 | 41 |
| West Rajasthan | 0.41 | 033 | 32 | 34 | 16 |
| Arunachal Pradesh | 0.85 | 0.68 | 22 | 36 | 96 |
| Assam and Meghalaya | 0.99 | 0.79 | 22 | 38 | 113 |
| East UP | 0.89 | 0.72 | 28 | 35 | 49 |
| East Rajasthan | 0.69 | 0.55 | 29 | 33 | 27 |
| SHWB | 0.99 | 0.80 | 22 | 39 | 120 |
| NMMT | 0.95 | 0.76 | 22 | 38 | 110 |
| Bihar | 0.88 | 0.70 | 26 | 35 | 65 |
| West MP | 0.85 | 0.68 | 29 | 35 | 40 |
| Jharkhand | 0.91 | 0.73 | 27 | 35 | 62 |
| East MP | 0.92 | 0.74 | 28 | 36 | 56 |
| Gangetic WB | 0.94 | 0.75 | 24 | 37 | 89 |
| Saurashtra | 0.52 | 0.42 | 30 | 36 | 42 |
| Gujarat | 0.67 | 0.54 | 30 | 34 | 28 |
| Chhattisgarh | 0.96 | 0.77 | 26 | 36 | 70 |
| Orissa | 0.96 | 0.77 | 26 | 37 | 79 |
| Madhya Maharashtra | 0.77 | 0.62 | 31 | 34 | 25 |
| Vidarbha | 0.86 | 0.69 | 26 | 35 | 60 |
| Marathwada | 0.70 | 0.56 | 32 | 37 | 34 |
| Konkan and Goa | 1.00 | 0.80 | 24 | 37 | 95 |
| Telangana | 0.84 | 0.67 | 28 | 34 | 44 |
| Coastal AP | 0.75 | 0.60 | 31 | 37 | 40 |
| NI Karnataka | 0.70 | 0.56 | 34 | 37 | 25 |
| Rayalaseema | 0.65 | 0.52 | 37 | 39 | 15 |
| S.I. Karnataka | 0.64 | 0.52 | 37 | 39 | 18 |
| Coastal Karnataka | 0.84 | 0.67 | 23 | 35 | 82 |
| Tamil Nadu | 0.61 | 0.48 | 37 | 39 | 20 |
| Kerala | 0.88 | 0.70 | 26 | 36 | 70 |
| India | 0.80 | 0.64 | 28 | 36 | 55 |
4. Summary and conclusions
In the present study, the spatial analysis of the wet spell probability was carried out using daily gridded rainfall data of a 35-yr period (1971-2005). The estimated initial probability could represent the probability of occurrence of a single wet spell, whereas conditional probability showed the probability of occurrence of two and three consecutive wet weeks. Based on the estimated wet spell probabilities, the rainfall regimes existing in the Indian region can be captured. Higher wet spell probability was observed over the west coast and northeastern parts of India during the first week of June. The wet spell probability increased in the subsequent weeks as the monsoon progressed from eastern to central India, followed by northern and western parts of the country. The overall highest probability of wet spell was observed during the second fortnight of July. The withdrawal of monsoon symptoms during the first week of September were captured by decreasing probability values, whereas the increasing wet spell probability over southern India represented the initiation of northeastern monsoon rainfall. A new approach, probable wet weeks, was proposed and the start and duration of the longest probable wet weeks were calculated. The duration of the longest spell of consecutive probable wet weeks was observed in the west coast, northeast and eastern parts of India, whereas the lowest was found over the western and southern regions. The new approach could normalize the spatial variability and can be used for better agricultural planning and management.

