SciELO - Scientific Electronic Library Online

 
vol.32 issue4PM2.5 concentrations in the greenbelt near the Lin’an toll station of the Hang Rui expressway and related influencing factors author indexsubject indexsearch form
Home Pagealphabetic serial listing  

Services on Demand

Journal

Article

Indicators

Related links

  • Have no similar articlesSimilars in SciELO

Share


Atmósfera

Print version ISSN 0187-6236

Atmósfera vol.32 n.4 Ciudad de México Oct. 2019  Epub Sep 18, 2020

https://doi.org/10.20937/atm.2019.32.04.06 

Articles

Ammonia emissions and dry deposition in the vicinity of dairy farms

Miloš Zapletal1  2  3 

Pavel Mikuška4 

1 Silesian University in Opava, Faculty of Philosophy and Science, Masarykova 37, 746 01 Opava, Czech Republic.

2 Ekotoxa s.r.o. - Centre for Environment and Land Assessment, Otická 37, 746 01 Opava, Czech Republic.

3 Global Change Research Institute CAS, Bělidla 986/4a, 60300 Brno, Czech Republic.

4 Institute of Analytical Chemistry of the Czech Academy of Sciences, v.v.i., Veveří 97, 60200 Brno, Czech Republic.


ABSTRACT

We conducted the first research in the Czech Republic to measure ventilation and ammonia (NH3) emission rates in a naturally ventilated animal building (dairy farm) during a five-day measurement period in June, combined with a three-month (May-July) monitoring of NH3 concentration and dry deposition at 12 locations along horizontal gradients from the dairy farm up to the distance of 400 m. Passive diffusion-tube samplers were used to measure monthly NH3 concentrations. Moisture (H2O) balance was used to determine ventilation rates of the dairy farm. Continuous measurements of gas concentrations (NH3), temperature and relative humidity inside and outside the building were performed. The air exchange rate was 4.8 h-1 and the emission rate was 43.2 NH3 g cow-1 d-1 for building. The emission rate was 126% of what was obtained using emission factors from the Czech national inventory (34.2 g cow-1 d-1). NH3 concentrations and dry deposition fluxes decreased exponentially with distance from the dairy farm. Between May and July, mean predicted dry deposition fluxes ranged from 0.28 to 0.03 µg NH3 m-2 s-1 at a distance of 50 and 400 m from the source, respectively. Dry NH3 deposition over the nearest 400 m from the source accounted for 11.5% of daily emissions. The results confirm the short-range dispersion of NH3 emitted from a point source found in other studies, but it may not be the same in other situations, since dispersion of NH3 is dependent on the surrounding land-cover and on the number of animals in a barn.

Keywords: emission rates; moisture (H2O) balance; ammonia; stomatal uptake; dry deposition; resistance model

RESUMEN

Realizamos la primera investigación en la República Checa para medir las tasas de emisión de amoniaco y la ventilación en una granja lechera con ventilación natural, durante un periodo de medición de cinco días en junio combinado con monitoreo de tres meses (mayo-julio) de la concentración de NH3 y de la deposición seca en 12 locaciones ubicadas en gradientes horizontales desde la granja lechera hasta una distancia de 400 m. Se usaron muestreadores pasivos de tubo de difusión para medir las concentraciones mensuales de NH3. Se usó el balance de humedad (H2O) para determinar las tasas de ventilación. Se realizaron mediciones continuas de concentraciones gaseosas (NH3), temperatura y humedad relativa dentro y fuera del edificio. La tasa de intercambio de aire (AER, por sus siglas en inglés) fue de 4.8 h-1 y la tasa de emisión fue de 43.2 NH3 g vaca-1 d-1 para la construcción. La tasa de emisión fue del 126% con relación a lo estimado a partir de los factores de emisión del inventario nacional checo (34.2 g vaca-1 d-1). Las concentraciones de NH3 y los flujos de deposición seca disminuyeron exponencialmente con la distancia de la granja lechera. Entre mayo y julio, la mediana de las tasas de sedimentación pronosticada varió de 0.28 a 0.03 μg NH3 m-2 s-1 a los 50 y 400 m de distancia, respectivamente. La deposición seca de NH3 en los 400 m más cercanos a la fuente representó el 11.5% de las emisiones diarias. Los resultados confirman la dispersión de corto alcance del NH3 emitido desde una fuente puntual encontrada en otros estudios, pero puede no ser el mismo en otras situaciones, ya que la dispersión de NH3 depende de la cobertura terrestre circundante y del número de animales en un granero.

1. Introduction

Agriculture has been the main source of NH3 emissions in Europe for a long time (Asman, 1998). Several studies have reported increasing atmospheric concentration of NH3 and ammonium, especially in the regions of concentrated animal feeding operations (Theobald et al., 2006; Walker et al., 2008; Sutton et al., 2011; Jones et al., 2013). Emissions of atmospheric NH3 from agriculture and its subsequent entry into sensitive ecosystems is an important environmental problem (Bobbink et al., 2002, 2010, 2011). NH3 deposition may cause soil acidification through nitrification processes (van Breemen et al., 1982). More importantly, NH3 plays a significant role in eutrophication of sensitive, mainly terrestrial ecosystems (Sutton et al., 2009; Theobald et al., 2009; Paoli et al., 2010). Atmospheric inputs of NH3 may cause a decrease of biodiversity in sensitive ecosystems (Stevens et al., 2004; Emmett, 2007; Jones et al., 2011). NH3 significantly affects the Earth´s climate, mainly because the volatilization potential of NH3 nearly doubles for every 5 ºC increase in temperature (Sutton et al., 2013). Measurement of NH3 emissions from naturally ventilated animal houses is technically challenging (Phillips et al., 2001; Scholtens et al., 2004; Welch et al., 2005a, b) due to the difficulties in determining the ventilation rate. Ventilation rate depends on the building design, animal occupancy, temperature, wind speed, wind direction and accuracy of the NH3 measurement (Phillips et al., 2001; Welch et al., 2005b; Zhang et al., 2005). However, methods such as the internal or external tracer-ratio techniques or the flux-sampling technique have been successfully tested under real conditions (Demmers et al., 1999; Dore et al., 2004). The conservation of mass is an important concept that underlies environmental analysis of buildings (Albright, 1990). The concept of mass conservation is applied to latent heat (humidity) and gaseous contaminants (Samer et al., 2012). Several studies have investigated moisture balance and tracer gas technique for ventilation rates measurements and NH3 emissions quantification in naturally ventilated buildings (Samer et al., 2011). Pedersen et al. (1998), Teye and Hautala (2007) and Samer et al. (2012) investigated the H2O balance for ventilation rate measurements. The H2O mass balance method largely depends on animal production of H2O. Factors that influence H2O production include flooring system, stocking, density, watering, moisture content of the forages, animal activity and relative humidity.

In the vicinity of intense agricultural activities, deposition of atmospheric NH3 may totally dominate the overall load of reactive nitrogen (N) from the atmosphere (Hertel et al., 2006), and NH3 dry deposition velocities in the areas of intensive animal production may exceed critical loads (Kuylenstierna et al., 1998).

NH3 dry deposition velocities for grassland, crops and forest are different (Smith et al., 2000; Theobald et al., 2006). Several field studies have shown that the deposition velocity of NH3 for forests is relatively high and variable (Wyers et al., 1992; Duyzer et al., 1994; Andersen et al., 1999). Due to its high deposition velocity and its reactivity in the atmosphere, gaseous NH3 has a relatively short atmospheric lifetime (few days or less; Warneck, 1999). Dry deposition fluxes of NH3 to grassland, crops and forest are different (Zapletal 1998, 2001; Phillips et al., 2004; Walker et al., 2006). The difference in fluxes is caused by the differences in emission strenght, and by differences between vegetation of low and high N status (Sutton et al., 1997; Flechard and Fowler, 1998; Milford et al., 2001).

The objective of this study was to compare the inferred emission rates in a naturally ventilated dairy farm during a three months period with measured concentrations of NH3 to obtain data for derivation of the emission-deposition relationship around a dairy farm.

2. Materials and methods

2.1 Site and building description

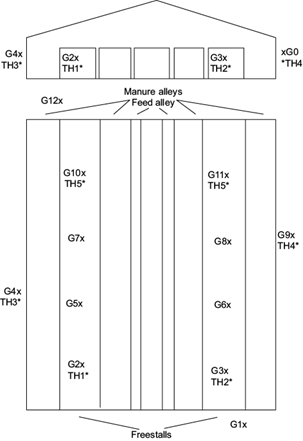
The dairy barn was located in a rural area in the east of the Czech Republic at an altitude of 300-350 masl. About 240 dairy cows in loose housing were the main source of NH3 emissions from the barn (Fig. 1), which was 88 m long and 27 m wide. The height of the sheet metal roof was 9 m at the gable peak. The internal room volume of the barn was 21 100 m3 (87.9 m3 per animal). The dairy barn was naturally ventilated by a draft introduced into the building through adjustable curtains on the long sidewalls (protected by nets), which were open in summer, and through five doors with a size of 3 × 4 m in the gable wall of the northern and southern sides. The prevailing summer winds are north and south winds. Ambient meteorological parameters were measured from May to July at a height of 2 m above ground and 100 m from the dairy barn (Fig. 2, site B). Temperature and humidity were measured by a Young 41372LC/LF sensor (Young Company,Traverse City, Michigan, USA). Wind speed and direction were measured by a Gill 2D ultrasonic anemometer (Hampshire, UK), intensity of solar radiation was measured by an RS 81 pyranometer (Envitech Bohemia, Prague, Czech Republic). Data was stored in an UJED datalogger (Baghirra, Prague, Czech Republic) at 1-min intervals. The distribution of sensors is displayed in Fig. 1.

Fig. 1 Side and plan view of the barn. G shows the gas sampling point and TH indicates the temperature-humidity sensor. 

2.2 Estimation of air exchange rates

Moisture from animal respiration, evaporation from manure, and forages can be used as a natural gas tracers. The ventilation rate throughout the building can be determined by the mass balance of H2O. The moisture balance was based on several studies (Pedersen et al., 1998; Teye and Hautala, 2007; Samer et al., 2012). The following mathematical model describes the ventilation rate:

QH2O =v Mw / (Wi  Wo) (1)

where Q H2O (m3 s-1) represents the ventilation rate subject to the H2O-balance; v (m3 kg-1 dry air) is the specific volume; W i (g H2O kg-1 dry air) is the humidity ratio inside the building, and W o (g H2O kg-1 dry air) is the humidity ratio outside the building. Humidity ratios were determined by the psychometrics software EZAir Properties v.1.3.5 (R.M. Parks, Gradyville, PA, USA). M w (g H2O s-1) represents the moisture produced by the cows housed in the building, and can be calculated as follows:

Mw = n mw (2)

mw = PH2O Mavg (3)

where n represents the number of cows housed in the building, M w (g H2O s-1) is the moisture produced by one dairy cow, M avg (kg) is the average mass of the cows, and P H2O (g H2O h-1 kg-1) is the moisture produced by a dairy cow per mass unit, which is equal to 1.8 (Lindley and Whitaker, 1996).

2.3 Estimation of NH3 emissions

NH3 concentrations, air temperature and relative humidity were measured inside and outside the barn (Fig. 1) according to Samer et al. (2012). Multiwarn II gas detectors with infrared sensors (Dräger Safety, Germany) were used to measure NH3 concentrations at eight points (G2, G3, G5, G6, G7, G8, G10 and G11) inside the barn and four points (G1, G4, G9 and G12) outside the barn at a height of 2.8 m during one week during the summer (July) (Fig. 1). The outdoor gas sampling point (G4) and temperature-humidity sensor (TH3) were placed 30 m from the eastern side of the building. The outdoor gas sampling point (G9) and temperature-humidity sensor (TH4) were placed 30 m from the western side of the building. The outdoor gas sampling points (G12) and G(1) were placed 30 m from the northern and southern sides of the building.

The emission was calculated according to the following equation (Zhang et al., 2005; Wang et al., 2006):

Eg;animal = V(Gc;in - Gc;out) ρg/Na (4)

where E g;animal is the gas emission per animal in g s-1, V is the ventilation rate in m3 s-1, ρ g is the gas density in g m-3, and N a is the total number of animals. Indoor gaseous concentrations (µg m-3) G c;in were calculated as the average of values measured by the eight inside gas sampling points. The outdoor gaseous concentrations G c;out were calculated as the average of values measured by the four outside gas sampling points.

2.4 Ambient NH3 concentrations measurements

Monthly integrated NH3 concentrations were measured using a passive diffusion-tube sampler (Gradko International) described by Sutton et al. (2001), which was composed of polyacrylate tube approximately 4 cm long, with an internal diameter of about 1 cm and ends fitted with a polyethylene cover. Replacement of the sampler was performed every four weeks. Before and after exposure, the samplers were placed in a cool and dark place. The concentration of NH3 was measured (Fig. 2) at 12 locations (A to L), positioned as follows: locations A to E, 5 to 400 m to the north; locations F to G, 50 to 150 m to the south; locations H to I, 300 to 400 m to the west, and locations J to L, 150 to 400 m to the east. Passive samplers were situated at a height of 1.4 m.

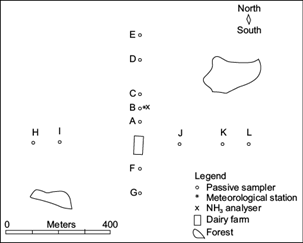
Fig. 2 Schematic view of the study area, including the barn and sampling points for gas concentrations along upwind transects. 

NH3 concentrations were continuously measured in location B, 100 m north of the dairy barn using on-line instrumentation during five days in July, when the emission rate of this gas was measured in parallel. NH3 was detected using a well known fluorimetric method (Genfa, 1989) and continuously collected in a cylindrical wet effluent diffusion denuder (Mikuška et al., 2008). The limit of detection of NH3 was 0.102 ppb (Kapoun, 2007) and the calibration curve was linear over 3 orders of magnitude (0.102-102 ppb NH3).

2.5 Modelling of dry NH3 deposition

Dry deposition fluxes were estimated from NH3 concentrations in air multiplied by the corresponding deposition velocities:

F = Vd(z)C(z) (5)

where F is the deposition flux of the NH3 to a unit area, V d (cm s-1) the deposition velocity of the NH3, and C(z) the concentration of NH3 at a height z above surface. Deposition velocity for NH3 (V d ) was calculated using the resistance analogy:

Vd= 1Ra(z) + Rb+Rc (6)

where R a (s cm-1) is the aerodynamic resistance for the turbulent layer, R b (s cm-1) is the laminar layer resistance for the quasi-laminar layer, and R c (s cm-1) is the surface or canopy resistance of the receptor. R a was calculated from micrometeorological relations as suggested by Voldner et al. (1986) and Hicks et al. (1987). R b was calculated from micrometeorological relations as suggested by Hicks et al. (1987). The surface roughness z0 = 90 cm was chosen for deciduous and coniferous forest, the surface roughness z0 = 2.7 cm was chosen for crop (Voldner et al., 1986).

Surface resistance was calculated using the following equation (Erisman and Draaijers, 1995):

Rc= 1Rsto+ Rm+ 1Rinc+ Rsoil+ 1Rext-1 (7)

R c was expressed based on the known global radiation, surface temperature, relative humidity, and land cover according to Eq. (7), using the results and assumptions obtained from literature for computing and parameterization of the canopy stomatal resistence, R sto (Wesely, 1989; Baldocchi et al., 1987); the mesophyll resistence, R m (Wesely, 1989; Erisman and Draaijers, 1995); the canopy cuticle or external leaf resistance, R ext (Baldocchi et al., 1987); the soil resistance, R soil (Meyers and Baldocchi, 1988), and incanopy resistance, R inc (van Pul and Jacobs, 1993). The stomatal resistance (R sto ) includes dependence upon global radiation and surface air temperature. Here we use the following generalized function to estimate the canopy stomatal resistance (Wesely, 1989):

Rsto = Ri {1+200G+0.112}{400[Ts(40-Ts)]1} (8)

where R i is the input resistance (s m-1), G is the global radiation (W m-2), and T s is the surface air temperature (ºC). The appropriate value of R i was chosen from Wesely (1989). The incanopy resistance (R inc ) for vegetation was modelled according to van Pul and Jacobs (1993):

Rinc=bLAIh/u* (9)

where LAI is the leaf area index (m2 m-2), h the vegetation height (m), b an empirical constant taken as 14 m-1, and u * the friction velocity (cm s-1).

3. Results and discussion

3.1 Estimation of air exchange rate and NH3 emission

Table I shows the air exchange rates in the dairy barn estimated by the H2O-balance method, ventilation rate, relative humidity and temperature inside and outside the buildings during the experiment. Furthermore, mass flow emission rates per animal unit and per cow are presented. To obtain reliable data for emission rates, continuous measurements over longer periods are recommended (Joo et al., 2014). Five days was the minimum measurement period in this experiment. The mean NH3 emissions were 43.2 g cow-1 d-1, 126% of what was obtained using estimated emission factors from the Czech national inventory (34.2 g cow-1 d-1; MZP, 2013). For examle Joo et al. (2014) reported 14 to 35 g cow-1 d-1 for a naturally ventilated freestall barns, and Bluteau et al. (2009) reported 11-19 g cow-1 d-1 for a naturally ventilated barn. The highest value was reported by Rumburg et al. (2008) also in a naturally ventilated barn (110 g cow-1 d-1). In this study, the mass flow emission rate of NH3 was of 1.4 g AU-1 h-1, a lower value than reported by Samer et al. (2012) and Fiedler and Müller (2011) (from 2 to 5 g AU-1 h-1 during summer seasons in a naturally ventilated dairy building) but with a higher number of dairy cows (364 dairy cows).

Table I Air exchange rates and average NH3 emission rates from a dairy barn during a five-day measurement period in June. 

n Mavg RHi RHo ti to V AERH2O ENH3AU
240 632 71.1 74.8 16.7 14.8 34.2 4.8 1.4

n: Number of cows housed in the building; Mavg: Average weight of the cows (kg); RHi: Relative humidity inside the building (%); RHo: Relative humidity outside the building (%); ti: Air temperature inside the building (ºC); to: Air temperature outside the building (ºC); V: Ventilation rate (m3 s-1); AERH2O: Air exchange rate subject to H2O-balance (h-1); ENH3AU: Specific mass flow emission rate of NH3 (g AU-1 h-1).

3.2 NH3 concentrations

Monthly mean NH3 concentrations (µg m-3) vs. distance from the source in different wind directions, frequencies and speed during the period May-July are depicted in Fig. 3. Monthly mean NH3 concentrations in different wind directions and wind speed at 50, 100, 150, 300 and 400 m during the period May-July for 12 sampling sites are depicted in Table II. NH3 concentrations decreased rapidly with distance from the dairy barn, with highest concentrations observed in the eastern direction 200 m away from the source, and lowest concentrations observed in the southern direction. One possible reason for the smaller NH3 concentrations at 50 and 150 m from the dairy farm in the latter direction could be attributed to the highest wind speed at our site (with a three-monthly mean of 2 m s−1 at a 2 m height). High wind speed usually causes fast dispersion and dilution of the NH3 plume, and thus low NH3 concentration (Shen et al., 2016). The highest NH3 concentration at 300 m and 400 m from dairy farm in eastern direction could be attributed to the lowest wind speed (with a three-monthly mean of 0.7 m s−1 at a 2 m height) and the lowest wind direction frequency. We recommend to locate tree belts around the source as a strategy to reduce the effects of emission hotspots on forest ecosystems located 300 m northeast and southwest from a dairy farm.

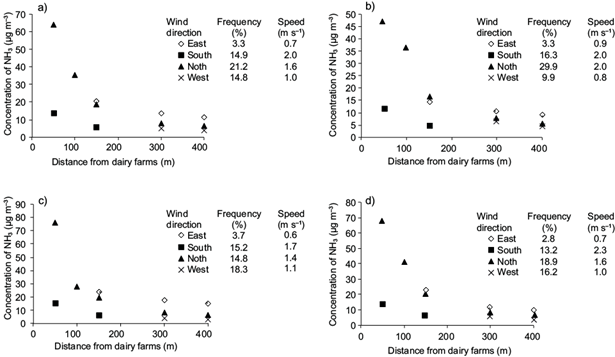
Fig. 3 Mean NH3 concentrations (µg m-3) vs. distance from the source in different wind directions, wind direction frequencies and wind speed during the period (a) May-July, (b) May, (c) June, and (d) July. 

Table II Monthly mean NH3 concentrations in different wind directions and wind speeds during the period May-July for 12 sampling sites. 

Month May Juny July
Wind direction Distance
(m)
Wind speed
(m s−1)
NH3 concentration
(µg m-3)
Wind speed
(m s−1)
NH3 concentration
(µg m-3)
Wind speed
(m s−1)
NH3 concentration
(µg m-3)
North 50 2.0 47.1 1.4 76.2 1.6 68.2
100 36.6 27.9 40.6
150 16.4 19.8 20.4
300 8.0 8.3 8.4
400 6.0 6.1 6.4
East 150 0.9 13.9 0.6 23.9 0.7 22.9
300 10.4 17.2 11.8
400 9.1 14.7 10.1
South 50 2.0 12.0 1.7 14.7 2.3 13.2
150 5.0 5.3 6.2
West 300 0.8 6.2 1.1 3.4 1.0 5.4
400 5.0 3.3 3.3

Several studies have dealt with the measurement of atmospheric NH3 profiles downwind of a known source. Our results were similar to those of Pitcairn et al. (1998), Theobald et al. (2006), Walker et al. (2008), Sutton et al. (1998, 2011) and Jones et al. (2013), who reported a rapid decrease of NH3 concentrations with increasing distance to livestock farms. Our results show the short-range dispersion of NH3 emitted from a point source. However, short-range dispersion of NH3 emitted from a point depends not only on the surrounding land-cover (Vogt et al., 2013) and the number of animals in the barn (Adrizal et al., 2008; Verhagen and van Diggelen, 2006), but also on the strategies for reducing the effect of emission hotspots on ecosystems by locating tree belts around the sources (Theobald et al., 2001; Dragosits et al., 2006).

3.3 Comparison of NH3 emissions and concentrations

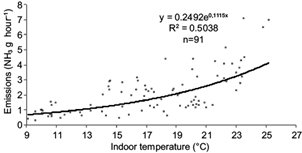
The diurnal variation of NH3 emissions and concentrations through the measurement period at location B, with a maximum in the morning and minima in the afternoon and night, are shown in Figs. 4 and 5. Higher concentrations of NH3 on June 16 and 17 were caused by different meteorological conditions during those days. The diurnal variations of NH3 emission were similar to those reported by Zhang et al. (2005) and Wang et al. (2006). Averaging the inferred hourly emission rates over all of the available data and converting them to daily emission rates lead to the average emission of 10.3 kg NH3 d−1 from dairy barn with a standard error of 0.16 kg NH3 d−1 (n = 91). Hensen et al. (2009) reported a similar emission and concentration pattern and estimated NH3 emissions between 6.4 ± 0.18 kg d−1 (Huang 3-D model) and 9.2 ± 0.7 kg d−1 (Gaussian 3-D model) from a naturally ventilated livestock farm. Figure 6 shows the average NH3 emission rate as an exponential function of the indoor temperature in the cattle building. The emission level increased approximately from 1 to 7 g NH3 h−1 as the temperature increased from 9 to 25 ºC. Exponential dependence of NH3 emissions to indoor temperature was demonstrated by Zhang et al. (2005) over a temperature range of 5-23 ºC and Hensen et al. (2009) over a temperature range of 14-23 ºC.

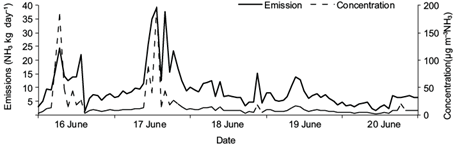
Fig. 4 Time course of NH3 emissions in the north wind direction and hourly average of NH3 concentrations measured at a location (B) located 100 m from the building. 

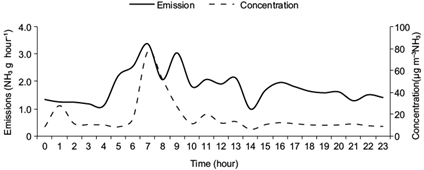
Fig. 5 Mean hourly values of NH3 emissions in the north wind direction and mean hourly values of NH3 concentrations measured at a location (B) located 100 m from the building. 

Fig. 6 Hourly averaged NH3 emissions in the north wind direction as a function of hourly mean indoor temperature. 

3.4 Total and stomatal NH3 flux

Our mean deposition velocities computed according to Eq. (6) were 0.5 cm s−1 for coniferous forests and 0.4 cm s−1 for crops. Zhang et al. (2009) reported a deposition velocity of 0.5 cm s−1 for coniferous forests from June to July and 0.3 cm s−1 for the crops during spring. Deposition velocities were estimated from big-leaf models using on-site meteorological measurements (Hicks et al., 1987). Mean deposition velocities from 0.2 to 0.4 cm s−1 for agricultural sites were reported by several authors: 0.3 cm s−1 in spring by Cui et al. (2010); 0.2 cm s−1 in summer by Cui et al. (2010) and Zhou et al. (2010); 0.3 cm s−1 by Hayashi et al. (2012); an annual mean of 0.3 cm s−1 by both Cui et al. (2011) and Delon et al. (2012), and an annual mean of 0.4 cm s−1 by Loubet et al. (2011). Mean fluxes to the forest vs. distance from the source in different wind directions, frequencies and wind speeds during the period May-July are depicted in Fig. 7. Mean fluxes to crops vs. distance from the source in different wind directions, frequencies and wind speeds during the period May-July are depicted in Fig. 8. The total flux of NH3 (F total ) to the forest canopy ranged from -0.32 to -0.03 µg NH3 m-2 s-1 at 50 and 400 m, respectively, from the source to the north, which is the dominant downwind direction (Fig. 7a). The stomatal flux of NH3 to the forest canopy ranged from -0.092 to -0.009 µg NH3 m-2 s-1 at distances of 50 and 400 m from the source to the north, which is the dominant downwind direction (Fig. 7b). The total flux of NH3 (F total ) to the crops ranged from - 0.24 to - 0.02 µg NH3 m-2 s-1 at 50 and 400 m, respectively, from the source to the north (Fig. 8a). The stomatal flux of NH3 to the crops ranged from -0.094 to -0.008 µg NH3 m-2 s-1 at 50 and 400 m, respectively, from the source to the north (Fig. 8b). Our estimated range is consistent with studies conducted in Europe and the USA, where deposition fluxes were estimated by Erisman and Wyers (1993), Duyzer et al. (1987), and Phillips et al. (2004). Erisman and Wyers (1993) observed deposition fluxes of 0.0 to 0.45 NH3 m-2 s-1 over heathland near a livestock production facility. Duyzer et al. (1987) reported NH3 fluxes in the range of -0.19 to -0.03 NH3 m-2 s-1 over dry heathland. Phillips et al. (2004) observed the summer season-averaged deposition flux of -0.11 μg NH3 m-2 s-1 over a site with grass or short vegetation near a small swine production facility.

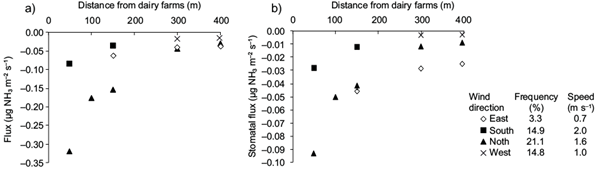
Fig. 7 (a) Total flux of NH3 and (b) stomatal flux of NH3 to the forest vs. distance from the source in different wind directions, frequencies and speeds during the period from May to July. 

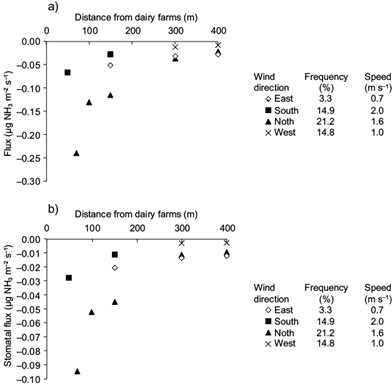
Fig. 8 Total flux of NH3 (a) and stomatal flux of NH3 (b) to crops vs. distance from the source in different wind directions, frequencies and speed during the period from May to July. 

The total flux to forest and the total flux to crops displayed similar spatial patterns, decreasing exponentially with distance from the cow-barn (Figs. 7 and 8), which is in accordance with values reported previously (Fowler et al., 1998; Sutton et al., 1998; Verhagen and van Diggelen, 2006).

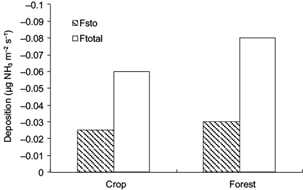
The mean F total and F sto from 0 to 400 m from the source respect to the surface type is shown in Fig. 9. F total fluxes range from 0.06 to 0.08 µg N-NH3 m-2 s-1 for crops and forest, respectively. F sto to the forest canopy and mean F sto to crops represent 37 and 41% of F total , respectively. Walker et al. (2008) estimated higher F total fluxes of 0.08 to 0.16 for crops and forest, respectively. Mean F sto to the forest canopy represented 26% of F total in the vicinity of a swine production facility (Walker et al., 2008). Differences between our results and those reported by Walker et al. (2008) are partially attributed to the differences in spatial distribution of forest and crops around the source and to the number of animals (4900 pigs). Assuming an emission factor of 43.2 g NH3 cow-1 d-1 and a mean population of 240 cows, the NH3 dry deposition over the nearest 400 m from the source accounted for approximately 11.5% (1192.3 g NH3) of daily emissions (10368 g NH3). Walker et al. (2008) found that 7.8-13.3% of emissions were deposited within 500 m of the swine facility surrounded by forest and crops. According to Fowler et al. (1998), 3-10% of emissions were deposited within 300 m of a poultry facility surrounded by forest. Asman (1998) and Sutton et al.(1998) found that 2-50% of emissions were deposited within 300 m

Fig. 9 Total mean (F total ) and stomatal (F sto ) fluxes over 0 to 400 m from the source respect to surface type. 

4. Conclusion

Inferred emissions were compared with measured concentrations of NH3 to obtain data for the derivation of emission-deposition relationship around a dairy farm. The daily pattern of a source was correlated with the temperature inside a dairy farm. The daily pattern resulted from a combination of the temperature effect on a source concentration and the effect of the building’s ventilation rate. Both NH3 concentration and NH3 total flux displayed similar spatial patterns, decreasing exponentially with distance from the dairy barn. The results show the short-range dispersion of NH3 emitted from a point source, but it may not be the same in other situations, since dispersion of NH3 is dependent on the surrounding land-cover and on the number of animals in a barn. NH3 deposition around a dairy barn is a significant nitrogen input to surrounding crops and forest.

Acknowledgments

This study was supported by the Technology Agency of the Czech Republic (projects TA01021220 and 4TA04020797).

References

Adrizal A, Patterson PH, Hulet RM, Bates RM, Myers CAB, Martin G, Shockey RL, van der Grinten M, Anderson DA, Thompson JR. 2008. Vegetative buffers for fan emissions from poultry farms: 2. Ammonia, dust and foliar nitrogen. Journal of Environmental Science and Health Part B Pesticides Food Contaminants and Agricultural Wastes 43:96-103. DOI: 10.1080/03601230701735078 [ Links ]

Albright LD. 1990. Environment control for animals and Plants. American Society of Agricultural Engineers, Michigan USA, 453 pp. [ Links ]

Andersen HV, Hovmand MF, Hummelshøj P, Jensen NO. 1999. Measurements of ammonia concentrations, fluxes and dry deposition velocities to a spruce forest 1991-1995. Atmospheric Environment 33:1367-1383. DOI: 10.1016/S1352-2310(98)00363-X. [ Links ]

Asman WAH. 1998. Factors influencing the local dry deposition of gases with special reference to ammonia. Atmospheric Environment 32:415-421. DOI: 10.1016/S1352-2310(97)00166-0 [ Links ]

Baldocchi DD, Hicks BB, Camara P. 1987. A canopy stomatal resistance model for gaseous deposition to vegetated surfaces. Atmospheric Environment 21:91-101. DOI: 10.1016/0004-6981(87)90274-5 [ Links ]

Bluteau CV, Massé DI, Leduc R. 2009. Ammonia emission rates from dairy livestock buildings in Eastern Canada. Biosystems Engineering 103:480-488. DOI: 10.1016/j.biosystemseng.2009.04.016 [ Links ]

Bobbink R, Ashmore M, Braun S, Flückiger W, Van den Wyngaert IJJ. 2002. Empirical nitrogen critical loads for natural and semi-natural ecosystems: 2002 update. Background paper for the Expert Workshop on Empirical Critical Loads for Nitrogen on (Semi-) natural Ecosystems, held under the UN/ECE CLRTAP, Berne, Switzerland, 11-13 November. Swiss Agency for the Environment, Forests and Landscape, Berne, pp. 1-123. [ Links ]

Bobbink R, Hicks K, Galloway J, Spranger T, Alkemade R, Ashmore M, Bustamante M, Cinderby S, Davidson E, Dentener F, Emmett B, Erisman JW, Fenn M, Gilliam F, Nordin A, Pardo L, de Vries W. 2010. Global assessment of nitrogen deposition effects on terrestrial plant diversity: A synthesis. Ecological Applications 20:30-59. DOI: 10.1890/08-1140.1 [ Links ]

Bobbink R, Braun S, Nordin A, Power S, Schütz K, Strengbom J, Weijters M, Tomassen M. 2011. Review and revision of empirical critical loads and dose-response relationships. Coordination Centre for Effects, National Institute for Public Health and the Environment (RIVM), The Netherlands. [ Links ]

Cui J, Zhou J, Yang H. 2010. Atmospheric inorganic nitrogen in dry deposition to a typical red soil agro-ecosystem in southeastern China. Journal of Environmental Monitoring 12:1287-1294. DOI: 10.1039/b922042a [ Links ]

Cui J, Zhou J, Yang H, Peng Y, He Y, Chan A. 2011. Atmospheric NO2 and NH3 deposition into a typical agro-ecosystem in Southeast China. Journal of Environmental Monitoring 13:3216-3221. DOI: 10.1039/c1em10284b [ Links ]

Delon C, Galy-Lacaux C, Adon M, Liousse C, Serca D, Diop B, Akpo A. 2012. Nitrogen compounds emission and deposition in West African ecosystems: Comparison between wet and dry savanna. Biogeosciences 9:385-402. DOI: 10.5194/bg-9-385-2012 [ Links ]

Demmers TGM, Burgess LR, Short JL, Phillips VR, Clark JA, Wathes CM. 1999. Ammonia emissions from two mechanically ventilated UK livestock buildings. Atmospheric Environment 33:107-1169. DOI: 10.1016/S1352-2310(98)00150-2 [ Links ]

Dore CJ, Jones BMR, Scholtens R, Huisin T, Veld JWH, Burgess LR, Phillips VR. 2004. Measuring ammonia emission rates from livestock buildings and manure stores - Part 2: Comparative demonstrations of three methods on the farm. Atmospheric Environment 38:3017-3024. DOI: 10.1016/j.atmosenv.2004.02.031 [ Links ]

Dragosits U, Theobald MR, Place CJ, ApSimon HM, Sutton MA. 2006. The potential for spatial planning at the landscape level to mitigate the effects of atmospheric ammonia deposition. Environmental Science and Policy 9:626-638. DOI: 10.1016/j.envsci.2006.07.002 [ Links ]

Duyzer J, Bouman AMH, Diederen HSMA, van Aalst RM. 1987. Measurement ofdry deposition velocities of NH3 and NH4 + over natural terrains. Report R 87/273. MTTNO, Delft, The Netherlands. [ Links ]

Duyzer J, Verhagen HLM, Weststrate JH, Bosveld FC, Vermetten AWM. 1994. The dry deposition of ammonia onto a Douglas-fir forest in the Netherlands. Atmospheric Environment 28:1241-1253. DOI: 10.1016/1352-2310(94)90271-2 [ Links ]

Emmett BA. 2007. Nitrogen saturation of terrestrial ecosystems: Some recent findings and their implications for our conceptual framework. Water Air Soil Pollution 7:99-109. DOI: 10.1007/s11267-006-9103-9 [ Links ]

Erisman JW, Wyers GP. 1993. Continuous measurements of surface exchange of SO2 and NH3: Implications for their possible interaction in the deposition process. Atmospheric Environment 27A:1937-1949. DOI: 10.1016/0960-1686(93)90266-2 [ Links ]

Erisman JW, Draaijers GPJ. 1995. Atmospheric deposition in relation to acidification and eutrophication. Studies in Environmental Science 63. Elsevier Science, Amsterdam, 405 pp. [ Links ]

Fiedler M, Müller HJ. 2011. Emissions of ammonia and methane from a livestock building natural cross ventilation. Meteorologische Zeitschrift 20:59-65. DOI: 10.1127/0941-2948/2011/0490 [ Links ]

Flechard CR, Fowler D. 1998. Atmospheric ammonia at a moorland site. II: Longterm surface-atmospheric micrometeorological flux measurements. Quarterly Journal of the Royal MeteorologicalA Society 124:759-791. DOI: 10.1002/qj.49A712454706 [ Links ]

Fowler D, Pitcairn CER, Sutton MA, Flechard C, Loubet B, Coyle M, Munro RC, 1998. The mass budget of atmospheric ammonia in woodland within 1 km of livestock buildings. Environmental Pollution 102:342-348. DOI: 10.1016/S0269-7491(98)80053-5 [ Links ]

Genfa Z, Dasgupta PK, Dong S. 1989. Measurement of atmospheric ammonia. Environmental Science Technology 23:1467-1475. DOI: 10.1021/es00070a003 [ Links ]

Hayashi K, Ono K, Tokida T, Takimoto T, Masaoshi M, Miyata A, Kazuhide M. 2012. Atmosphere-rice paddy exchanges of inorganic particles and relevant gases during a week in winter and a week in summer. Journal of Agricultural Meteorology 68:55-68. DOI: 10.2480/agrmet.68.1.8. [ Links ]

Hensen A, Loubet B, Mosquera1 J, van den Bulk1 WCM, Erisman JW, Dämmgen U, Milford C, Löpmeier FJ, Cellier P, Mikuška P, Sutton MA. 2009. Estimation of NH3 emissions from a naturally ventilated livestock farm using local-scale atmospheric dispersion modelling. Biogeosciences 6:2847-2860. DOI: 10.5194/bg-6-2847-2009 [ Links ]

Hertel O, Skjøth CA, Løfstrøm P, Geels C, Frohn LM, Ellermann T, Madsen PV. 2006. Modelling nitrogen deposition on a local scale - A review of the current state of the art. Environmental Chemistry 3:317-337. DOI: 10.1071/EN06038 [ Links ]

Hicks BB, Baldocchi DD, Meyers TP, Hosker JrRP, Matt DR. 1987. A preliminary multiple resistance routine for deriving dry deposition velocities from measured quantities. Water, Air, and Soil Pollution 36:311-330. DOI: 10.1007/BF00229675 [ Links ]

Joo HS, Ndegwa PM, Heber AJ, Bogan BW, Ni JQ, Cortus EL, Ramirez-Dorronsoro JC. 2014. A direct method of measuring gaseous emissions from naturally ventilated dairy barns. Atmospheric Environment 86:176-186. DOI: 10.1016/j.atmosenv.2013.12.030 [ Links ]

Jones MLM, Norris D, Hall J, Petit S. 2011. Developing an indicator-modelling approach to forecast changes in nitrogen critical load exceedance across Europe arising from agricultural reform. Ecological Indicators 11:16-26. DOI: 10.1016/j.ecolind.2009.06.005 [ Links ]

Jones L, Nizam MS, Reynolds B, Bareham S, Oxley ERB. 2013. Upwind impacts of ammonia from an intensive poultry unit. Environmental Pollution 180:221-228. DOI: 10.1016/j.envpol.2013.05.012 [ Links ]

Kapoun M. 2007. Studium distribuce anorganických složek mezi plynnou fází a aerosolovými částicemi. Thesis. Chemical Faculty, University of Technology, Brno, Czech Republic (in Czech). [ Links ]

Kuylenstierna JCI, Hicks WK, Cinderby S, Cambridge H. 1998. Critical loads for nitrogen deposition and their exceedance at the European scale. Environmental Pollution 102:591-598. DOI: 10.1016/S0269-7491(98)80087-0 [ Links ]

Lindley JA, Whitaker JH. 1996. Agricultural buildings and structures. American Society of Agricultural Engineers. Michigan, USA, 657 pp. [ Links ]

Loubet B, Laville P, Lehuge S, Larmanou E, Mascher N, Genermont S, Roche R, Ferrara RM, Stella P, Personne E, Durand B, Decuq C, Flura D, Masson S, Fanucci O, Rampon J N, Gabrielle B, Schrumpf M, Cellier P. 2011. Carbon, nitrogen and greenhouse gases budgets over a four years crop rotation in northern France. Plant and Soil 343:109-137. DOI: 10.1007/s11104-011-0751-9 [ Links ]

Meyers TP, Baldocchi DD.1988. A comparison of models for deriving dry deposition fluxes of O3 and SO2 to a forest canopy. Tellus 40B:270-284. DOI: 10.3402/tellusb.v40i4.15916 [ Links ]

Mikuška P, Motyka K, Večeřa Z. 2008. Determination of nitrous acid in air using wet effluent diffusion denuder - FIA technique. Talanta 77:635-641. DOI: 10.1016/j.talanta.2008.07.008 [ Links ]

Milford C, Hargreaves KJ, Sutton MA, Loubet B, Cellier P. 2001. Fluxes of NH3 and CO2 over upland moorland in the vicinity of agricultural land. Journal of Geophysical Research 106 (D20):24169-24181. DOI: 10.1029/2001JD900082 [ Links ]

MZP, 2013. Metodický pokyn odboru ochrany ovzduší: k zařazování chovů hospodářských zvířat podle zákona č. 201/2012 Sb., o ochraně ovzduší, k výpočtu emisí znečišťujících látek z těchto stacionárních zdrojů a k seznamu technologií snižujících emise z těchto stacionárních zdrojů“. Praha (in Czech). Available at: http://www.cschms.cz/Links ]

Paoli L, Pirintsos SA, Kotzabasis K, Pisani T, Navakoudis E, Loppi S. 2010. Effects of ammonia from livestock farming on lichen photosynthesis. Environmental Pollution 158:2258-2265. DOI: 10.1016/j.envpol.2010.02.008 [ Links ]

Pedersen SH, Takai H, Johnsen JO, Metz JHM, Groot Koerkamp PWG, Uenk GH, Phillips VR, Holden MR, Sneath RW, Short JL, White RP, Hartung J, Seedorf J, Schröder M, Linkert KH, Wathes CM. 1998. A comparison of three balance methods for calculating ventilation rates in livestock buildings. Journal of Agricultural Engineering Research 70:25-37. DOI: 10.1006/jaer.1997.0276 [ Links ]

Phillips VR, Lee DS, Scholtens R, Garland JA, Sneath RW. 2001. A review of methods for measuring emission rates of ammonia from livestock buildings and slurry or manure stores. Part 2: Monitoring flux rates, concentrations and airflow rates. Journal of Agricultural Engineering Research 78:1-14. DOI: 10.1006/jaer.2000.0618 [ Links ]

Phillips SB, Arya SP, Aneja VP. 2004. Ammonia flux and dry deposition velocity from near-surface concentration gradient measurements over a grass surface in North Carolina. Atmospheric Environment 38:3469-3480. DOI: 10.1016/j.atmosenv.2004.02.054 [ Links ]

Pitcairn CER, Leith ID, Sheppard LJ, Sutton MA, Fowler D, Munro RC, Tang S, Wilson D. 1998. Therelationship between nitrogen deposition, species composition and foliar nitrogen concentrations in woodland flora in the vicinity of livestock farms. Environmental Pollution 102:41-48. DOI: 10.1016/S0269-7491(98)80013-4 [ Links ]

Rumburg B, Mount GH, Filipy J, Lamb B, Westberg H, Yong D, Kincaid R, Johnson K. 2008. Measurement and modeling of atmospheric flux of ammonia from dairy milking cow housing. Atmospheric Environment 42:3364-3379. DOI: 10.1016/j.atmosenv.2007.05.042 [ Links ]

Samer M, Loebsin C, Fiedler M, Ammon C, Berg W, Sanftleben P, Brunsch R. 2011. Heat balance and tracer gas technique for air flow rates measurement and gaseous emissions quantification in naturally ventilated livestock buildings. Energy and Buildings 43:3718-3728. DOI: 10.1016/j.enbuild.2011.10.008 [ Links ]

Samer M, Ammon C, Loebsin C, Fiedler M, Berd W, Sanftleben P, Brunsch R. 2012. Moisture balance and tracer gas technique for ventilation rates measurement and greenhouse gases and ammonia emissions quantification in naturally ventilated buildings. Building and Environment 50:10-20. DOI: 10.1016/j.buildenv.2011.10.008 [ Links ]

Shen J, Chen D, Bai M, Sun J, Coates T, Lam SK, Yong Li Y. 2016. Ammonia deposition in the neighbourhood of an intensive cattle feedlot in Victoria. Scientific Reports 6:32793. DOI: 10.1038/srep32793. [ Links ]

Scholtens R, Dore CJ, Jones BMR, Lee DS, Phillips VR. 2004. Measuring ammonia emission rates from livestock buildings and manure stores - Part 1: Development and validation of external tracer ratio, internal tracer ratio and passive flux sampling methods. Atmospheric Environment 38:3003-3015. DOI: 10.1016/j.atmosenv.2004.02.030 [ Links ]

Smith RI, Fowler D, Sutton MA, Flechard C, Coyle M. 2000. Regional estimation of pollutant gas dry deposition in the UK: Model description, sensitivity analyses and outputs. Atmospheric Environment 34:3757-3777. DOI: 10.1016/S1352-2310(99)00517-8 [ Links ]

Stevens CJ, Dise NB, Mountford JO, Gowing DJ, 2004. Impact of nitrogen deposition on the species richness of grasslands. Science 303:1876-1879. DOI: 10.1126/science.1094678 [ Links ]

Sutton MA, Milford C, Dragosits U, Singles R, Fowler D, Ross C, Hill R, Jarvis SC, Pain B P, Harrison R, Moss D, Webb J, Espenhahn SE, Halliwell C, Lee DS, Wyers GP, Hill J, Apsimon HM. 1997. Gradients of atmospheric ammonia concentrations and deposition downwind of ammonia emissions: first results of ADEPT Burrington Moore experiment. In: Gaseous exchange with grassland systems (Jarvis SC, Payne BP, Eds.). CAB International, Wallingford, Oxon, UK, pp. 131-139. [ Links ]

Sutton MA, Milford C, Dragosits U, Place CJ, Singles RJ, Smith RI, Pitcairn CER, Fowler D, Hill H, ApSimon HM, Ross C, Hill R, Jarvis SC, Pain BF, Phillips VC, Harrison R, Moss D, Webb J, Espenhahn SE, Lee DS, Hornung M, Ullyett J, Bul KR, Emmett BA, Lowe J, Wyers GP. 1998. Dispersion, deposition and impacts of atmospheric ammonia: Quantifying local budgets and spatial variability. Environmental Pollution 102:349-361. DOI: 10.1016/S0269-7491(98)80054-7 [ Links ]

Sutton MA, Miners B, Tang YS, Milford C, Wyers GP, Duyze JH, Fowler D. 2001. Comparison of low-cost measurement techniques for long-term monitoring of atmospheric ammonia. Journal of Environmental Monitoring 3:446-453. DOI: 10.1039/b102303a [ Links ]

Sutton MA, Nemitz E, Theobald MR, Milford C, Dorsey JR, Gallagher MW, Hensen A, Jongejan PAC, Erisman JW, Mattsson M, Schjoerring JK, Cellier P, Loubet B, Roche R, Neftel A, Hermann B, Jones SK, Lehman BE, Horvath L, Weidinger T, Rajkai K, Burkhardt J, Löpmeier FJ, Daemmgen U. 2009. Dynamics of ammonia exchange with cut grassland: Strategy and implementation of the GRAMINAE Integrated Experiment. Biogeosciences 6:309-331. DOI: 10.5194/bg-6-309-2009 [ Links ]

Sutton MA, Leith ID, Bealey WJ, van Dijk N, Tang YS. 2011. Moninea Bog - Case study of atmospheric ammonia impacts on a special area of conservation. In: Nitrogen Deposition and Natura 2000: Science and practice in determining environmental impacts (Hicks WK, Whitfield CP, Bealey WJ, Sutton MA, Eds.). 2011. COST729/ Nine/ESF/CCW/JNCC/SEI Workshop Proceedings. Available at: http://cost729.ceh.ac.uk/n2kworkshopLinks ]

Sutton MA, Reis S, Riddick SN, Dragosits U, Nemitz E, Theobald MR, Tang YS, Braban C F, Vieno M, Dore AJ, Mitchell RF, Wanless S, Daunt F, Fowler D, Blackall TD, Milford C, Flechard CR, Loubet B, Massad R, Cellier P, Personne E, Coheur PF, Clarisse L, Van Damme M, Ngadi Y, Clerbaux C, Skjøth CA, Geels C, Hertel O, Wichink Kruit RJ, Pinder RW, Bash JO, Walker JT, Simpson D, Horváth L, Misselbrook TH, Bleeker A, Dentener F, de Vries W. 2013. Towards a climate-dependent paradigm of ammonia emission and deposition. Philosophical Transactions of The Royal Society B 368:1471-2970. DOI: 10.1098/rstb.2013.0166 [ Links ]

Teye FK, Hautala M. 2007. Measuring ventilation rates in dairy buildings. International Journal of Ventilation 6:247-256. DOI: 10.1080/14733315.2007.11683781 [ Links ]

Theobald MR, Milford C, Hargreaves KJ, Sheppard L, Nemitz E, Tang YS, Phillips VR, Sneath R, McCartney L, Harvey FJ, Leith ID, Cape JN, Fowler D, Sutton MA. 2001. Potential for ammonia recapture by farm woodlands: Design and application of a new experimental facility. The Scientific World 1:791-801. DOI: 10.1100/tsw.2001.338 [ Links ]

Theobald MR, Bealey WJ, Sutton MA. 2006. Refining the simple calculation of ammonia impact limits (SCAIL) model for application in Scotland. Report AS 06/09. Centre for Ecology and Hydrology, Edinburgh. [ Links ]

Theobald MR, Bealey WJ, Tang YS, Vallejo A, Sutton MA. 2009. A simple model for screening the local impacts of atmospheric ammonia. Science of the Total Environment 407:6024-6033. DOI: 10.1016/j.scitotenv.2009.08.025 [ Links ]

Van Breemen N, Burrough PA, Velthorst EJ, van Dobben HF, de Wit T, Ridder TB, Reijnders HFR. 1982. Soil acidification from ammonium sulphate in forest canopy throughfall. Nature 288:548-550. DOI: 10.1038/299548a0 [ Links ]

Van Pul WAJ, Jacobs AFG. 1993. The conductance of a maize crop and the underlying soil to ozone under various environmental conditions. Boundary-layer Meteorology 69:83-99. DOI: 10.1007/BF00713296 [ Links ]

Verhagen R, van Diggelen R. 2006. Spatial variation in atmospheric nitrogen deposition on low canopy vegetation. Environmental Pollution 144:826-832. DOI: 10.1016/j.envpol.2006.02.015 [ Links ]

Vogt E, Dragosits U, Braban ChF, Theobald MR, Dore AJ, van Dijk N, Tang YS, McDonald Ch, Murray S, Rees RM, Sutton MA. 2013. Heterogeneity of atmospheric ammonia at the landscape scale and consequences for environmental impact assessment. Environmental Pollution 179:120-131. DOI: 10.1016/j.envpol.2013.04.014 [ Links ]

Voldner EC, Barrie LA, Sirois A.1986. A literature review of dry deposition of oxides of sulphur and nitrogen with emphasis on long-range transport modelling in North America. Atmospheric Environment 20:2101-2123. DOI: 10.1016/0004-6981(86)90305-7 [ Links ]

Wang C, Baoming Li B, Zhang G, Rom HB, Strøm JS. 2006. Model estimation and measurement of ammonia emission from naturally ventilated dairy cattle buildings with slatted floor designs. Journal of the Air and Waste Management Association 56:1252-1259. DOI: 10.1080/10473289.2006.10465678 [ Links ]

Walker JT, Robarge WP, Wu Y, Meyers T. 2006. Measurement of bi-directional ammonia fluxes over soybean using the modified Bowen-ratio technique. Agricultural and Forest Meteorology 138:54-68. DOI: 10.1016/j.agrformet.2006.03.011 [ Links ]

Walker J, Spence P, Kimbrougha S, Robargeb W. 2008. Inferential model estimates of ammonia dry deposition in the vicinity of a swine production facility. Atmospheric Environment 42:3407-3418. DOI: 10.1016/j.atmosenv.2007.06.004 [ Links ]

Warneck P. 1999. Chemistry of the natural atmosphere. International Geophysical Series 71, Academic Press, San Diego. [ Links ]

Welch DC, Colls JJ, Demmers TGM, Wathes CMA. 2005a. Methodology for the measurement of distributed agricultural sources of ammonia outdoors - Part 1: Validation in a controlled environment. Atmospheric Environment 39:663-672. DOI: 10.1016/j.atmosenv.2004.10.023 [ Links ]

Welch DC, Colls JJ, Demmers TGM, Wathes CM. 2005b. A methodology for the measurement of distributed agricultural sources of ammonia outdoors - Part 2: Field validation and farm measurements. Atmospheric Environment 39:673-684. DOI: 10.1016/j.atmosenv.2004.10.024 [ Links ]

Wesely ML. 1989. Parametrization of surface resistances to gaseous dry deposition in regional-scale numerical models. Atmospheric Environment 23:1293-1304. DOI: 10.1016/0004-6981(89)90153-4 [ Links ]

Wyers GP, Vermeulen A, Slanina J. 1992. Measurement of dry deposition of ammonia on a forest. Environmental Pollution 75:25-28. DOI: 10.1016/0269-7491(92)90052-C [ Links ]

Zapletal M. 1998. Atmospheric deposition of nitrogen compounds in the Czech Republic. Environmental Pollution 102:305-311. DOI: 10.1016/S0269-7491(98)80048-1 [ Links ]

Zapletal M. 2001. Atmospheric deposition of nitrogen and sulphur compounds in the Czech Republic. The Scientific World 1:294-303. DOI: 10.1100/tsw.2001.88 [ Links ]

Zhang G, Strøm JS, Li B, Rom HB, Morsing S, Dahl P, Wang C. 2005. Emission of ammonia and other contaminant gases from naturally ventilated dairy cattle buildings. Biosystems Engineering 92:355-364. DOI: 10.1016/j.biosystemseng.2005.08.002 [ Links ]

Zhang L, Vet R, O’Brien JM, Mihele C, Liang Z, Wiebe A. 2009. Dry deposition of individual nitrogen species at eight Canadian rural sites. Journal of Geophysical Research 114:D02301. DOI: 10.1029/2008JD010640 [ Links ]

Zhou J, Cui J, Fan JL, Liang JN, Wang TJ. 2010. Dry deposition velocity of atmospheric nitrogen in a typical red soil agro-ecosystem in Southeastern China. Environmrntal Monitoring Assessment 167:105-113. DOI: 10.1007/s10661-009-1034-2 [ Links ]

Received: May 28, 2018; Accepted: September 18, 2019

* Corresponding author, email: milos.zapletal@fpf.slu.cz

Creative Commons License This is an open-access article distributed under the terms of the Creative Commons Attribution License