


 nueva página del texto (beta)
 Inglés (pdf)
 Artículo en XML
 Referencias del artículo
 Enviar artículo por email
 Citado por SciELO
  Similares en
SciELO
Similares en
SciELO 
 Permalink
1. Introduction
PM2.5 is a complex mixture composed of multicomponent particles that can go directly into the alveoli of the lungs and can carry harmful substances, such as bacteria, viruses, polycyclic aromatic hydrocarbons (PAHs) and heavy metals into the human respiratory system, resulting in respiratory diseases such as asthma and cardiovascular diseases (Ma et al., 2017; Zhou et al., 2018). If the concentration of PM2.5 increases by 10 μg m-3, the daily mortality rate will increase by 3.4% according to a report by the World Health Organization (WHO) (Laden et al., 2000). Due to rapid economic development in China, there has been severe air pollution, with the annual average concentration of PM2.5 reaching 62.2 ± 21.5 μg m-3. The heavily polluted areas are mainly the north China Plain, the middle and lower reaches of the Yangtze River, the Sichuan Basin and the Guanzhong Plain (Wang et al., 2015a; Timmermans et al., 2017). Hangzhou, which is located in the economic area of the Yangtze River delta, is one of the most significant Chinese economic centers. However, the Yangtze River delta is one of the most contaminated regions by PM2.5 in China and the world (Li et al., 2015a). Serious air contamination will greatly affect the sustainable development of urban ecosystems and improvements in the quality of the human living environment.
Vegetation can effectively repair urban ecological functions, regulate urban microclimate and reduce urban heat island effects; it also has the strong ability to retain atmospheric particles (Sun et al., 2004; Nguyen et al., 2015). Vegetation in cities can inhibit the diffusion of atmospheric particulate matter by reducing wind speed and by dry deposition, thereby decreasing atmospheric pollutants near pollution sources. Dry deposition allows atmospheric particulate pollutants to be transported to and adsorbed by plants. The ability of different plants to regulate the ecosystem varies with their vegetative form, spatial structure, canopy structure, types of airborne pollutants, and local meteorology (Jim and Chen, 2008; Liu et al., 2015). Tiwary et al. (2009) found that an estimated 90.4 t of PM10 can be adsorbed annually in an area of 10 × 10 km, with 25% of it covered with vegetation; approximately 88 t of air pollutants were removed by plants in Strasbourg, France, from 2012 to 2013 (Selmi et al., 2016); in 2010, 16 500 t of air pollutants were cleared away in 86 cities in Canada (Nowak et al., 2018). The annually removed SO2 and NO2 and the total amount of suspended PM in Guangzhou, China, reached approximately 312.03 t (Jim and Chen, 2008). The man made Three Northern Regions Shelter Forest in north China effectively retained 28.5 million t of PM2.5 from 1999 to 2000 (Zhang et al., 2017). All the above studies indicate the important role of vegetation in improving the ecological environment.
By the end of 2018, there were 140 000 km of expressways in China, and road traffic was one of the major sources of urban pollution. Affected by automotive exhaust emissions, the concentration of PM within 150 m of the road can increase by five times (Kleeman et al., 2000). For instance, the concentrations of SO2, CO and PM over Marylebone Road in France and the stations around Paris are notably high due to large traffic flow. Exhaust from vehicles, such as trucks and taxis, contains large amounts of CO, NO2, black carbon, chlorobenzenes and heavy metals, which are carcinogenic and can cause severe damage to human health and the atmosphere (Dimitriou and Kassomenos, 2014; Maina et al., 2018). Traffic emissions over the expressway are a major source of atmospheric pollutants, and the roadside greenbelt can limit exhaust pollution. At present, studies on the function of roadside greenbelts focus on urban roads, while there are fewer studies on expressway greenbelts (Shi et al., 2017). With the greenbelt in the idle zone near the Lin’an toll station of the Hang Rui expressway in Hangzhou as our research object, this paper analyzes the ability of the greenbelt to retain and remove PM2.5 in air and the correlations between PM2.5 concentrations and several factors such as meteorological, plant community structure and traffic flow (emission source) factors, with the goal of providing a scientific basis for the design and construction of a greenbelt in idle zones near the toll station on the expressway.
2. Samples and methodology
2.1 Sampling area
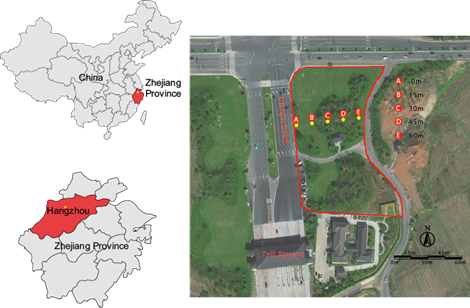
In this study, we chose the greenbelt (30º 22′ 82″ N, 119º 75′ 79″ E) in the idle zone near the Lin’an toll station of the Hang Rui expressway as the sampling area. The closest linear distance from the boundary of the sampling area to the toll station is 50 m, and the sampling area is adjacent to Qianjin road in the west. The other three sides are surrounded by farmlands or forests without any water bodies. The total sampling area is approximately 15 000 m2, and it is composed of sparse forested grasslands (0-15 m) and multistoried mixed forests (15-60 m), the latter of which are typically used for roadside greenbelts in east China. These greenbelts consist of a three-storied plant community structure of trees, bushes, and grasses (Fig. 1). There are various kinds of plants in the sampling area (24 in total), including 19 families and 21 genera. The areal ratio of trees, bushes and grasses is 1:3:4. The species ratio of evergreen trees and deciduous trees is 4:9. The species ratio of evergreen (half-evergreen) bushes and deciduous bushes is 9:1.
2.2 Data collection
2.2.1 Monitoring of PM2.5 concentrations and calculation of the horizontal reduction rate
Five points, A, B, C, D and E, were marked vertically at distances of 0, 15, 30, 45 and 60 m in the sampling area and across Qianjin road, respectively, and a PM2.5 concentration monitor (Beijing Greenwood Innovative Digital Technology, Beijing, China) was set up at a height of 1.5 m (i.e., the breathing height for humans) at the five points The sampling frequency was 1 min-1, and the detection sensitivity (K) was set to 0.001. The monitoring times were March, April, May, November, and December in 2017, and February in 2018, when there was no extreme weather, such as strong winds, rain or snow. The samples were taken for three days in each month, with continuous monitoring for 8.5 h (8:00-16:30 LT). A total of 510 data points were obtained every day, and their arithmetic mean value was taken as the concentration of PM2.5. The equipment was calibrated each time before monitoring.
The reduction in PM2.5 concentrations associated with greenbelts with different widths was calculated based on the dispersion-related method (DRM) (Morakinyo and Lam, 2016):
where PRE is the reduction efficiency (reduction rate) of the selected position; C d is the concentration of PM2.5 at 0 m, and C u(u=1,2,3,4) refers to the concentrations of PM2.5 at 15, 30, 45 and 60 m, respectively. τ = C d /C u is the penetration of particles of that size through media (i.e., a vegetation barrier).
2.2.2 Meteorological data collection
Five digital anemometers (Shenzhen Huayi Instrument, Shenzhen, China) were installed 0.5 m away from the PM2.5 concentration monitors at a height of 1.5 m, and they were connected to a laptop (Asustek Computer, Shanghai, China) to record temperature, relative humidity, wind speed and wind direction data at a frequency of 1 s-1. The arithmetic mean was taken as the value of the corresponding meteorological factor, and the monitoring time was consistent with the PM2.5 concentration time.
Located in the subtropical monsoon region in the Northern Hemisphere, Hangzhou is characterized by four distinct seasons and abundant rainfall, with an annual average temperature of 17.8 ºC, an average relative humidity reaching 70.3%, an annual rainfall amount of 1454 mm, and annual sunshine as high as 1765 h. Spring is warm, with high relative humidity, breezy weather, and frequent light rain that lasts for a long time, while winter is featured with low temperatures and less rainfall. Table I shows the monthly meteorological data in the region of the sampling point during the research period.
Table I Monthly meteorological data in Lin’an district, Hangzhou.
| Month | Meteorological factors | |||
| Temperature (ºC) | Relative humidity (%) | Wind speed (m s-1) | Total rainfall (mm) | |
| March, 2017 | 7.6-15.2 | 45-85 | 2.2 | 178.4 |
| April, 2017 | 14.2-25.6 | 50-80 | 2.5 | 126.8 |
| May, 2017 | 16.2-27.8 | 48-82 | 2.3 | 116.6 |
| November, 2017 | 7.5-15.9 | 50-89 | 3.8 | 99.4 |
| December, 2017 | 3.6-9.6 | 45-83 | 3.2 | 44.9 |
| February, 2018 | 4.2-10.8 | 30-80 | 1.9 | 22.3 |
Source: The weather bureau in Lin’an district, Hangzhou.
2.2.3 Calculation of the indexes of plant community structure characteristics
The canopy density and the degree of porosity were chosen among the community characteristic indexes of greenbelts. The canopy density is a key index for stand structure and density, which can reflect the extent to which tree crowns cover the ground. In this research, the calculation of canopy density included calculating the shaded area of tree crowns. First, the trees were located. Then, the horizontal distance from the edge of the crowns to the trunks were measured from several directions, and the projections of the crowns were drawn on drawing sheets at a ratio of 1:200. Finally, the ratio of the total areas of the crown projections and the forest area was calculated. The degree of porosity refers to the area percentage with non-opaque holes in the vertical section of the forest belt compared with the total area. This degree is measured through digital image processing. In this research, because the width of greenbelts is relatively narrow, there are many estimation errors, especially due to the difficulty in distinguishing the leaf and leafless periods for deciduous plants. Therefore, this paper referred to other scholars’ methods of calculation (Keane et al., 2005; Ducey, 2009) for reducing errors.
2.2.4 Vehicle statistics
During the monitoring, the number of passing vehicles on Qianjin road in both directions was recorded at a frequency of three times per hour and one minute for each pass. The record included the numbers of large (trucks and passenger cars) and small vehicles and the number and passing times of sprayer trucks.
3. Results and analysis
3.1 Changing patterns in the concentrations of PM2.5 in the greenbelts
3.1.1 Changes in PM2.5 concentration at different monitoring points
The concentrations of PM2.5 at different monitoring points in spring (March, April and May) basically showed the same variation trend: high in the morning and low in the afternoon (Fig. 2). When the experiment started, the concentration of PM2.5 reached its peak, while it decreased dramatically during 8:30-10:30 LT and then declined slowly, reaching its minimum value during 14:30-15:30 LT. After that, the concentration increased again, which was due to low temperatures, high relative humidity and dust that could not be cleared away in the greenbelts at night, causing the concentration to reach its maximum. With the rising temperature during the day and the decline in relative humidity, the air began to flow faster, and the concentration therefore decreased. After 15:30 LT, the rush hour increased the number of cars and PM2.5 concentration. During March, April and May, the average PM2.5 concentrations in the greenbelts were 32.56 ± 22.51, 77.71 ± 32.11 and 64.15 ± 29.00 μg m-3, respectively. The ranking of concentrations at different monitoring points in the same period was 0 > 15 > 60 > 30 > 45 m. The concentrations from 0-45 m showed a linear decrease. However, if the distance of the greenbelt was over 45 m, the concentration would increase; the reasons why are explained here. The position at 0 m was adjacent to the road without roadblocks and was thus most affected by automobile exhaust and dust, resulting in the highest PM2.5 concentration. The position at 15 m was an open lawn, which could, to some extent, retain PM2.5, though not much. The plant density from 30-60 m was higher, and the multistoried mixed forests could effectively adsorb PM2.5. The yellow line in Figure 2 represents the PM2.5 data from the national environmental monitoring point of that day in downtown Hangzhou. The average PM2.5 concentration at the sampling point was higher than that of the downtown point, and this point was more heavily polluted than the downtown, although the overall air quality still reached the National Ambient Air Quality Standard GB 3095-2012 (China EPM, 2012).
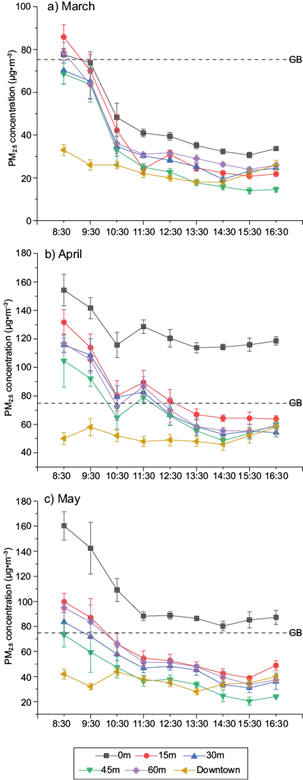
Fig. 2 Daily variation in PM2.5 concentrations in the greenbelts during spring (March, April and May).
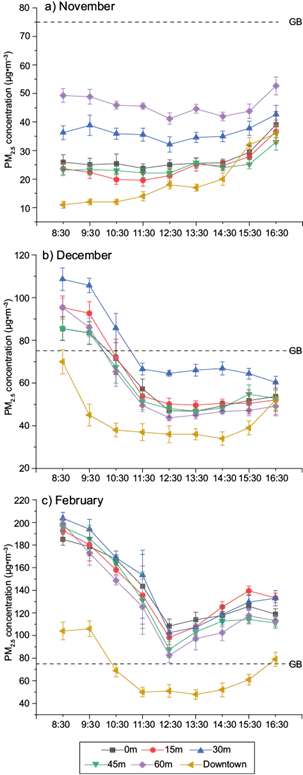
Figure 3 represents the changes in PM2.5 concentrations in the greenbelts during winter (November and December 2017, and February 2018), which shows an apparent pattern of two peaks and one valley and is different from the variation trend in spring. PM2.5 concentrations were at a maximum when the experiment began and then declined to the minimum around 12:30-13:30 LT. After 14:30 LT, concentrations rose again and then reached a peak during the day due to rush hour. The average concentrations during November, December and February were 33.56 ± 9.34, 60.78 ± 17.67 and 124.71 ± 43.19 μg m-3, respectively. However, the ranking of concentrations at different monitoring points in the same period revealed some differences. The ranking in November was 60 > 30 > 0 > 45 > 15 m, while in December and February it was 30 > 0 > 15 > 60 > 45 m. The reasons can be illustrated as follows. In November, the leaves of deciduous plants in the greenbelts began to fall, which made it easier for air to flow and for vehicle exhaust and dust to accumulate in the greenbelts; therefore, the PM2.5 concentration at 60 m in the multistoried mixed forests was the highest. As the position at 0 m was the source of pollution, the concentration was relatively high. In December and February, however, due to the highest plant density at 30 m and a large number of evergreens, PM2.5 from the road could be effectively adsorbed; therefore, the concentration at 30 m ranked the highest. In February, because of the low temperature near the ground, low wind speed, and less rainfall, the weather tends to be hazy, with a higher overall concentration of PM2.5. Compared with the downtown area, the average PM2.5 concentration at the sampling point was higher, which was consistent with the situation in spring.
3.1.2 Variation in PM2.5 concentrations in different seasons
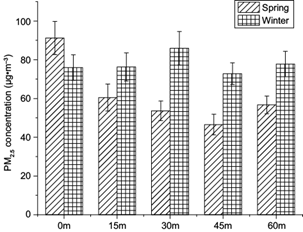
Figure 4 shows a comparison chart of the PM2.5 concentrations at the five monitoring points in the greenbelts in spring and winter. Except at 0 m, the PM2.5 concentrations at the other four locations all followed the following pattern: winter > spring. This result was due to the position at 0 m was open, and wind exerted a larger influence on the variation in PM2.5 concentration than other factors. As wind speed in winter is faster than in spring and wind can rapidly lower the concentration of PM2.5, the pattern at this point was spring > winter. The position at 45 m is the center of the multistoried mixed forests, where the PM2.5 concentration was the lowest in the two seasons, which shows that this point is more effective in retaining PM2.5 than the other four positions. In spring, as the plants are in their growing period, their new leaves can spread out quickly to strengthen their ability to retain PM2.5, while in winter, they are in their resting period, so the evergreens’ ability to adsorb PM2.5 is weakened. This occurs for the deciduous plants, which only have their trunks left. As a result, the ability to retain PM2.5 in winter is the weakest of the year. In the meantime, the concentration of PM2.5 was the highest throughout the year, and the air quality was the poorest due to coal burning for heating, which is also proven by the data at the sampling points.
3.2 Reduction rate of PM2.5 concentration
From a dispersion perspective, it is generally known that vegetation acts as a windbreaker or momentum sink, thereby reducing mixing, dilution, and ventilation (Morakinyo and Lam, 2016). Vegetation can inhibit the diffusion of atmospheric particulates to improve air quality. To analyze the capacity of the greenbelts in retaining PM2.5 horizontally in a quantitative way, the roadside (0 m) was taken as the reference point to assess and compare the reduction rate of PM2.5 concentrations at different ranges in spring and winter.
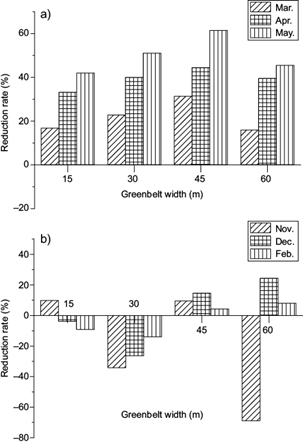
3.2.1 Reduction rate of PM2.5 concentrations in different seasons
Figure 5 indicates the reduction of PM2.5 in spring and winter. Greenbelts at different distances can decrease PM2.5 concentrations in spring, while in winter they increase. The reasons are the following. In spring, deciduous plants in Hangzhou begin to sprout, and their leaves start to grow and spread, thus, the surface area of the leaves increases and the contact area with atmospheric particulates increases, thus PM2.5 can be more effectively retained. The reduction rate of PM2.5 in spring follows the ranking May > April > March; in terms of distance, the rank is 45 > 30 > 60 ≥ 15 m. In winter, because of the influence of external factors (meteorological factors, structure of plant community, etc.) on the reduction rate, the concentration of PM2.5 increases. The reduction rate at different distances varies greatly. In November, the rank is 45 > 15 > 30 > 60 m, while in December and February, it is 60 > 45 > 15 > 30 m. The reduction rate at 60 m differed greatly, which can be attributed to factors such as the canopy density of the plant community, planting density and degree of porosity. According to the theory of diffusion and deposition effects, the effectiveness of lowering the concentration of PM is related to the distance from the pollution source. Deposition is higher when a higher vegetation barrier volume is placed closer to the source region, while dispersion is stronger when the vegetation barrier is placed farther from the source region (after the distance to maximum concentration). Therefore, with the increase in thickness and height of the vegetation barrier, the efficiency of reducing pollutants can also be improved. After analyzing PM2.5 retained by the greenbelts at different ranges in spring and winter, the reduction rates at 45 m were found to be the highest in both seasons. In spring, the reduction rate increased with increasing distance from 0-45 m and then declined at 60 m; in winter, there existed some hysteresis, and the reduction rate at 60 m was positive (except in November). Bao et al. (2016) studied the ability of protection forests outside a city park to reduce PM2.5 and found that if broadleaved tree and grass forests were within the range of 15-45 m, the concentration of PM2.5 tended to decrease, and the concentration increased at 60-75 m.
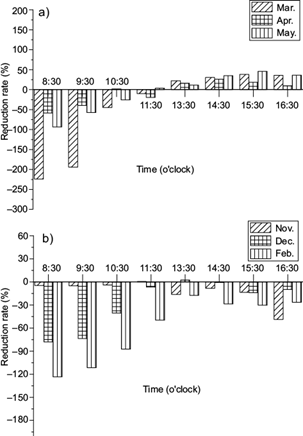
3.2.2 Reduction rate of PM2.5 concentrations at different time intervals
The reduction rate was calculated-with 12:30 LT as the reference time-after comparing and analyzing the reduction patterns of PM2.5 at 45 m at different time intervals. Figure 6 displays the variation in PM2.5 during spring and winter. The reduction rates in spring in the morning were all negative, especially in March, when the rate was the lowest before 9:30 LT, while they were positive in the afternoon. The main reason for this was the high relative humidity in the beginning of the experiment, which could inhibit the spread of PM2.5 and lead to the increase in PM2.5 concentration. As temperature increased and relative humidity decreased, the concentration of PM2.5 declined. In winter, the reduction rate was always negative, but the rate in the afternoon was obviously higher than in the morning. In conclusion, the ability of greenbelts to reduce PM2.5 is affected by external factors, especially meteorological factors.
3.3 Correlation analysis between influencing factors and PM2.5 concentrations in the greenbelts
3.3.1 Correlation analysis between PM2.5 concentrations and meteorological factors
An obvious negative correlation occurs between PM2.5 concentrations and temperature. Atmospheric particulates exhibit continuous Brownian movement. As temperature increases, the movement intensifies and the PM2.5 concentration decreases. A notable positive correlation occurs between PM2.5 concentrations and relative humidity. As relative humidity increases, the particulates in the air tend to coagulate more easily, which leads to increases of PM concentration. However, an obvious correlation was not observed between PM2.5 concentrations and wind speed (Table II).
Table II Spearman correlation index between PM2.5 concentration and meteorological factors.
| Month | Meteorological factors | ||
| Temperature | Relative humidity | Wind speed | |
| March, 2017 | -0.886* | 0.948* | 0.043 |
| April, 2017 | -0.190* | 0.530* | -0.217* |
| May, 2017 | -0.084 | 0.420* | -0.033 |
| November, 2017 | -0.651* | 0.569* | -0.117* |
| December, 2017 | -0.725* | 0.603* | 0.012 |
| February, 2018 | -0.229* | 0.823* | 0.066 |
*At a confidence level of (two-sided) 0.01, the correlation is significant.
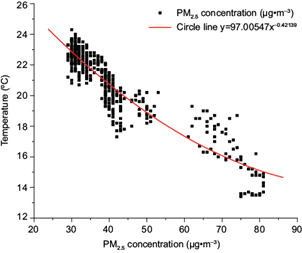
Temperature. Studies have shown that PM2.5 concentrations decrease as temperature increases and vice versa. A fitting analysis was conducted between PM2.5 concentration and temperature to better determine the correlation between them. An inverse proportional function can be obtained, i.e., y = 97.00547x -0.42139 (p < 0.0001) (Fig. 7). With increasing temperature, PM2.5 concentrations decrease drastically, especially when temperature is above 18 ºC. Scholars have suggested that with increases in temperature, the vertical convection current intensifies, which can accelerate the transmission of particulates and facilitates sedimentation (Li et al., 2015b). However, other researchers have indicated that increases in temperature strengthen photosynthesis in plants, which increases the plants’ ability to retain and adsorb particulates, thereby decreasing PM concentrations in the air (Nowak et al., 2006).
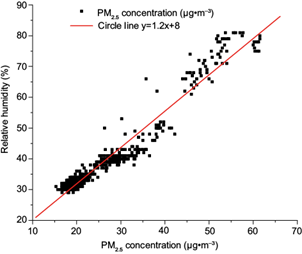
Relative humidity. After several continuous sunny days, relative humidity was low, and at this time, the changes in PM2.5 concentrations and relative humidity over time were consistent with each other. A proportional function, i.e., y = 1.2x + 8 (p < 0.0001), is obtained after the fitting analysis (Fig. 8). Relative humidity can influence the secondary generation of inorganic aerosols by affecting the liquid-phase heterogeneous reaction on the surface of particulates. An increase in relative humidity accelerates the accumulation of secondary inorganic components (sulfate, nitrate and ammonium salt), which contributes to increasing the PM concentration (Quan et al., 2015). In addition, increases in relative humidity and leaf wetness can also trigger other bioparticle emission mechanisms, such as the active wet ejection of fungal spores or hygroscopic swelling-induced pollen fragmentation (Huffman et al., 2013).
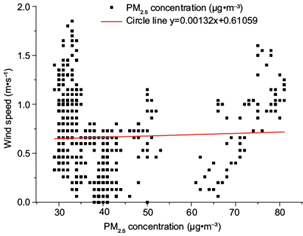
Wind. Wind speed and wind direction have considerable impacts on air flow and pollutant dispersion. Wind speed determines the dilution effect of atmospheric dispersion and the distance over which pollutants can be transmitted, while wind direction influences the direction of the diffused contaminants at the horizontal level. Beckett et al. (2000) discovered that the retention ability of leaves and the deposition speed of PM increased with increasing wind speed when it was lower than 8 m s-1, but a further rise in wind speed might lead to a decrease in the retention ability and deposition speed. Wang et al. (2015b) concluded that the concentration of atmospheric particulates first increased and then decreased as wind speed increased, and it reached a maximum at extreme wind speed (14 m s-1). These results illustrate that a breeze may not contribute to the diffusion of PM but rather might increase its concentration. Zhang et al. (2015) found that pollutant concentrations were much higher on the leeward side of street canyons than on the windward side. On the experiment days, the weather was fine to reduce the influence of drastic changes of wind. Wind speed during the experiment was less than 2 m s-1, which could not significantly affect PM2.5 concentrations in the greenbelts (Fig. 9). Changes in wind direction were complicated and random. In spring, wind mainly came from the north and northeast, whereas in winter, it mainly came from the north and west. Although the directions in the two seasons were different, they were basically perpendicular to or nearly perpendicular to the greenbelts. The greenbelts are in the downwind direction. Automobile exhaust from roads was the primary source of PM2.5 in greenbelts, which was transmitted to the greenbelts by wind.
3.3.2 Correlation analysis between PM2.5 concentrations and the plant community structure
To further analyze the relationship between the PM2.5 concentration and the plant community structure of the greenbelts, the plant species, height, canopy density and degree of porosity were studied and calculated. The data of deciduous plants were measured in three periods, sprouting period, spreading period and mature period. A region of Rhododendron pulchrum was observed at 15 m, being 8 m wide and 0.7 m high; thus, the weighting method was applied as a compromise. The area from 0-15 m was a single structure (lawn); from 15-60 m there were multistoried mixed forests, and at 30 m there were evergreen deciduous broadleaved forests. The location at 45 m was composed of deciduous coniferous broadleaved forests, and at 60 m, there were evergreen broadleaved forests. The canopy density and the degree of porosity of the community at 45 m differed greatly around the leafless period and the mature period. Spring was taken as the research period because the three stages of plants (sprout, spread and maturity stages) were distinct at this time and thus helped with the recording and observation. Table III shows the value of canopy density and the degree of porosity at the monitoring points.
Table III Statistics of the community canopy density and the degree of porosity in the greenbelts.
| Item | 15 m | 30 m | 45 m | 60 m | |||||||
| Leafless period | Leaf period | Leafless period | Leaf period | Leafless period | Leaf period | Leafless period | Leaf period | ||||
| Canopy density | 0.20-0.28 | 0.25-0.32 | 0.55-0.60 | 0.63-0.70 | 0.49-0.58 | 0.75-0.85 | 0.85-0.90 | 0.89-0.95 | |||
| Degree of porosity | 0.81-0.86 | 0.74-0.82 | 0.42-0.48 | 0.30-0.38 | 0.40-0.55 | 0.25-0.36 | 0.10-0.15 | 0.09-0.12 | |||
Based on the Spearman’s correlation analysis between the PM2.5 concentration and the canopy density and porosity degree of the greenbelts, it can be concluded that PM2.5 concentrations are positively correlated with the canopy density and negatively correlated with the porosity degree, although neither of the correlations are strong (Table IV). According to the above analysis, the greenbelts at 45 m have the strongest ability to retain PM2.5; therefore, another correlation analysis comparing PM2.5 concentrations with the canopy density and porosity degree from 0-45 m is presented in Table V. The results revealed that the PM2.5 concentration was strongly positively correlated with the canopy density and negatively correlated with the porosity degree when the leaves were completely mature. During the leafless and spreading periods, there was no obvious correlation between the PM2.5 concentration and the canopy density and porosity degree, which shows that the structure is not a major factor influencing the variation in PM2.5 concentrations during these two periods. The fact that the PM2.5 concentration is not strongly correlated with the canopy density and porosity degree in the greenbelts between 0 and 60 m in the mature period indicates that there is a threshold value that must be reached. Studies show that when the canopy density is between 0.75 and 0.85 and the degree of porosity is within 0.3-0.4, the ability of plant communities to retain PM reaches its maximum (Yin et al., 2007; Bao et al., 2016). This conclusion is similar to our results. Liu et al. (2015) claimed that vegetation could reduce the PM2.5 in air effectively, and this ability could reach its peak when leaves spread out fully.
Table IV Spearman correlation index of PM2.5 concentration with the canopy density and porosity degree in the greenbelts (0-60 m).
| Item | Leafless period-initial spreading stage | Final spreading stage-mature period |
| Canopy density | 0.246 | 0.317 |
| Porosity degree | -0.431 | -0.230 |
Table V Spearman correlation index of PM2.5 concentration with the canopy density and porosity degree in the greenbelts (0-45 m).
| Item | Leafless period-initial spreading stage | Final spreading stage-mature period |
| Canopy density | 0.620 | 0.930* |
| Porosity degree | -0.400 | -0.920* |
*At a confidence level of (two-sided) 0.01, the correlation is significant.
3.3.3 Correlation analysis between PM2.5 concentrations and traffic flow
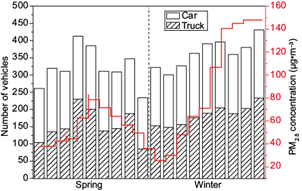
Maina et al. (2018) measured the heavy metal content in PM and the PM2.5 concentrations along the Thika expressway, Kenya, and found moderate to high levels of Cd, Pb and Zn pollution. Longley et al. (2015) monitored the concentrations of PM10, Pb, NOX and NO2 along a main highway in Auckland, New Zealand and set reference points 150 m east and 250 m west of the highway. The average increments in concentrations near the road were 1.1 times, 1.6 times and 1.6 times those at the reference point Figure 10 shows that when the traffic flow increases, the average concentration of PM2.5 in the greenbelts also increases, which is more obvious in spring than in winter, and trucks play a major role in the increase in PM2.5 concentration. The correlation between PM2.5 concentration and traffic flow is stronger in spring than winter.
4. Conclusions and discussion
The average PM2.5 concentration in the greenbelts in the idle zone near the Lin’an toll station along the Hang Rui expressway in winter and spring was higher than that in downtown Hangzhou, and the sample area was more heavily polluted. After investigating the surrounding area within 5 km of the sample plot, there were no large polluting sources. The nearby region was mainly composed of farmlands and forests, and the expressway was close to the arterial roads of the city. Therefore, the major pollution sources were vehicle exhaust and the diffusion of pollutants in the district. However, because the PM2.5 concentration downtown was lower than that in the sample area, the major pollution source was considered to be vehicle exhaust, especially from large trucks, according to the diffusion principle.
Except at 0 m, the concentrations of PM2.5 at the other four positions were higher in winter than in spring. In spring, the PM2.5 concentration from 0-45 m showed a linear decreasing trend, but when the distance was larger than 45 m, the concentration increased instead. In winter, PM2.5 accumulated at 30 m and showed a high concentration because rainfall in spring was 2.5 times that in winter in Hangzhou. Relative humidity in the multistoried mixed forests in spring was higher, which enabled the deposition of particulates. In winter, however, temperature and air pressure decreased, and wind speed was higher than in spring. Since the sample area in this study was relatively small, the concentration of PM2.5 was not significantly correlated with wind speed. The PM2.5 concentration at 30 m was the highest in the greenbelts because multistoried forests had the greatest density due to the large number of evergreens, which can effectively retain PM2.5 from the road.
The reduction rate of PM2.5 at 45 m was the largest and was positive in both seasons. The reduction rate in different winter months varied substantially, which showed that the structure of the plant community can also affect PM2.5 concentrations in addition to meteorological factors.
The canopy density and the degree of porosity at 45 m in the greenbelts differed the most in the leaf and leafless periods, followed by measurements at 30 m, while the differences at 15 and 60 m were the smallest. Based on these studies, PM2.5 concentrations were found to be significantly correlated with the canopy density and the degree of porosity only in the mature period from 0-45 m. After analyzing the structure of the plant community at different ranges in the greenbelts, it was discovered that the rank of degree of porosity in the leaf period was 0 > 15 > 30 > 45 > 60 m, while in the leafless period, the rank was 0 > 15 > 45 > 30 > 60 m. In winter, as wind can diffuse the particulates in air, these accumulate easily at 30 m due to the large canopy density and the degree of porosity there. The degree of porosity at 45 m in the leafless period was 1.5-2 times larger than in the leaf period, which was favorable for the diffusion of particulates and the decrease in PM2.5 concentrations. Among the indices of community characteristics, the influencing mechanisms of distance, canopy density and degree of porosity on the variation in PM concentrations still require further study. Since the retention effect of plant communities with multiple structures is stronger than that of lawns only, it is suggested that multistoried mixed forests should comprise the majority of vegetation in the greenbelts. Since the reduction rate at 45 m was preferable in both winter and spring, it is proposed that the width of greenbelts should be longer than 45 m, and the canopy density and degree of porosity should be controlled within 0.75-0.85 and 0.2-0.3, respectively, to reach the best retention of atmospheric particulates.

